I got asked this again and decided to publish this as a blog post instead of in an email because this is such a common misconception.
First, read Vacancy Truths from September 2021 for background. There's a link to Darrell Owens' explanation about why home might be vacant and what we can learn from US Census Data. If a rental changes tenancy every 2 years, and it takes a month to clean/rehabilitate/lease out the rental. Thus, a 1/48 or 2.1% vacancy rate can mean essentially no open homes available.
As housing stock gets older, it takes longer to rehabilitate the units. Supply chain issues are also increasing the amount of time it takes to build new homes or spruce up old ones. It's not unusual to spend 2-6 months remodeling. A major SoCal developer announced to investors that home building is taking 6-8 weeks longer due to lack of materials and/or workers, citing kitchen cabinets as a major pain point.
The particular question from yesterday was from new homes in Pasadena, CA. She was sure that the new buildings in Pasadena are vacant and that developers get tax breaks to keep them vacant.
Intuit explains that there is no tax break for loss of income while a rental (or for-sale) home is vacant. A lot of subsidized homes are built with the Low Income Housing Tax Credit (LIHTC). Wait lists for subsidized homes are years (often decades long), so there is no difficulty filling the homes. If there are people who need subsidized homes, and you keep LIHTC-financed homes empty, you lose your tax credits. No sane builder would do that. I checked the most recent HUD data on LIHTC units (nationwide data) and they had a 3.97% vacancy rate in 2019.
Darrell Owens has helpfully extracted US Census data from 2010 and 2020 for all cities in California and shared it in a Google Sheets.
In 2010, Pasadena had 59,551 homes (4,281 vacant) and 137,122 people
In 2020, Pasadena had 61,643 homes (3,659 vacant) and 138,699 people
This means that Pasadena added more homes than people in the last 10 years. This is not a failure in planning. This reflects the general trend of households (HH) trending smaller and older people staying in their homes longer, even if they don't need all that space. Younger people can't afford the single family homes (SFH) or don't have the down payments required to purchase SFHs or condos, so they end up living in the apartments downtown.
It's possible that some of the new infill homes in central Pasadena are vacant, but they may still be under construction (lack certificate of occupancy), rentals being readied for a new tenant, or be for-sale condos waiting for a buyer. (For-sale homes are vacant longer than for-rent homes.)
Let's look at the data from the SCAG Local Profiles for communities in the 6-county (Ventura, LA, OC, Riverside, San Bernardino, Imperial) SCAG region. I pulled these charts from page 12 of the Pasadena Local Profile, 2018. They are derived from building permit data. Some of them are rebuilds and do not produce net new homes. (Likely source of discrepancy between the SCAG and Census data.)
Pasadena has done a better than average (for the region) job of building new homes in the downtown area. That is also why so many young people live there. New people (young people forming households, newcomers to the area) will flock to where the open homes are.
It may seem like there is a lot of construction, especially downtown, but it's a sampling bias. The
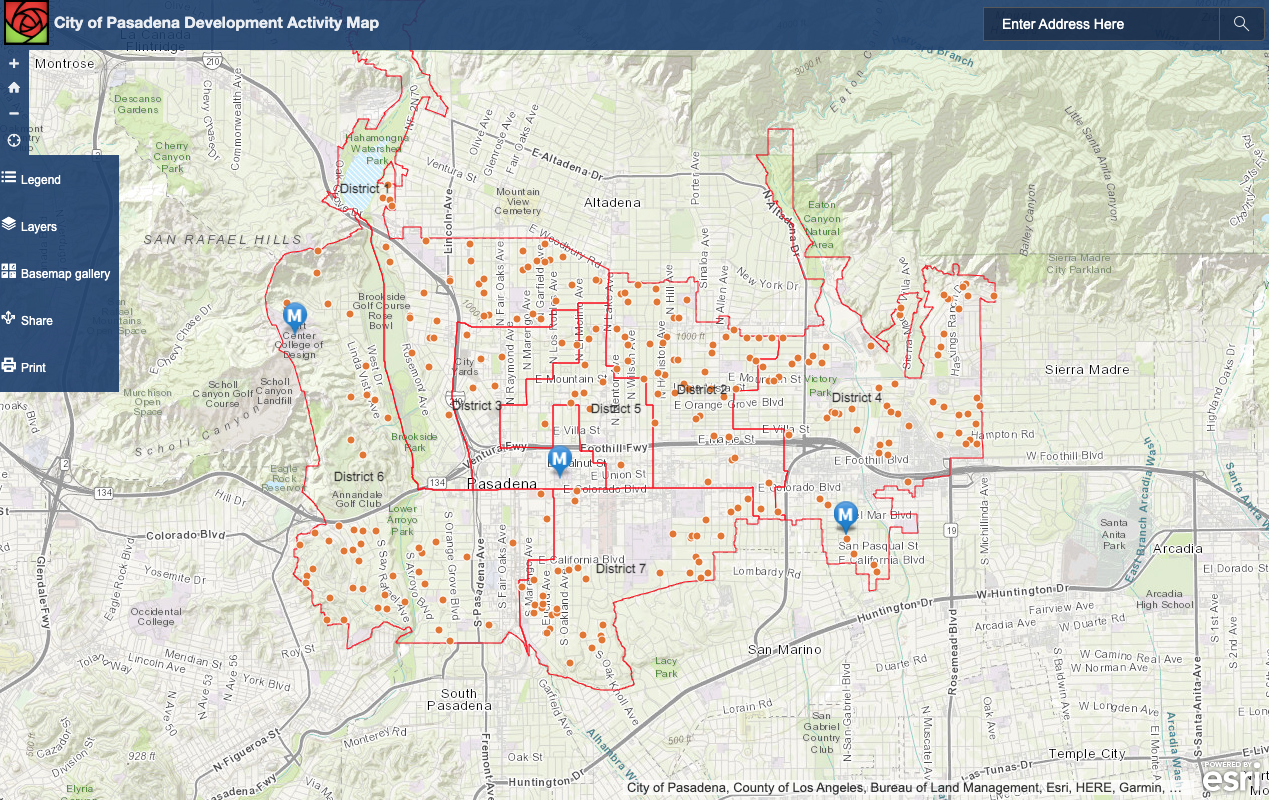
City of Pasadena Development Activity Map shows building permits distributed throughout the city, but many of them are remodels or ADUs. The big construction projects are downtown, along major streets and freeways, because that is the only place cities allow them to be built. If we are driving around on the major roads (as most of our driving should be) we'll see more of the major projects. Explore the map; click on the orange dots to view data on each building site.

Pasadena has 53% working age population (20-64) supporting 47% elderly (65+) or youngsters (0-19) for a dependency ratio of 0.89. Redondo Beach has 44% working age population supporting 56%, for a dependency ratio of 1.27. If you don't provide for young people, then your children will have to move elsewhere, and that can socially isolate the elderly as they age out of driving. My home town of Redondo Beach is facing the Silver Tsunami with no plan.