Showing posts with label Los Angeles. Show all posts

Saturday, April 12, 2025

Motonormativity 2

I wrote an LA Voter newsletter (for members of League of Women Voters in Los Angeles County) article about Motonormativity and the way that local, state and federal governments reinforce it with their laws and actions. 

Professor Ian Walker wrote in the 2023 paper, Motonormativity: how social norms hide a major public health hazard, “Decisions about motor transport, by individuals and policy-makers, show unconscious biases due to cultural assumptions about the role of private cars - a phenomenon we term motonormativity.” 

His results were replicated in in the US by Professor Tara Goddard in the 2024 paper, Windshield Bias, Car Brain, Motornormativity: Different Names, Same Obscured Public Health Hazard. 

Past WIG speaker and public health researcher Isabella Chu, MPH, also spoke about the hidden public health hazard that is the top killer of US children. Indirectly, through air pollution and involuntary inactivity by making active transportation (walking, cycling) dangerous, cars may be the top killer of people in the developed world of all ages. 

Transportation, mainly private automobile use, is the largest contributor of CO2 emissions in Los Angeles County and the largest source of PM2.5 pollution (except in the occasional years when particulates from wildfire smoke affects populated areas of LACO.) 

Yet, all this is invisible to most people and especially law and policy makers. In California, it is legal to kill with a car as long as you were not intoxicated, were not speeding, and stayed at the scene of the death. This applies even if a driver kills a cyclist in a crosswalk

ILO wrote a letter to Metro’s Board of Directors for omitting protected bike lanes on the Vermont Ave BRT (Bus Rapid Transit) project plans. The City of LA’s Mobility Plan 2035 (adopted in 2014) promised to address identified shortcomings by 2035 by implementing the plan as each section of the roadways had work done. The Mobility Plan showed Vermont Ave would receive both a protected bike lane and a bus priority lane. 

Vermont Ave is infamous as more people die on Vermont Ave due to traffic violence than in the entire state of Vermont every year. (This does not include deaths due to pollution and other indirect deaths.) The LA Times explained the situation in Lawsuit filed against L.A. over lack of bike lanes, claiming Measure HLA violations

Local actions are even more important as we can no longer count on the Feds to help us. Under the Reagan Administration, Federal transportation dollars were allocated in a rigid formula of 80% to highways and 20% to transit. 

The Secretary of the Department of Transportation is Reality TV and Fox Business personality, Sean Duffy. He made headlines recently when he rode the NYC subway with NYC mayor Eric Adams and subsequently told Laura Ingraham on Fox News that "even big men don't want to ride the subway." 


“Most transit trips include active transport (walking and/or cycling) links, and transit users tend to walk and bike more in total than motorists (Lachapelle et al. 2011). These modes have relatively high per-mile casualty rates, although this risk is largely offset by reduced risks to other travelers and improved public fitness and health, so per capita crashes tend to decline and overall health and longevity increase with more active travel in a community (Rojas-Rueda et al. 2011).” 
Transit is so safe that a 1% increase in transit mode share would result in a 2.75% reduction in road deaths. 
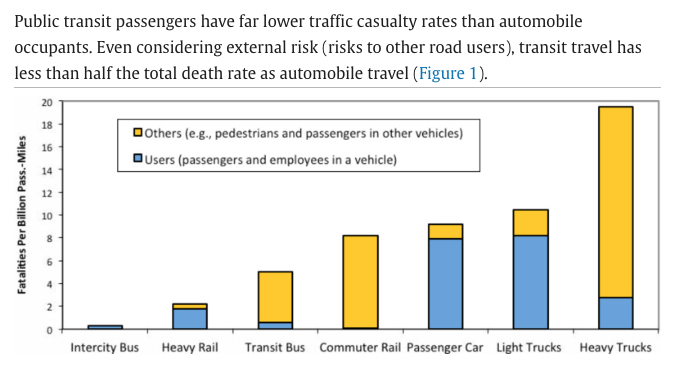

State lawmakers show similar characteristics of motonormativity. Until September 6, 2023, Californians could purchase EVs (electric cars) secure in the knowledge that they would receive guaranteed rebates of up to $7,500 for each EV, and that these would stack on top of Federal rebates of $7,500. The income cap was $200,000 for joint filers. California passed out over $1 Billion in EV rebates. 

Contrast that with the California eBike incentive, which has an income cap of $61,320 for a family of 2, and which exhausted the entire $10 Million allocated to eBikes within minutes. eBikes received only 1% as much money as EVs, despite global research showing that dual-mode households drove 19% less than before they obtained an eBike

 “Transportation is a climate and feminist issue. CA DMV data shows that women will spend twice as many years aged out of driving as men. Yet, our cities have not built infrastructure for people who don’t drive. 
… Car dependency is not just ruinously expensive, but it’s destroying the planet, and preventing nondrivers from fully participating in society. Women, as primary caregivers, are paying the time tax of chauffeuring people around. Protected bike lanes are mobility lanes, suitable for children on bicycles and seniors on mobility scooters alike.   
Local government decisions have kept us isolated and stressed.”

Thursday, April 03, 2025

SCAG, HQTA & RHNA Update

A college student reached out to me after reading SCAG, HQTA & RHNA: Acronyms you never heard of but should understand and I found the questions so intriguing, they deserved to be answered right here on the blog.  

First off, I think it's important to state that I used the Torrance Transit 8 bus line as an example, but I do not want to pick on Torrance Transit in particular. The example is just indicative of transit declines and difficulties in our region overall. 

 -How have you seen the quality of Torrance buses declined in the last 5 years? 
I wrote the post in 2022, when many people were working remotely from home. Those were the lowest years for transit service. In our area, transit service had declined for 15 years, and then fell off a cliff during Covid 2020. However, service is slowly being added back. We went from a high of 41 Torrance trips/weekday to 13-14, and we are back up to 24. I am cautiously optimistic that more service will be added as ridership returns and more bus drivers are hired. 

-What areas have you noticed the most decline? (cleanliness, punctuality, bus frequency) 
I notice the lack of bus frequency the most. Punctuality isn't a problem any more because the schedules are adjusted 2x/year for actual bus travel times. Buses report their real-time location and I can check how soon my bus is coming on my phone. Torrance Transit also provides a text number at each stop that sends a return text of when the next bus is arriving. 

While knowing when the next bus is arriving is helpful, the bus is still stuck in traffic too much of the time. Dedicated bus lanes and bus signal priority would be most helpful. Bus stop consolidation (Torrance 8 and 13 stops can be as little as 700 feet apart), would also speed up buses. 

 -Can you share a time where you were heavily inconvenienced by an event you scheduled and your method of transportation was Torrance Transit (TT)? 
I don't schedule my League of Women Voters of the Beach Cities meetings. But, the Torrance 13 schedule means I am either 20 minutes early or 10 minutes late for the 3pm meetings in Hermosa Beach. There are worse things in life than hanging out for 20 minutes with an ocean view. During the summer when it stays light later, I ride my eBike. Motorists hit so many cyclists at dusk and at night, I feel safer taking transit or driving in the winter. 

My daughter chimed in that she was ghosted by 2 buses this month. She also got on the wrong bus one time and ended up at Torrance Transit Center instead. But those things can be fixed with a taxi or scab cab. She has the RideYellow (yellow cab coop) and Lyft apps on her phone and the charge goes to her parents' credit card. She uses it only in an emergency or when the bus goes awry. 

Not every transit rider can afford a backup cab fare, and that is an issue that needs addressing. Metro sometimes reimburses riders for cab fare, but the amount doesn't cover the full cost of the cab fare. 

-What do you believe TT could do to improve their public transportation throughout the city? 
-Do you have any assumptions as to why TT has declined in quality over the years? 
I have talked to TT staff and know why service has deteriorated. It's partly due to ridership declines and partly due to reduced schedules. Those are chicken and egg problems. In a poorer neighborhood, people would pay the time tax and keep riding transit. In a wealthier area, people respond by purchasing cars and driving instead of riding transit. This has also worsened competition for street parking. Torrance is unique in passing a law that bars the city for charging for parking on city land, including streets and all city-owned lots and garages. 

DMV data shows that the South Bay has a decreasing number of residents with drivers licenses and an increasing number of registered cars. In fact, registered cars outnumber licensed drivers in the South Bay. 

Everyone complaining about difficulty parking is right. But we are the problem and transit (and eBikes/bikes) are the solution. 

Another big problem is elected leaders. Torrance city council and mayor make decisions about TT priorities, and they don't ride transit. 

They purchased a fleet of diesel "trolley buses" that resemble old-style streetcars from a century ago, instead adding to their existing fleet of the normal CNG (compressed natural gas) buses they already have. Not only are diesel buses dirtier, but they also mean that the staff have to maintain 2 different fleets with spare parts for both. 

Metro Los Angeles created a distribution network for CNG sourced from landfills, sewage treatment plants, but mostly dairy farms. Transit agencies throughout the region use Metro's refueling stations. Thus, the CNG buses throughout the region are 100% fossil fuel-free. 

People who don't ride transit are also obsessed with door to door service. So Torrance is investing in "micro-transit", which is incredibly expensive. LA Metro's experience is that it costs about $1-8 to serve a bus rider (depending on how many passengers are on the bus), but it costs over $60 per micro-transit rider.  It is incredibly wasteful and takes money and staff time away from fixed transit and para transit. 

Torrance Transit employees know this, because it is their job to keep up with developments in transit. However, they have to follow the direction of elected leaders who don't know transit and won't believe staff. 

 -Do you think that if enough people rallied together about the inconsistencies of the transit system the company would work harder for a solution? 
I don't think the staff is the problem. They cannot provide better fixed route bus service until we elect better leaders. 

Staffing is another bottleneck. It's hard to recruit new bus drivers as older ones retire. For a new trainee class of 20, they are lucky to have 3 graduates who complete the training and sign on as bus drivers. Finding the 20 trainees is also difficult as many young people cannot pass the mandatory drug test. 

Wednesday, April 02, 2025

Who lives in those apartments without parking?

 I have written many times previously about Parking Angst in the Los Angeles region. 

But, I want to write a quick post about why we should permit new homes without parking. 

Why do we vacation in places without parking and then deny ourselves the pleasure of living in a car-light place in everyday life? People who live in places that look like this (photo from Livable Communities Initiative) do use cars and get deliveries in trucks. It's just that they park on an alley or a remote lot/garage and deliveries take place when foot traffic is low. 

Pedestrian street lined with 2-3 story commercial or mixed use. Sun umbrellas, people walking around or enjoying the public space without cars.

I hear often from people that this won't work in LA because our area was built around cars. So let me tell you about two people I met who live in LA and don't own cars. 

Person #1 without a car: 

I met him several times while he dropped off or picked up his grandmother at League of Women Voters events. As I got to know them better, I learned that the grandmother is 100 years old and has no children nearby. He is her only relative nearby; he lives in an apartment 1/2 a mile away and rides a bike over to her house. 

He drives her car to take her on errands (they can do their grocery shopping together) and appointments. He rides a bike or takes the bus otherwise.  He lives on a major Metro LA bus line that runs every 10 minutes, which in planner speak is a High Quality Transit Area (HQTA). Click on the link for an interactive map of HQTAs in SoCal. 

A car parking spot in this area--close to jobs, transit, and the beach--is very expensive because of the high cost of land. You trade off building housing for people or housing for cars. The grandson chose to live without a car, saving the cost of car ownership and parking. It's a win for him, a win for her (because she has someone close to look after her), and for the community (he works in the arts, which has been struggling in high rent areas). 

Allowing cheaper housing without parking is clearly a win-win-win in this case. 

Person #2 without a car:

I only met her briefly in Koreatown, but she made quite an impression on me. I was walking from a meeting at Wilshire Center to the Metro B/D station at Vermont and Wilshire. She passed me slowly on her e-scooter while wearing scrubs and a backpack. I caught up to her as we waited to cross Vermont and Wilshire to reach the subway station. We chatted. Then she folded up her scooter and ran into the station, disappearing into the crowd.

She lived in an apartment in Koreatown where parking is a la carte. Her landlord wanted $300/mo (2019 prices) for a parking stall in a garage and she wondered how much she needed a car vs a nice apartment in a newer building.  

[Do the math on the $100,000 cost per stall for a multi-level parking garage, then double it for underground parking. $300/mo is not an unreasonable price to recoup the cost of building that parking.]

She was wearing scrubs so I assumed she worked in healthcare. She said that she was charged for parking at home and at work. In contrast, her workplace paid for transit passes. She added car payments, insurance, gas, parking, maintenance. She could save so much money, she could rent a car two weekends per month. 

She sold her car and bought her own e-scooter to get back and forth to the train station quickly. I asked her how often she rented a car. She said that, she met a boyfriend who has a car. They take weekend getaway trips in his car. On Sundays, they run their errands together and he drops her off at her house with her groceries. She budgeted for rental cars, but didn't need them. She saves the money instead.


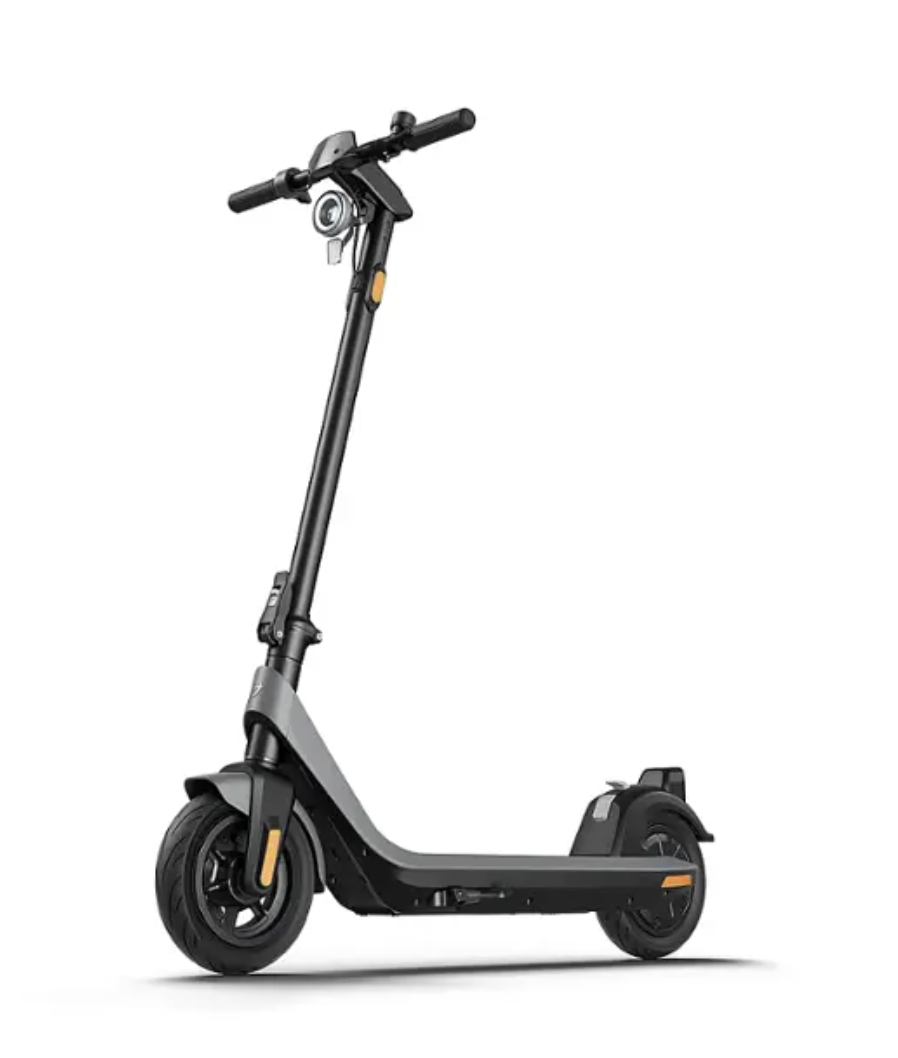
She basically had a 2018 version of this heavy duty, but slower speed scooter, purchased from Best Buy on Black Friday. It cost about one month of parking and she thought it was an excellent value. 

Faster speed means heavier motor and more acceleration (could be dangerous if you are inexperienced or lose your balance). More range means heavier battery to haul on buses and trains. If you are just going (first and last mile) to transit, and can charge at home or at work, there is no reason to get a longer-range battery. Just buy an extra charger and leave it at work. 

She convinced me. I bought a similar e-scooter, just in time for Covid and staying at home for Zoom meetings. You can see a picture of my husband riding the e-scooter and me riding my first e-bike on this SBCCOG Story Map

Before you say, gotcha. 

I know that neither of these people live car-free because they rely on someone else with a car. Both of these people live in car-free households, but occasionally share a car with another household with a single car. That's 0.5 cars per household. Why does Redondo Beach require 2.25 parking spaces per studio apartment?

It is possible for some people to live car-light or car-free most of the time, even in LA. Why should we enact all these minimum parking rules to make housing more expensive or impossible to build? 

Wouldn't it be lovely if our children could stay near us in coastal California instead of moving to a Red state so that they could afford housing?

Thursday, January 02, 2025

Wastewater Surveillance Sites

 My local wastewater treatment plant is one of the original CDC Sentinel sites where the CDC samples flu variants circulating in the population. I know that sewage-sheds are not perfect proxies for the general population. But, my wastewater (and that of 4.8 Million people in LA County) goes to the A K Warren Facility in Carson, CA. It's the largest treatment facility in LA County, the US, and among the largest in the world. 

The CDC sampled at a number of facilities around the country in different metropolitan areas, determined the circulating diseases discoverable from wastewater, and then formulated the flu vaccine supply accordingly. This is a backwards-looking process. What was circulating last summer may not be what is circulating now.  But, there is a long lead time to ordering vaccines and getting shots in arms. 

Anyway, we can test for a lot more things now. And, we have the capacity to test at more sites. I'm very nervous about what is at state now that Trump has lost the election and wants to install RFK Jr to lead the CDC. Most people won't know what we lose because they don't even know what the CDC does. This is just a small window in what this agency does.  

I just want to provide a few links to useful resources because Google Search has degraded so much, it's hard to find sites. Also, some sites have broken links--either moved elsewhere or lost their funding when the Covid Emergency declaration expired. 

This is what I could find today, Jan 2, 2025

CDC National Wastewater Surveillance System (NWSS) main page has state-level data. 


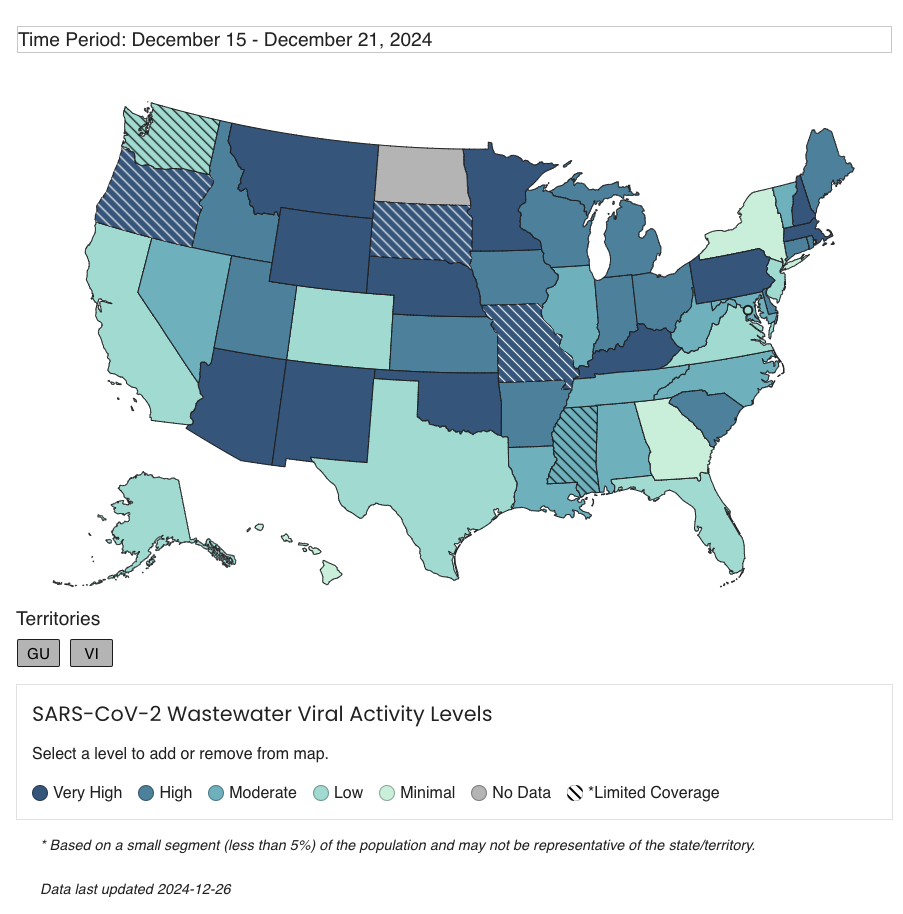
Click on See the data at the left toolbar and you reach a page where you can select the pathogen and domain to create charts. For instance, here is the regional Covid-19 chart. Note that the CDC website has data until Dec 21. 


California's Department of Public Health has a newly redesigned website and I am still trying to find stuff. I used to visit the Tableau Cal SuWers weekly, but the old link doesn't work or redirect correctly.

New CalSuWers site (made with R Shiny) has data last updated Dec 26. CalSuWers reports to CDC and the national network, so it's showing data that is a bit more recent. 

Read the instructions/caveats. Then navigate to the Regional Data top level page.   Use the menus of the left to select regional or sewage-shed data. Note that this plant last updated data on Dec 31. 


Unfortunately, this data tool only reports Covid-19 data. There's lots more data I found on other sites. 

Members of  the California Water Environment Association collect a lot more data, including research products in partnership with scientists throughout California and the world. 

List of Participating CA Wastewater Surveillance participants

The best site visualization site I can find right now that collates data from around the US is from WastewaterSCAN, a Stanford-Emory led effort. 

Select the region on their national map, then zoom by region and select by sewage plant. 


Click View Chart and you can see Covid-19, RSV, Influenza A or B, Human metapneumovirus, Norovirus, Mpox, EVD68, Candida auris, Hepatitis A (for the Warren facility). The number and type of tests vary by location. The most recent data is from Dec 25. 


Based on positive detections for Hepatitis A in my subregion, I am glad that I started the 3-shot series that combines vaccines for both Hep A and Hep B. Covid-19, RSV, Inf A & B, and Norovirus are all circulating as well. 


Meanwhile, our whole family came down with a cold. We bought the Covid-19 + Inf A + Inf B home test at CVS and we just had a plain old cold. It really ruined our holiday plans. 

Mask up and stay healthy! 

A couple of additional sites:

Inside Medicine COVID-19 Metrics Dashboard by Benjamin Renton

H5N1 Dashboard by Daniel Summers


Saturday, September 07, 2024

Cool Roof 2: Cool Roof, Cool City

 Los Angeles is in the middle of a record-setting (again!) heat wave. NWS reposts that LAX airport, along the coast, recorded a high of 102 F (old record of 99 F in 2020) while Downtown LA hit 112 F. 

Several people asked about our Cool Roof and Heat Pump. I wrote about replacing our asphalt shingle roof with a composite shingle "Cool Roof" back in 2012. Our roof went from reflecting 30% of solar heat (absorbing 70% of the heat) to reflecting over 70% and absorbing less than 30%. If you look closely at the shingles, they incorporate bits of recycled glass, tumbled to a frosted gray, green or blue. From a distance, it looks like a light-medium gray. You wouldn't even know it was a cool roof unless I brag about it. 

When you install a cool roof, you mitigate the Urban Heat Island (UHI) impact of urbanization. "Georgescu et al. (2012, 2013) reported that summertime statewide warming due to projected urban expansion for Arizona could be reduced by about 50% with the complete integration of highly reflective cool roofs." SoCal would likely be similar. 

So, which should you pick, a cool roof, a green roof, or a photovoltaic (PV) solar roof? The answer turns out to be dependent on local climate and geography. Materials change the radiative impact of buildings. They can reduce the amount of heating during the day, but they can also disrupt the amount of cooling at night. They can heat the air above the city, strengthening the urban heat dome. There are so many variables, it takes a radiative full-physics model and a supercomputer to track them all. 

Take the case of Phoenix and Tucson, studied by Salamanca et al: Citywide Impacts of Cool Roof and Rooftop Solar Photovoltaic Deployment on Near-Surface Air Temperature and Cooling Energy Demand. "In Arizona, cool roofs reduced daily citywide cooling energy demand by 13–14%, while rooftop solar photovoltaic panels reduced them by 8–11% (without considering the additional savings derived from their electricity production)."

But, if you were in London, Brousse et all found that cool roofs would be most effective in reducing extreme heat. Nonintuitively, green roofs wouldn't make much difference overall (but help during the day). Vegetation makes a minimal difference on a city-wide scale. Rooftop solar might have an overall heating effect, as would running AC. But, if the rooftop solar energy was used to run AC, and people could take shelter from the heat indoors, they could be a net benefit. 


Governments can encourage behaviors good for society and suppress behaviors that are detrimental with subsidies/fines. If you were running the government, you would like to find out the cost-effectiveness of different interventions (eg subsidies) and fund what gives you the most bang for the buck. If you had even more money, then fund the slightly less effective but still helpful stuff. 

COOL ROOFS reduce heat experienced inside the buildings and in the urban environment. Require them in new construction. Replace dark roofing materials with cool roofs first. If you have money left over install rooftop solar. 

In 2012, I got a 10% tax credit on the cool shingles we used, but that is only a small amount compared to total cost of installation.  The shingles cost the same as the darker colors in the same product line that absorbed more heat and didn't qualify for the tax credit. I didn't need a nudge of a few hundred bucks to do what I knew would make my house cooler. 

Adding rooftop solar was not on my radar back in 2012 because I figured that the prices were still high and technology was still changing. A few people in our neighborhood installed them, but they were much bigger energy consumers than we are. We hadn't installed a heat pump yet. 

BTW, Lawrence Berkeley Laboratory puts out an annual pricing survey called Tracking the Sun, with useful data on actual installed prices of solar systems. 


DIGRESSION:

When we got our heat pump back in 2020 (or maybe 2019?), people asked why we didn't get solar panels as well. I dragged my feet because the rooftop solar salesmen (and they are always bros) were so sleazy, and I also didn't want to buy anything made with forced labor. I was waiting for the solar supply chain to clean up. I am also waiting until I replace my roof again. The timing just wasn't right. 

Besides, I know that California has an excess of solar power during the day. It used to be worse, but utility-scale batteries have been soaking up the excess solar power so that we need to shut down feed in (curtail) solar farms less than in prior years. For the last month, we have been curtailing solar farms during all the hours rooftop solar would have produced at my location. 


Even during the heat wave this week, we had to curtail cheap solar farm power. 


Yes, even during the hottest day ever (so far) in LA. 


There just wasn't much value-add for society if I add solar panels to our cool roof. 


Thursday, February 01, 2024

True Cost to Own 2

I just heard a cringe podcast where they were discussing lack of street parking near our city's high school. One speaker said that, our region is hilly, and eBikes help with that. But not everyone's family can afford an eBike so many kids have no choice but to drive. 

This is a classic case of car brain where people no longer notice the high cost of car culture and car ownership. 

When our teen daughter was added to our car insurance policy, our premiums when up ~$2,000/yr even without adding another car. If your teen can delay becoming a driver by just one year, you can buy a decent eBike, lock, lights, and panniers. You will also save hundreds of hours chauffeuring your teen. 

Another year, another AAA "Your Driving Costs" report has dropped. It's time to update True Cost to Own. The cost of owning and operating a new vehicle in the US has increased to $12,182 in 2023.  New cars cost 4.7% higher than in 2022, but used cars went down in price. 

Remember, this is an average over the entire US, and Los Angeles tends to have higher insurance and fuel costs (both gasoline and electricity). This is also for the average new car sold which, at $34,876, is significantly cheaper than the typical new car I see in our school district (Tesla Y, ~$45,000-$52,500). 

The typical behavior in our area is for the parent to buy a new car and give their old car to the teen. Then they park the old car out on the street, making street parking even scarcer. It's not more people making street parking scarcer. It's more cars. 


I'm doing the calculation a bit differently this year, inspired by a LA Times article about a Culver City High School teacher that had their students run the numbers on car ownership over a lifetime. I don't get into the messiness of predicting inflation rates or marginal tax rates. 

Suppose you don't buy that new car and save that money instead in a balanced mutual fund. Using the Vanguard Benchmark Returns on Target Retirement Funds, you can expect to get ~8.25% long-term returns 


Using an online Savings Calculator, assuming 
Annual Savings: $12,182
Annual Increase in Savings: 3% (car costs have been going up faster than that)
Returns: 8.25% from balanced funds above
Taxes: 0% (if in tax-advantaged retirement account)

Then you have $1,0983,667.47 in year 24. 

Start when you turn 16, and save a million dollars by 40. 

In 50 years, age 66, the car-free saver will have $11,199,484.63. 

But, wait, you can save $18,264 pre-tax (33.3% combined CA+Fed tax rate) while $12,182 car costs are post-tax. But then you pay taxes on withdrawal from retirement accounts. So the amount will vary, but the message is the same. Living car-free or car-light (my family) is a huge money saver. 

Now I want to talk about the really pernicious part about car ownership, the externalized costs borne by others. 

This is painfully obvious to me every time I go to city council to beg for a bike lane and am turned down because "poor people need a free place to park their vehicles" on the public streets. 

I am charged the same price for my groceries whether I use the supermarket's huge and hugely expensive parking lot. I walk or bike to post of my groceries. I even bike to Costco for some of my trips. Yet, I pay for that parking lot. 

Even though road wear is proportional to axle weight to the 4th power, I am paying property taxes to maintain my city streets even though I get around on a 50# eBike instead of a 4,500# electric SUV. 

A 2020 Harvard Kennedy School study found that Driving is more expensive than you think. "Massachusetts' car economy is roughly $64.1 Billion, with more than half of that coming from public funds."

"Using publicly available data, the authors put the annual public tab at $35.7 billion, which amounts to about $14,000 for every household in the state. Those that do own vehicles pony up an additional $12,000 on average in direct costs."

You might nitpick that Massachusetts is snowy and snow plows are expensive. But, a 2021 Ulupono Initiative study in Hawaii found that "Public costs amount to roughly $15,000 per taxpayer ($24,400 per household), annually, even if they don’t own a car."

Furthermore, "Personal vehicles cost an additional $16,200 per household per year. With the public costs above, each household’s costs total $40,600 per year (or 51 percent of pre-tax income)."

Then there is the opportunity costs of the land. "Land value of public lands dedicated to road, highways, and parking is $3.9 billion, covering about 14 percent of the available urban land in our state."


Next time you see me bicycling for groceries, thank me for subsidizing your roads and parking. And drive carefully and slowly around cyclists. Dangerous road conditions are what's holding back the 60% of the public that is "interested but concerned" about riding bicycles. The more of us that are bicycling; the fewer cars in front of you, competing with you for parking, polluting your air, costing your city big bucks in road repair and climate change adaptation...


“Existing law requires the driver of a motor vehicle that is passing or overtaking a bicycle to do so in a safe manner, as specified, and in no case at a distance of less than 3 feet.

This bill would additionally require a vehicle that is passing or overtaking a vehicle to move over to an adjacent lane of traffic, as specified, if one is available, before passing or overtaking the bicycle.”

Drivers are required to pass cyclists with at least 3 feet of clearance (and that is from the furthest point of my bike, including handlebars and cargo).  If there is more than one lane, drivers are required to change lanes before passing cyclists, just as they would do when passing another vehicle. This is why it makes sense for cyclists to ride 2-3 abreast in a pack instead of strung out in a single file line. Drivers can pass them in a shorter distance, making it safer and more convenient for everyone. 

This is now in California Vehicle Code 21760


Wednesday, August 23, 2023

The ghost of wells past

Remember when I wrote that I wasn't that worried about PFAS chemicals in my drinking water? I'm still not worried about it. But several things stood out when I looked at the 2022 Hermosa Redondo Water Quality Report


I expected to see small (but safe) amounts of Uranium from the imported drinking water purchased from Metropolitan Water District (via West Basin Municipal Water District). That's a blend of Colorado River and Sacramento-San Joaquin Delta water. For myriad reasons, water from the 4-corners states in the Colorado River Basin contains Uranium and Radium. 

But, why does my local groundwater contain more Uranium than the water imported from the states where we used to mine Uranium, and make and test bombs? I posted that question on the social media platform formerly called Twitter and had my answer in minutes. 

I found a map of active water wells from LA County Dept of Public Works. Unfortunately, I couldn't figure out how to download the map and combine it with other data so you'll just see a screenshot. Look at the 3 aqua balloon pins near the right of the map, just west of Inglewood Blvd. 


Now look at the map of Oil Wells (Inside LA County) from City of Los Angeles GeoHub


See the old oil wells that used to operate in the vicinity of the active water wells? 

EPA: Radioactive Waste Material From Oil and Gas Drilling

Rocks in and around certain oil- and gas-bearing formations may contain natural radioactivity. Drilling through these rocks or bringing them to the surface can generate waste materials that contain radioactivity.
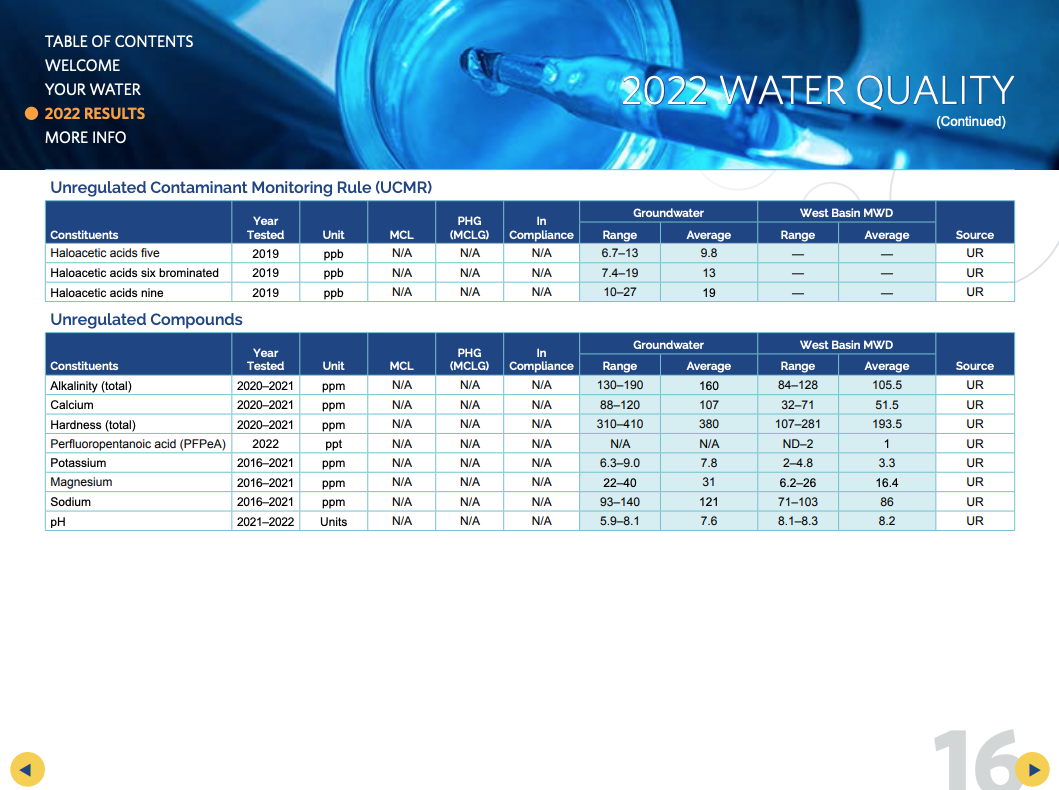
I'm drinking a blend of local groundwater and imported river water with an average of 2.3 pCi/L and 1 pCi/L of Uranium respectively. 

The federal EPA Maximum Contaminant Load (MCL) for Uranium in drinking water is 20 pCi/L (one trillionth of a Curie per Liter; a Curie is a measurement of radioactivity). However, there are measurable increases in negative health outcomes for water above the EPA MCL Goal (MCLG) of 0.43 pCi/L. 

This is concerning but not panic inducing (at least for me.) Reverse Osmosis (RO) reduces contaminants in water, including Uranium and PFAS chemicals. RO also reduces the calcium salts responsible for Water Hardness. Anything above 300 ppm (parts per million) is considered hard water. Imported river water is semi-hard, at ~200 ppm, but the groundwater here is 380 ppm. 

I would be happy to pay for RO treatment of household water. The small extra expense would reduce wear and tear on my home's plumbing and my housecleaning time. It's a worthwhile tradeoff. 


[The EIR for West Basin's abandoned plans to build a desalination plant estimated that the RO-treated ocean water would have saved customers an average of $300/year in reduced plumbing and appliance replacement expenses. Coastal NIMBYs enjoying 100% imported river water blocked the plant despite support from inland communities using very hard groundwater like mine.]

Today's LATimes features an excellent profile about Adel Hagekhalil, general manager of Metropolitan Water District of Southern California. He talks about the existing three pipelines that bring water from the Delta, Owens Valley and the Colorado River. He advocated for developing our "Fourth Pipeline" of local water sources. 

I fully support that vision; it's an achievable goal. But let's not kid ourselves that it will be easier or cheaper. There are tradeoffs for everything, as I learned from the Water and Infrastructure Group lecture series I co-organize. Understanding Drinking Water Quality taught me the limits of conservation. Groundwater 101 and Measure W taught me the difficulty of developing *new* groundwater supplies. San Diego's Pure Water and LA County Sanitation Districts taught me the challenges of water recycling. 

I'm willing to pay a little bit more to stop dewatering faraway places, to honor our treaties with Tribes, for higher quality water, and for more reliable and secure water supplies. We have the technology to do all these things, but financing it is going to be the biggest hurdle. Middle and higher income users will be fine. 

But, I ask you to join me in overturning Proposition 218, which constrains our ability to buffer lower income people from the impact of higher utility bills. We need to figure out a way to spread the costs equitably, which includes overturning Prop 218 and securing State and Federal funds to help low-income users. 

Saturday, August 19, 2023

PFOS/PFOA/PFAS

 I was going to title this post "Why I am not freaking out about PFOS/PFOA" but worried that it would be quoted out of context by people who don't read beyond headlines. The point is I am not worried about my personal exposure to PFOS/PFOA because I did a little research and am reassured that I live in an area where my water is safe. But that is not true for everyone. (PFOS & PFOA are a couple of flourinated compounds in the bigger class of PFAS.)

If you live in California, your water provider has to send you an annual Water Quality Report. It's no longer provided in hard copy with one of your monthly water bills. But the link to the report should be listed in one of your recent bills. For instance, read the California Water Service Rancho Dominguez District Hermosa-Redondo System Water Quality Report 2022

Cal Water is a regulated monopoly that tests for PFOS/PFOA and similar flourinated compounds even though they are not required to. From page 10 of my report for Hermosa & Redondo Beach:

In March 2023, EPA issued a proposed national primary drinking water regulation for certain PFAS. The proposed regulation calls for a maximum containment level for PFOS and PFOA of 4 ppt each. Four additional PFAS—PFNA, PFHxS, PFBS, and GenX— would have a combined hazard index limit of 1.0; the hazard index calculation would determine if the levels of these PFAS as a mixture pose a potential risk. 

Knowing that these were constituents of emerging concern, Cal Water proactively tested active sources in our systems for these PFAS years ago. Although not required, we believed it was the right thing to do. In any areas across the state where detections were above levels at which DDW recommends water suppliers take action (the response level), we took the affected sources out of service until treatment was or can be installed. 

None of our active water sources have levels of these six PFAS compounds over current California response levels.

Then on page 16, I can see that my local groundwater has no detectable PFAS and the imported river water (supplied by Metropolitan Water District) has a range of 0-2 ppt (parts per trillion) of PFAS and an annual average of 1 ppt. While adverse health effects can occur with any amount of PFAS above 0, my exposure is very, very small since I drink a blend of groundwater and Metropolitan water. 


 If you live in Hermosa Beach or North Redondo Beach, your water comes from a few wells near Artesia Blvd like this one behind state senator Ben Allen's field office. 


The water is piped to blending tanks behind the new (and fantastic) bakery, Tommy and Atticus


From there, the water is pushed out in distribution pipes to 90278 and 90254. 

What does it mean to take a water source out of service and treat it? 

It means that water from each well is tested and, if it is too high, they stop using that well and serve you cleaner water from another source (uncontaminated well or imported water purchased from MetropolitanWD). 

CalWater found PFOS/PFOA at a well in Montebello (east of DTLA) and took the well off-line in February 2020, and began construction of a facility to remove the contaminants in December 2020. In January 2022, they held a ribbon cutting for the updated facility and returned the well back to service

The technology is simple and well-known. Read the EPA's explainer, Reducing PFAS in Drinking Water with Treatment Technologies

Well water is passed through a bed of Granular Activated Charcoal (GAC), which adsorbs a whole bunch of stuff I don't want to drink (some dangerous, some merely unpleasantly smelly). A regularly refreshed bed of GAC can remove PFOS/PFOA to below detectable levels (ND = none detected). 

But what do you do when the GAC becomes saturated with contaminants?  In the case of a Brita Filter, I toss the old one in the trash, run the pitcher components through the dishwasher to disinfect them, and install a new filter. 

At the water treatment plant, they use a polymer resin to perform anion exchange to pull the adsorbed chemicals off the charcoal. The resin can be incinerated at a high temperature to destroy the PFAS. The charcoal can be reused for years. The resin is expensive and also relies on having access to a high temperature incinerator (which we have in Long Beach with SERRF.) This treatment process adds about $50/AF (acre-foot) to the cost of water, enough for 5-10 people for a year. For a large water system, this is affordable. 

However, PFAS is a problem around the world, including places that can afford charcoal but not the resin. That's why I found so many papers about how to remove PFAS from charcoal using heat so that they can reuse the charcoal. 

Thermal Stability and Decomposition of Perfluoroalkyl Substances on Spent Granular Activated Carbon

Recent advances on PFAS degradation via thermal and nonthermal methods

Thermal destruction of PFAS during full-scale reactivation of PFAS-laden granular activated carbon

I'm happy that all of these papers are open access (doesn't require $$ purchase) because the authors paid for open access. This kind of knowledge should be available to everyone. 

Anyway, back to the LA Times newspaper articles that freaked so many people out  and lacked context. 

Risk of tap water exposure to toxic PFAS chemicals higher in Southern California cites a USGS study that sampled 700 public and private wells around the country. They modeled the characteristics of the sampled wells and estimated that 45% of US wells are contaminated with at least one PFAS chemical.  SoCal wells are more likely to be contaminated due to urbanization (industrial facilities, domestic wastewater) and past foam retardant use (fighting wildfires and at airports). 

Since there is no requirement to test for PFAS, your water supplier may not test for it. So I may not be panicked about PFAS because I have been reading my annual water quality report, but most people never bother to read it. Many people don't even know who their water supplier is, but that's a whole other story.

If you are among the 10 million people in Los Angeles County, the LA Board of Supervisors recently voted to require all water suppliers to test for PFAS chemicals. This won't change my water, but might change yours. I presume that, if they find PFAS, they will be required to remove it before putting it into the domestic water supply. 

If you live in SoCal, your water supplier buys imported river water through Metropolitan Water District either directly, or from a subregional water wholesaler like West Basin MWD at a cost of $1,400-$1,800/AF. Well water costs about half as much as purchased imported river water, if your water supplier owns permits to pump groundwater. Building a GAC treatment facility at $50/AF is worthwhile because well-water is still a bargain compared to imported river water and we have a convenient and safe way to dispose of the PFAS removed from the water. 

I co-organize a monthly series for the League of Women Voters called WIG, the Water and Infrastructure Group. Upcoming discussion topics/speakers, recordings of past meetings/talks and other educational info can be found on the LWV Beach Cities Natural Resources Page


Hopefully, this will inoculate you against sensationalist newspaper headlines like Brita water filter company accused of false advertising. Have you ever installed a Brita filter wrong so that the water runs right through the gaps on the side of the filter? Do you always change your filter as often as the label on it?  I'm fallible. I'm using the Brita filter just to remove unpleasant odors. I expect it to reduce contaminants, but not to remove them altogether. I am running a home kitchen, not a water treatment facility. But I do expect my water company to supply safe water to my home. 

Read your annual water quality report. There are some smaller water systems that can't afford to fancy water treatment systems and are too remote to hook up to cleaner water supplies. Then there are big water systems like LADWP that politically can't raise water rates so they put off maintenance and upgrades. Look at how bad the LADWP water scores relative to other LA County water systems!  (Data and visualization from the CalEnviroScreen 4.0 Indicator Map of Drinking Water Contaminants.)


If I lived in the City of LA, I would be writing my council members and to the press every week. This is just so embarrassingly bad. (Fortunately, CA drinking water is very clean on a national scale, so you can be in the worst tenth (like LADWP at 90th percentile for CA) and still pass all federal EPA standards. But, for a large water system in an urban area, this kind of water system neglect is just inexcusable. 

Come to WIG on second Thursdays of each month at 7 pm on Zoom. Learn more about water and all sorts of other things that make our area run smoothly. Ask questions and get answers. 

Tuesday, June 06, 2023

We're unprepared for the Silver Tsunami

I was discussing Metro's Traffic Reduction Study for pricing roads (aka Congestion Pricing) to discourage driving. This very unambitious plan is targeting just three areas:
  1. DTLA (cordon area)
  2. I-10 between Santa Monica and DTLA (toll road)
  3. I-405 through the Sepulveda pass, including canyon roads (corridor pricing)
I wrote an analysis from a data-based and science (climate change, pollution) perspective, and encountered a lot of pushback. Everyone in the group is a driver, but I'm the only utility bicycle rider that rides in traffic. Others ride recreationally on the beach bike path or on low-traffic foothills roads. 

The reflexive response was, "What about the low-income (or moderate income) drivers?"

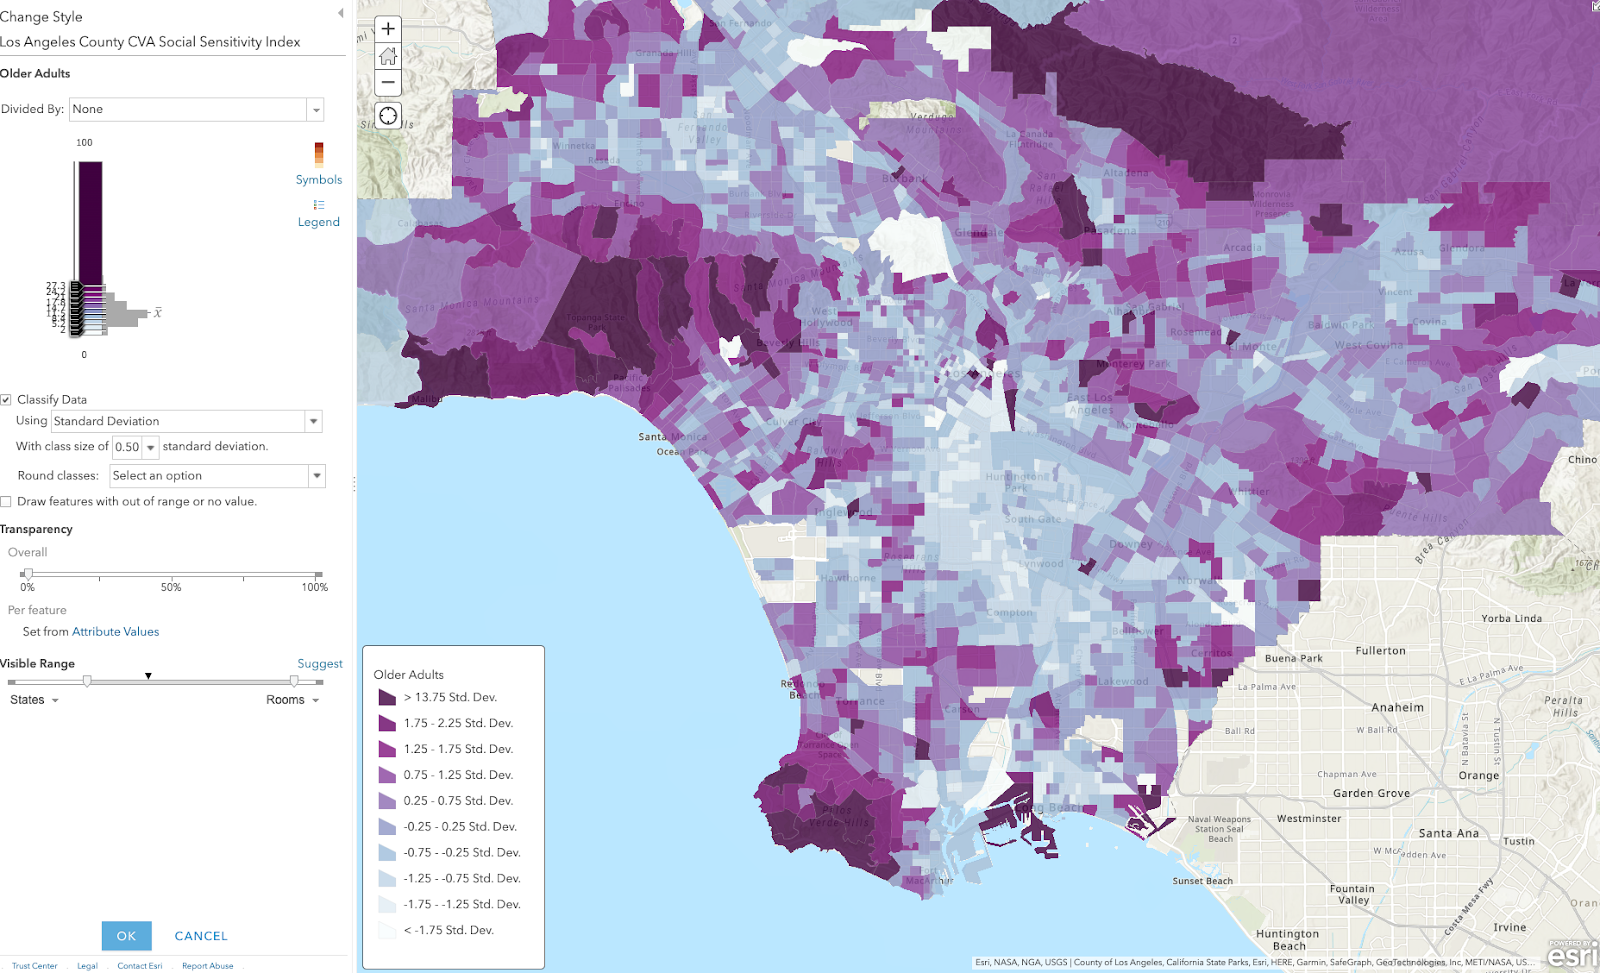
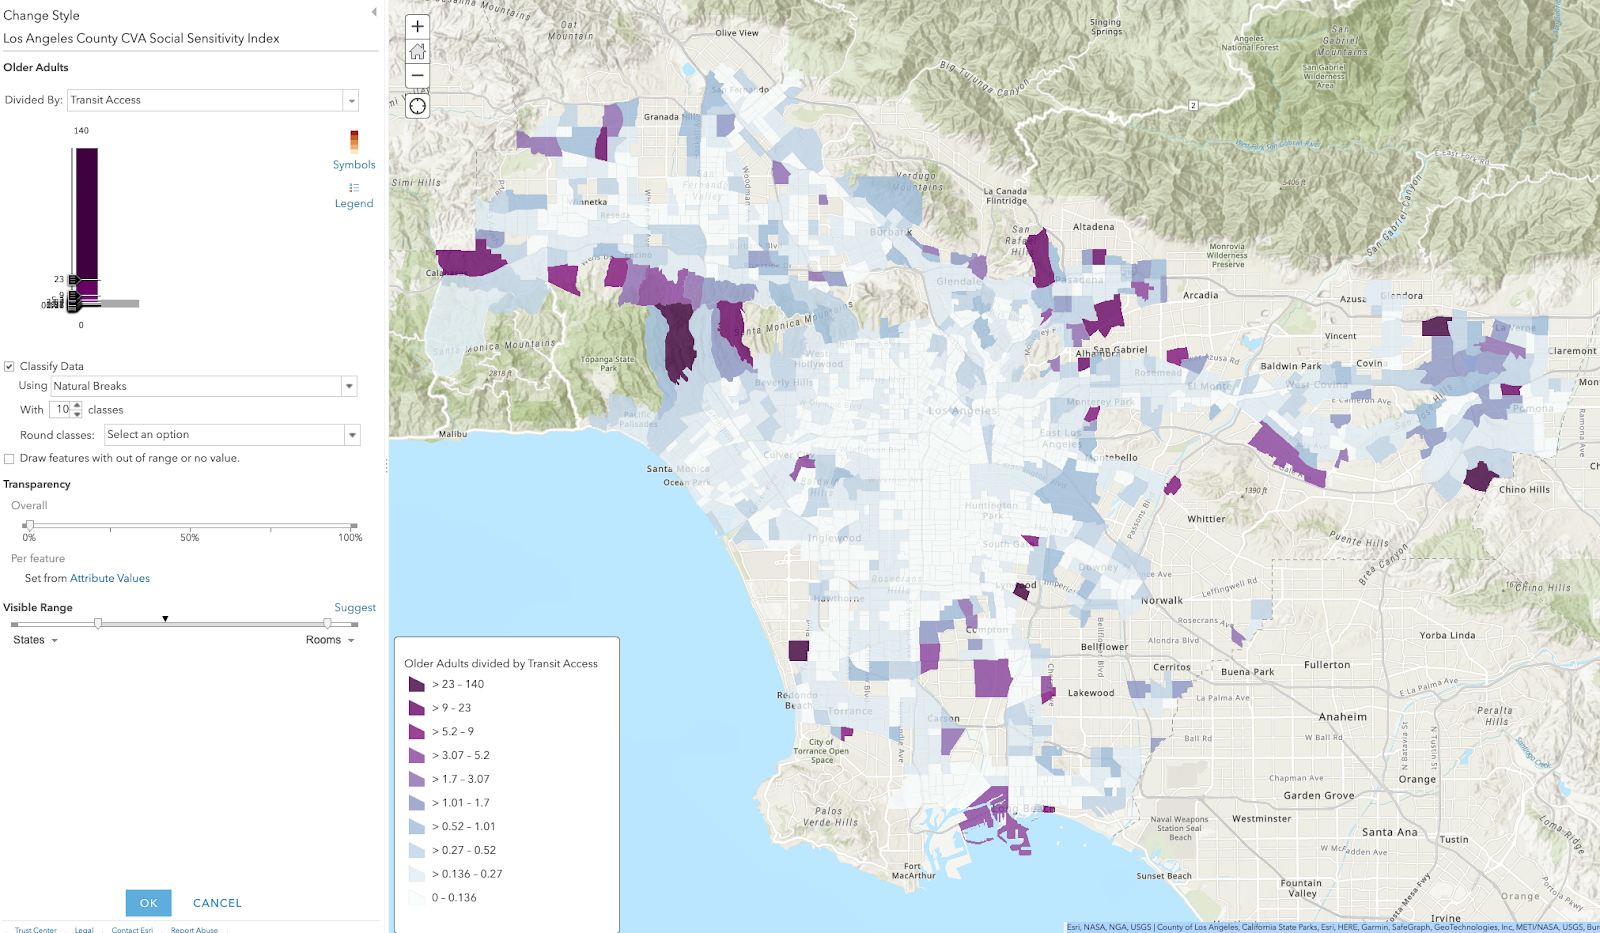
I was making maps using data from Los Angeles County CVA Social Sensitivity Index and was struck by how some areas of LA County are much older than others. That is, the coastal and hill sections have extremely high proportions of seniors.  It's especially dramatic if I map the census tracts by how many standard deviations they are from the mean. 


Darker magenta areas have more people over 65 years old than average. Bluer areas have fewer seniors. 

By implementation time for congestion pricing, today's 65 year olds will be > 73 yo. How long do you think they will be able to drive mountain roads? 

It gets more grim when I divided by transit access. These are high senior population percentage divided by standard deviations from mean transit access (which is already not great in LA County). 


Those are areas where we either need to improve transit and micro-mobility (for electric wheelchairs or sit-down scooters), or we need to move seniors out. Because people like to stay near their community, my preference is to coax them down from the canyons to multi-family housing where they are probably already driving for shopping, services, dining, recreation, or work. 

This leaves some voids in the flatter areas, which can be fixed by street space allocation, improved bus service, and some apartments near bike lanes & bus routes (hello, East Manhattan Beach). 

Anyway, congestion pricing is not going to harm seniors living in the canyons of Bel Air, Malibu, or Brentwood. They will soon age out of driving. It might cost them more to receive senior care in their homes if their caregivers have to pay to drive there. 

On the other hand, if it does improve traffic, then lower income workers will have more time for paid work and less unpaid time sitting in traffic. E.g. they can accept more clients per day because they will spend less time driving. This starts a virtue cycle where they won't have to pad their per visit charge as much, making senior care more affordable. 

You know what would create less traffic? If we let seniors live in congregate settings, where they each have their own small apartments, but caregivers are on site and can simply walk between clients. That would help alleviate traffic, the shortage of elder caregivers, and improve caregiver pay per hour. 

Instead of thinking about changes with fear, look critically at what is not working and how we might improve the status quo. 


Wednesday, May 10, 2023

Guidance for the Metro Active Transportation Corridor: Redondo Beach Blvd Survey from a Local

Urgent Action Alert 

Deadline Extended to May 30, 2023 May 15, 2023 so read on and fill out the survey now 

I need you to fill out a public input survey about a vital active transportation project for Redondo Beach and surrounding cities in the South Bay region of Los Angeles County. This is our chance to reverse some of the damage wrought by past auto-centric road design in North Redondo Beach and allow those who can ride a bike to make school and shopping trips with confidence that they can make it home alive and in one piece. 

There's also a Story Map about the Redondo Beach Blvd Active Transportation Corridor Project with more information. 

Short version if you are in a hurry:

The current street allocation with car parking on both sides and massive SUVs speeding down our streets is not safe or welcoming for cyclists. The proof is in the declining bicycle mode share. 

When filling out the survey, select the options that give a protected bike lane every time. Scroll down past the background info to see my recommendations and why. 

Paint is not protection. Never select an option with a paint-only bike lane in the door zone. If someone opens a door, a cyclist in the door zone will be knocked off their bike and suffer grievous injuries. If they swerve to avoid the door, or are knocked into the traffic lane, they could be killed. No one wants to be killed or have their child killed while riding to school. 

Two-way cycle tracks are a good option, particularly near schools. When kids are arriving or leaving school, there will be a lot of traffic congestion on all modes. But cars are particularly dangerous. The less car traffic they cross while leaving the congested area, the safer they will be. Keep them on the school side of the street, with wide lanes so that there is passing room in the bikeway (keep the kids out of the car traffic lane). 

Plastic poles are not physical protection, but likely the best we can get as a first step.  Plastic poles can be replaced with bollards or concrete barriers later if we allow enough buffer space to install the plastic poles in the first place. Do not let the perfect get in the way of actions we can do right now. 

You can skip the background (but I hope you read it when you have more time).  

Background: The Connection with Schools

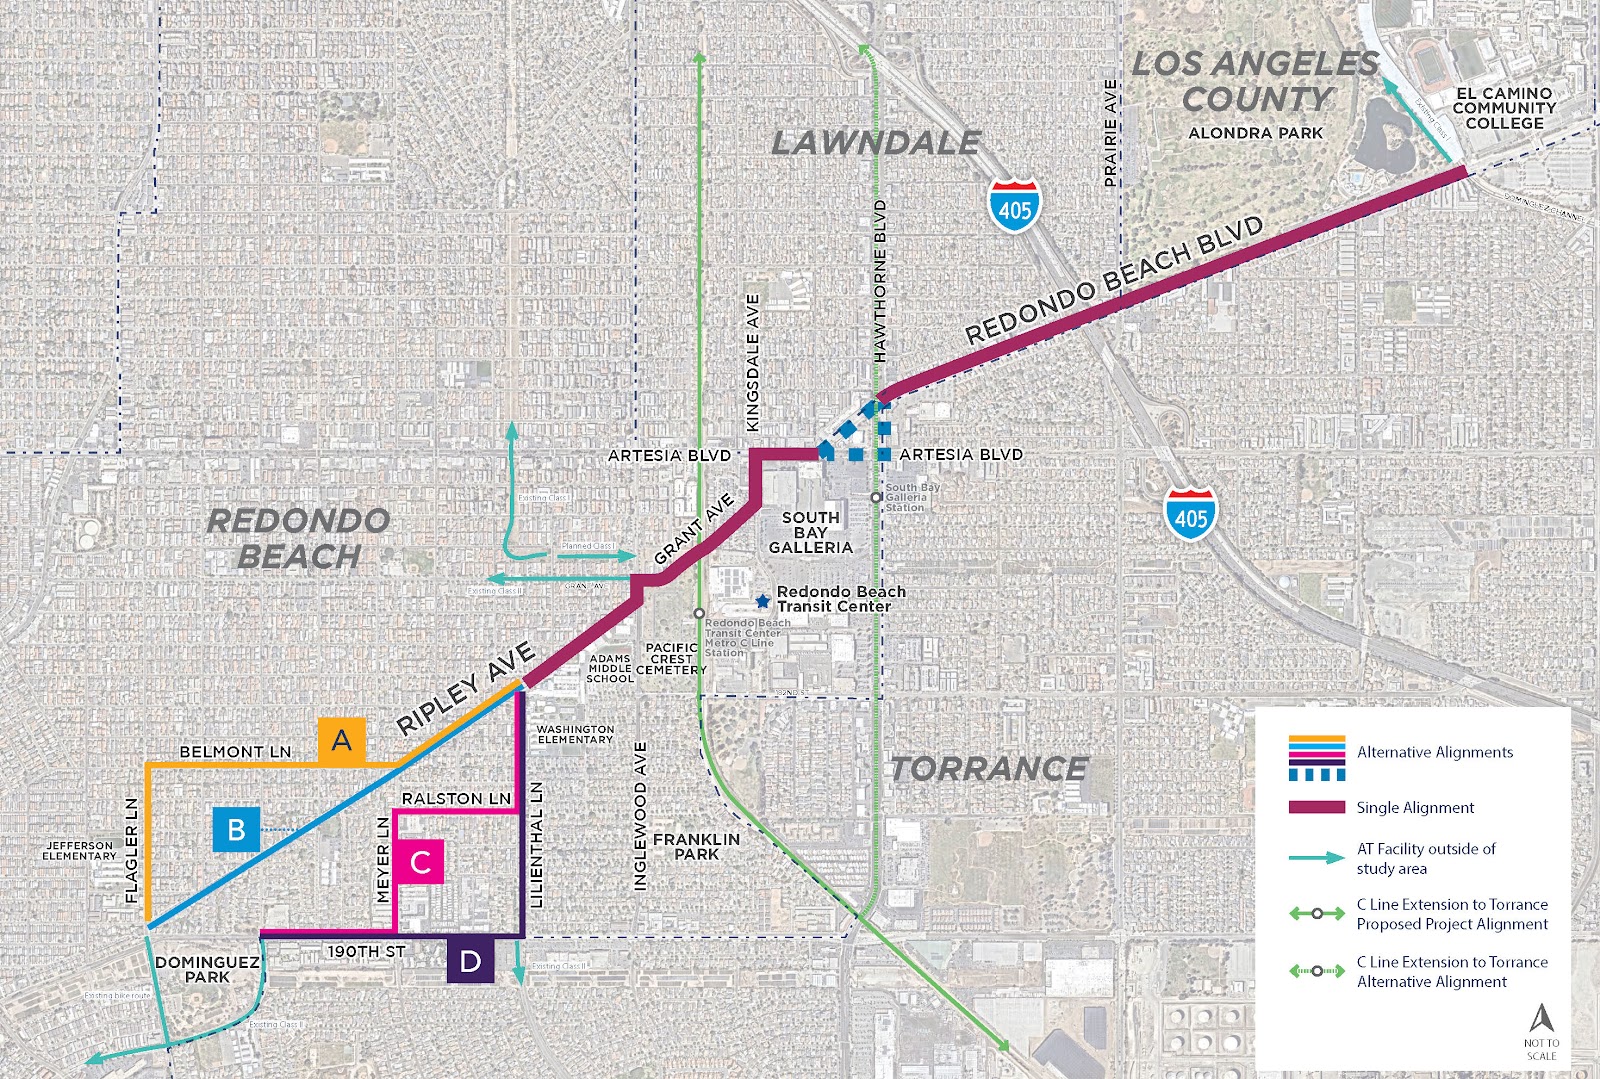
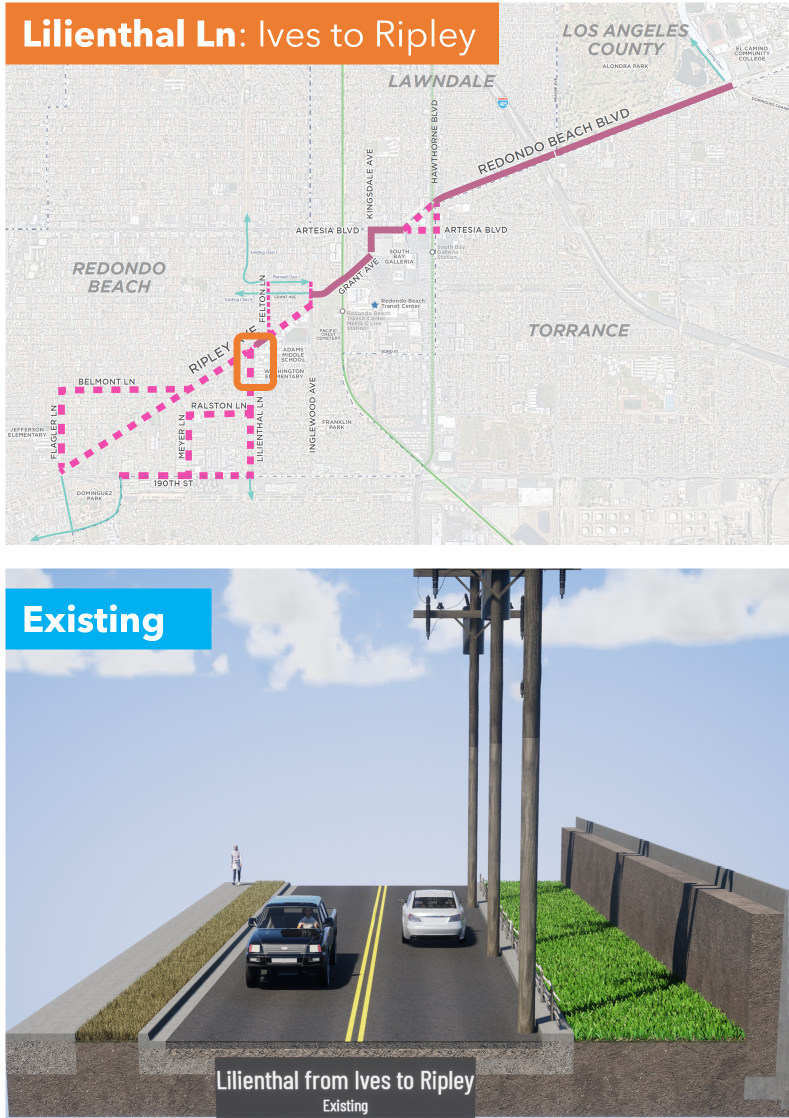
The project area below was originally going to be along the old freight route from Redondo King Harbor to the inland rail routes, but Ripley was found to be too steep (several areas with 15% grades) to be feasible for safe cycling. 


A Redondo Beach traffic study determined that 30% of the city's AM/PM peak traffic is the child school run. This travel corridor includes

  • Adams Middle School: 1066 students: 6-8 grades
  • Washington Elementary School: 801 students, K-5
  • Jefferson Elementary School: 509 students, K-5
That's almost 2400 K-12 students arriving and departing each day on this corridor. 

But that's not all, because all students in Redondo Beach Unified School District (RBUSD) attend Redondo Union High School (RUHS) in South Redondo Beach*. Jefferson ES students also attend Parras Middle School south of RUHS. 

Assuming 350/grade at Adams MS and 90/grade at Jefferson ES, 

350*4 + 90*7 = 2030 students cross 190th Street to attend school and return home each day. 

About half of all RBUSD students traverse this corridor every school day.

But that's not all; El Camino College (ECC, 22,000 students, many from the Beach Cities) is on the eastern end of this travel corridor. Some RUHS and MCHS students do concurrent enrollment and take classes at ECC while they are in HS. Due to many factors, including cost and lack of housing at UC campuses, a large number of students are enrolling in grades 13/14 at ECC before transferring to a 4-year college/university. 

When filling out the survey, think about what you would send your kid to school on. Think about what you would be comfortable riding on as you accompany your younger child to school or run your errands. I ride this area 1-2x/week to run errands in North RB or West Torrance. I want better infrastructure for my safety, too. 

Watch this video of the horrifying existing conditions as ridden by two fit MAMILs (Middle-Aged Men in Lycra). Would you ride these steep hills? Next to fast-moving busy traffic?


Here's another video of the area where Kyle, an area father, rides his kids to preschool. 


My opinionated guide for the survey choices and why they matter: 

Every cross-section shown is facing either Eastbound or Northbound.

Q1: For the westernmost portion of the corridor, which alignment(s) do you prefer? 


I picked D because that would give us a 2-way cycle track on Lilienthal and the longest length of protected bike lanes on 190th. 190th St is also the only way to avoid steep hills. 

The problem with B: The first video shows just how steep Ripley is. Notice that the lead cyclist on a light road bike has trouble getting up the hill (and the trailing cyclist with the camera is on an eBike). Going up a 15-16% grade is difficult, but going down them is downright dangerous. Do not send kids on this route. 

A and C are better, but still steep in some sections. Also, if those are the official routes, there will not be likely any road changes except Sharrows, which are shown to be more dangerous than not doing anything

Only Option D along 190th St will yield any road space allocation for cyclists. 

What is a Sharrow? 

Why are Sharrows so dangerous? 

Q2: The proposed street section for 190th St (Alignments C and D) is shown here. How satisfied are you with this proposal?


I picked Very Dissatisfied: These cross-sections are looking towards the east, with Torrance on the Right Hand Side (RHS) and Redondo Beach on the LHS. Cars are coming down the hill from Flagler and often speeding 50 eastbound mph. People drive with the sun in their eyes during the morning and evening commutes. Do you feel safe with just paint and plastic poles designed to bend when run over by vehicles?

I recognize that people living in the apartments in Torrance on the right need overflow parking, but let's swap the bike lane and parking lane. Install a parking-protected bike lane like this one in Long Beach on the Torrance side with breaks to preserve sight lines at each driveway or street crossing. 


On the RB side, I'd like to see real bollards or a curb. Imagine something like these without the parking lane. Images courtesy of National Association of City Transportation Officials (NACTO)


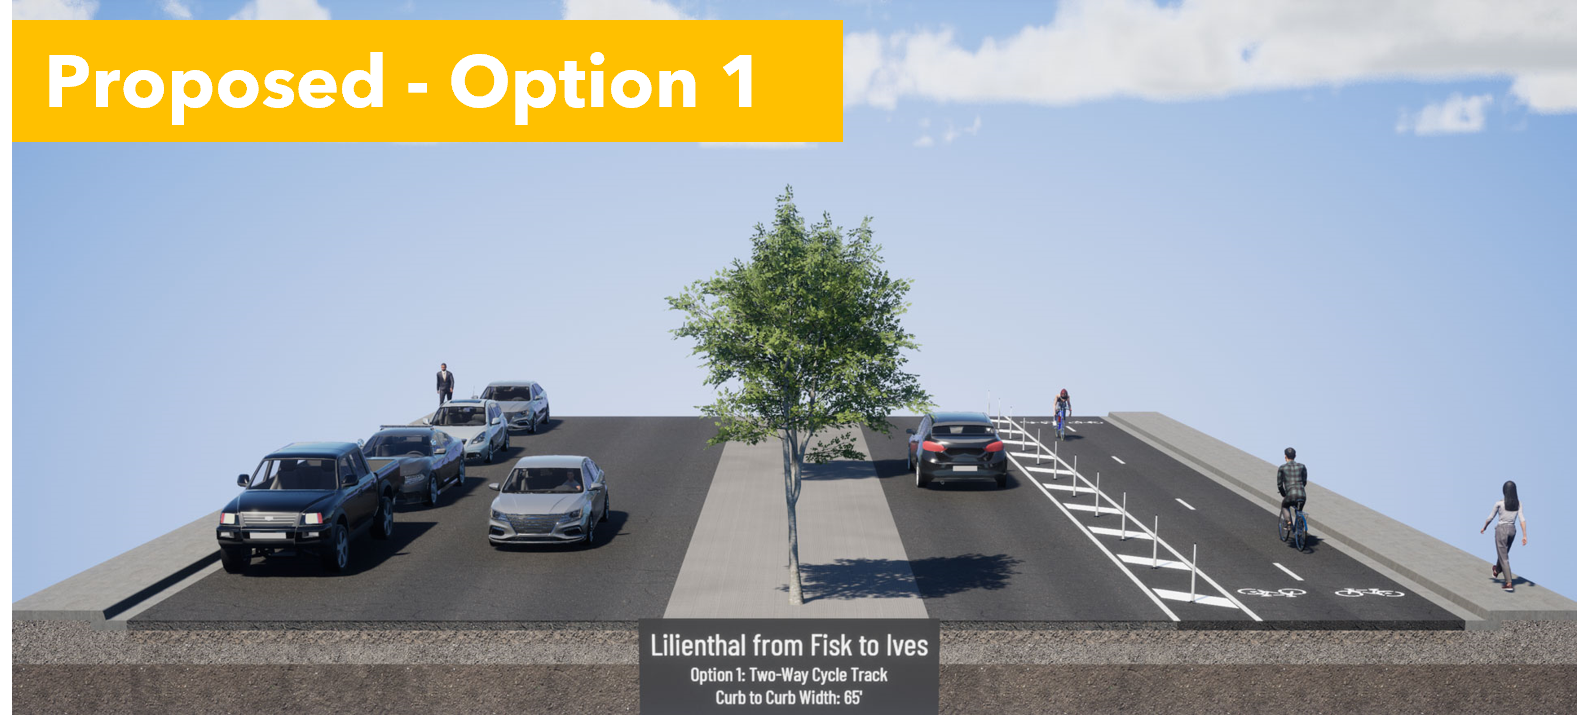
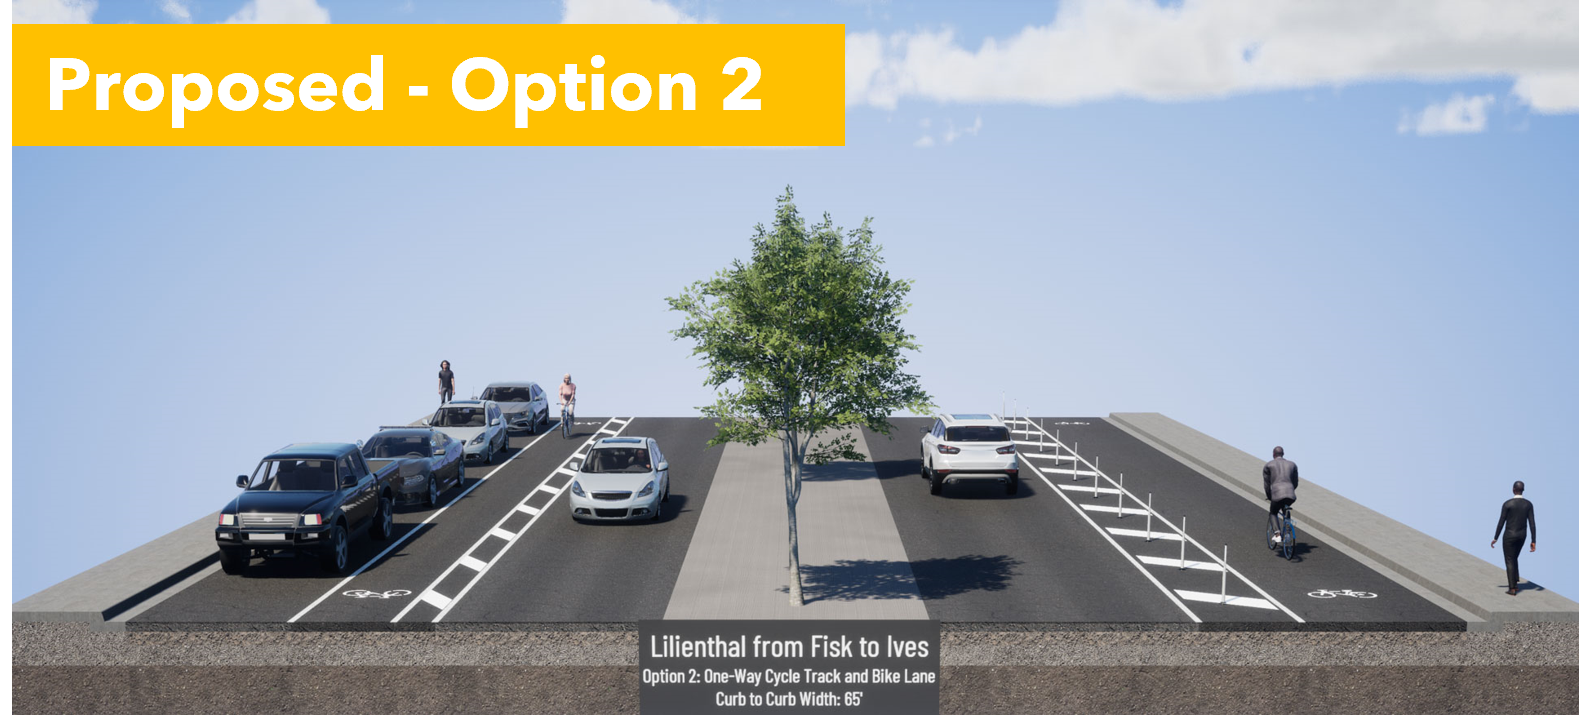
Q3: Select Option 1, the 2-way cycle track on the east side, next to Washington ES. 


Option 1 provides separation from cars, and is wide enough for passing, and allows parents to ride side by side with a child gaining confidence in their bike skills. In 2-way cycle tracks, people riding opposing car traffic are facing approaching cars, so they can see and react to dangerous drivers. It would be better to have solid protection here, but Option 1 gives us room to retrofit with more solid barriers later. 


Option 2 puts kids in the door zone on one side and makes them cross the street to get to school. It's a dangerous situation. 


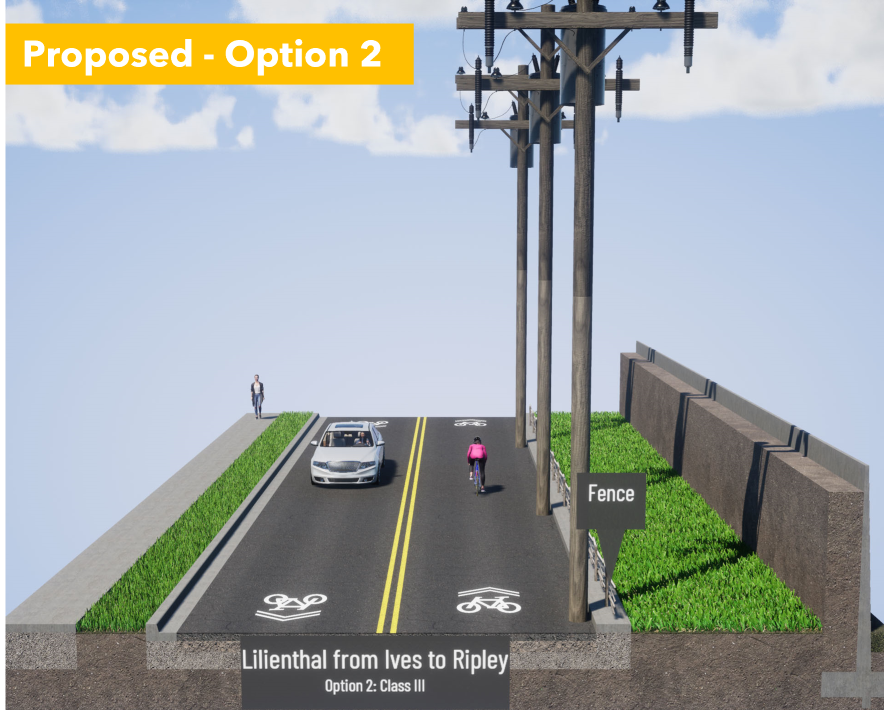
Q4: Select Option 1, the 2-way cycle track on the east side, next to Washington ES.  


Don't be distracted by the stock visualization image with a tall solid wall. There is currently short solid wall on the parking lot side and a wood and rope fence on the road side. 


Option 1 gives a clear place for kids to ride that is physically separated from cars. The 2-way cycle track would replace the wide grassy area.


Option 2 is sharrows in a place where drivers are more focused on making a turn at Ripley than cyclists approaching from behind them. 

Motorists trying to make a right turn will pull over to the right, trapping cyclists behind them. Small children on bikes and tall, boxy hoods on todays trucks and SUVs mean that parents may not be aware of cyclists in front of them. This has led to an epidemic of frontover crashes where drivers run over people in front of them because they can't see them over their hoods. Or, they look at their screens and forget that there are children in front of them. 

Option 2, sharrows, is a safety disaster. 


Q5 on Ripley: Pick Option 1, the 2-way cycle track on the Adams MS side


Option 1 keeps the kids on the school side as long as possible. It also preserves the car unloading curb space that people are currently using. 


Option 2 puts kids in the door zone, at precisely the time that kids being driven to school are unloading. This is a safety disaster. 


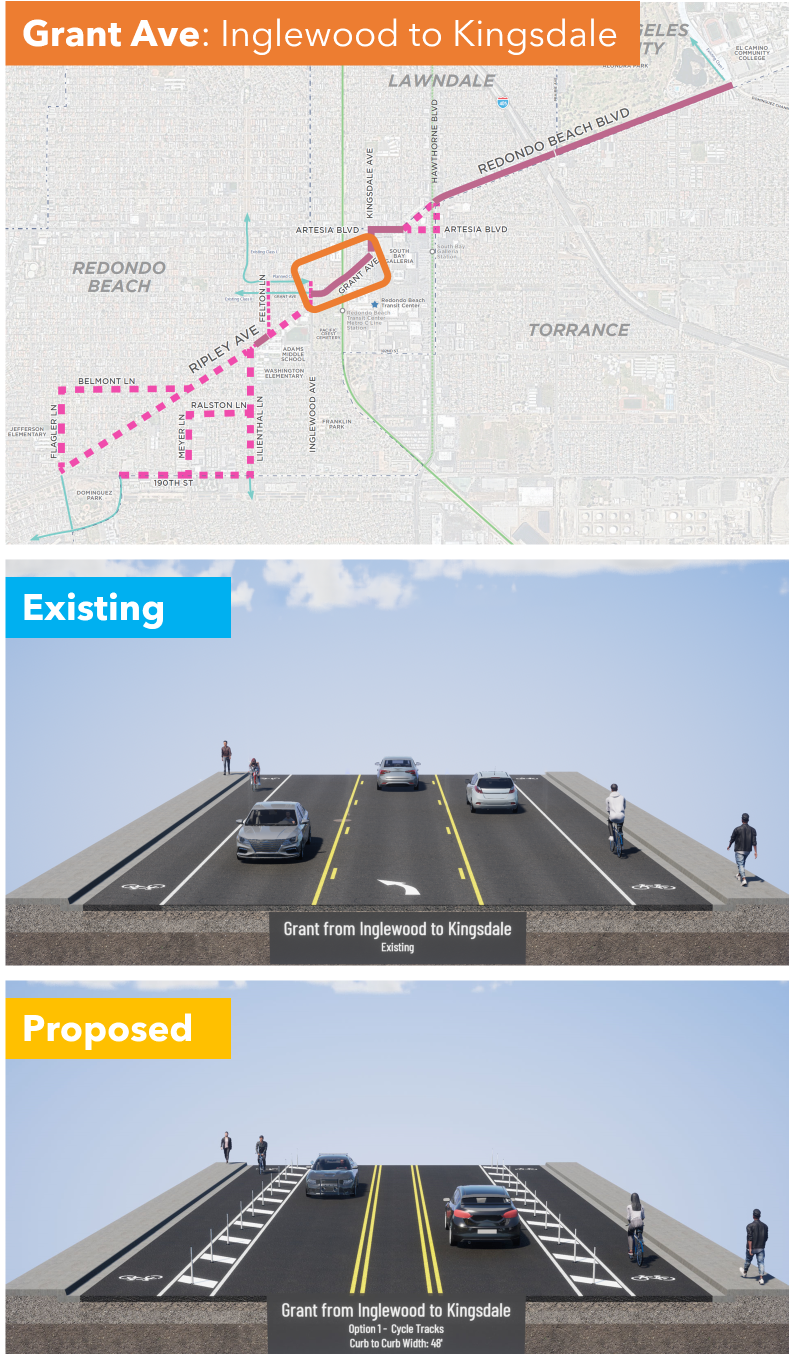
Q6: Grant Ave from Inglewood to Kingsdale; I am very dissatisfied but I selected other and explained why we need solid protection instead of plastic bendy poles


They are proposing paint, a buffered (space separation) and plastic bendy poles. 

This is better than existing conditions, but not safe. Cars pick up speed heading downhill and frequently misjudge the curve, so they end up sideswiping cyclists in the bike lane. We really need a concrete barrier on the downhill (right hand) side. 

I ride by bike to shop at the Galleria and this is the scariest part. I saw a guy almost get killed here. If we want more people to bike through this area, which connects to shopping, the South Bay Transit Center, and the 300 new homes under construction, then we deserve solid protection in this dangerous area. 

I gotta break for lunch but I'm going to hit Publish on this so you can get started. I'll finish after lunch. 

...

I'm back. Stay with me because we are on the home stretch, but the most dangerous one that crosses the 405 Freeway and has the most high-speed traffic. 

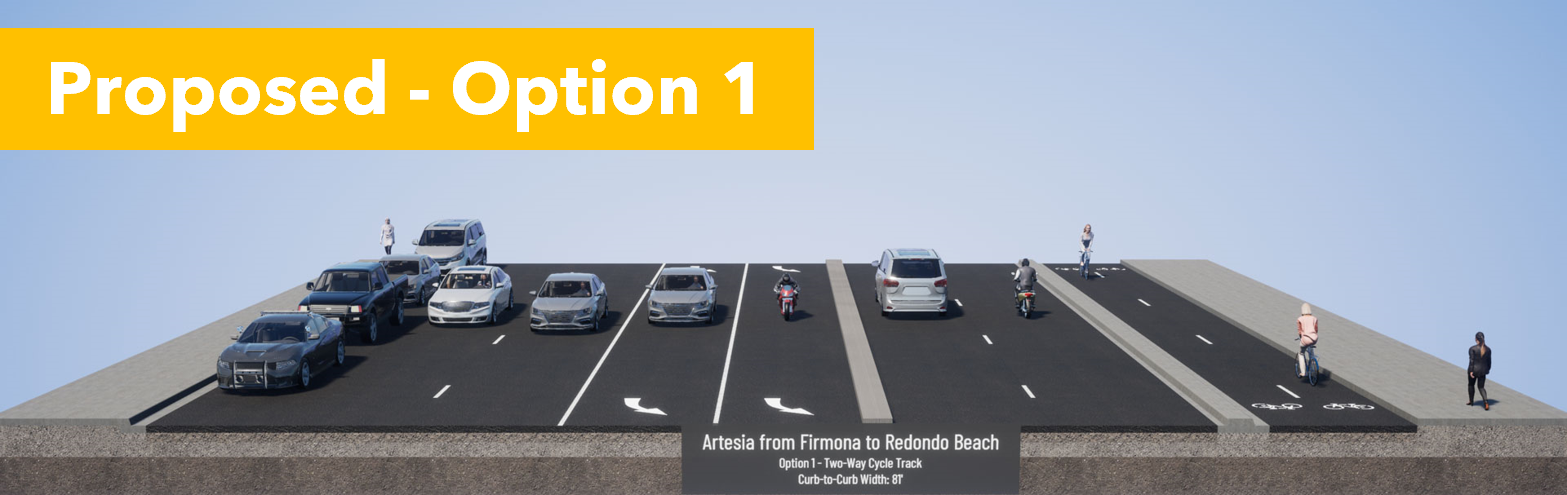
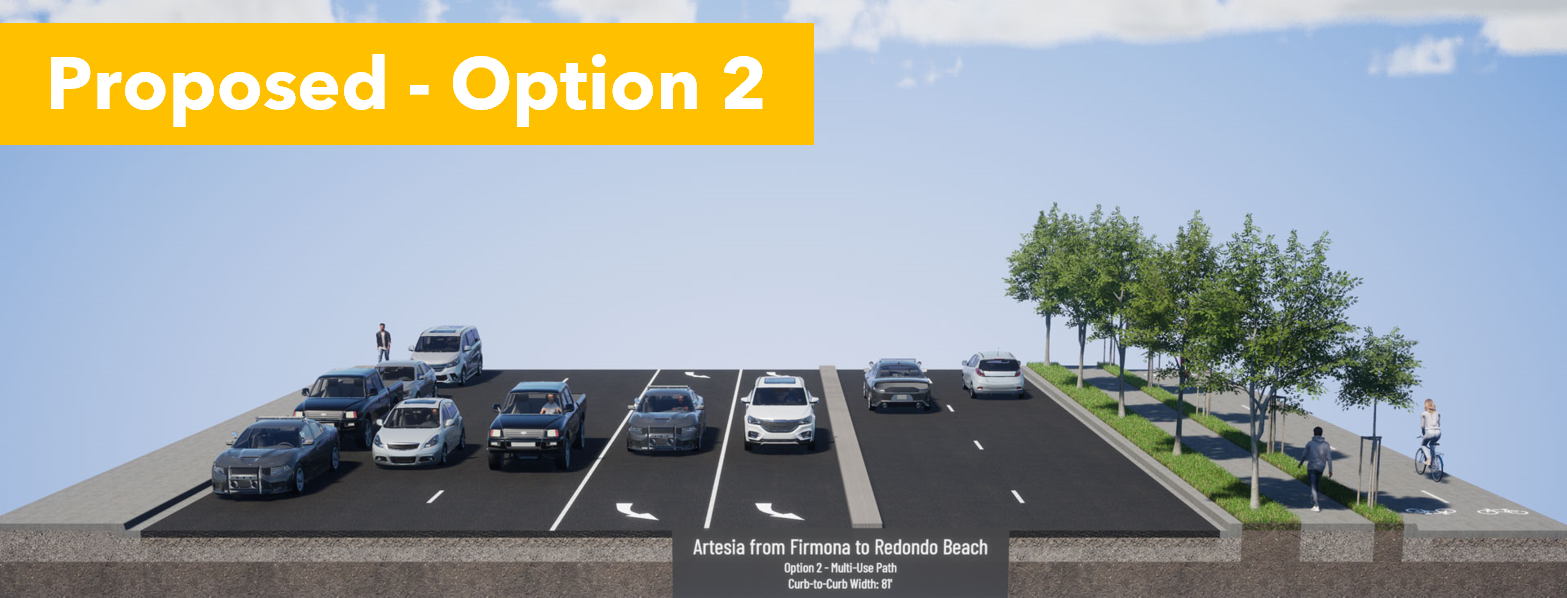
Q7: Artesia Blvd from Kingsdale Ave to Redondo Beach Blvd pick Option 2.  

Existing conditions are awful and you see very few cyclists brave enough to ride here. If they do, they are often on the sidewalk, conflicting with pedestrians. 

Option 1 puts cyclists next to vehicle lanes, but protected with a concrete curb. Pedestrians and cyclists would intuitively understand where they are supposed to be, as faster bike traffic is at the street level. However, this would interfere with bus stops. 


Option 2 puts pedestrians next to the vehicle lanes, but also next to the bus stop. Trees would provide shade. There could be some confusion with pedestrians wandering on the bike path, but that can be solved with good signage.


Our community has experience with pedestrian and bikeways next to each other in the North Redondo Beach Bikeway (NRBB). While there is some spillover, people have already learned where pedestrians and rollers have priority on the NRBB. Option 2 will work best for us and we already know how to use it. 

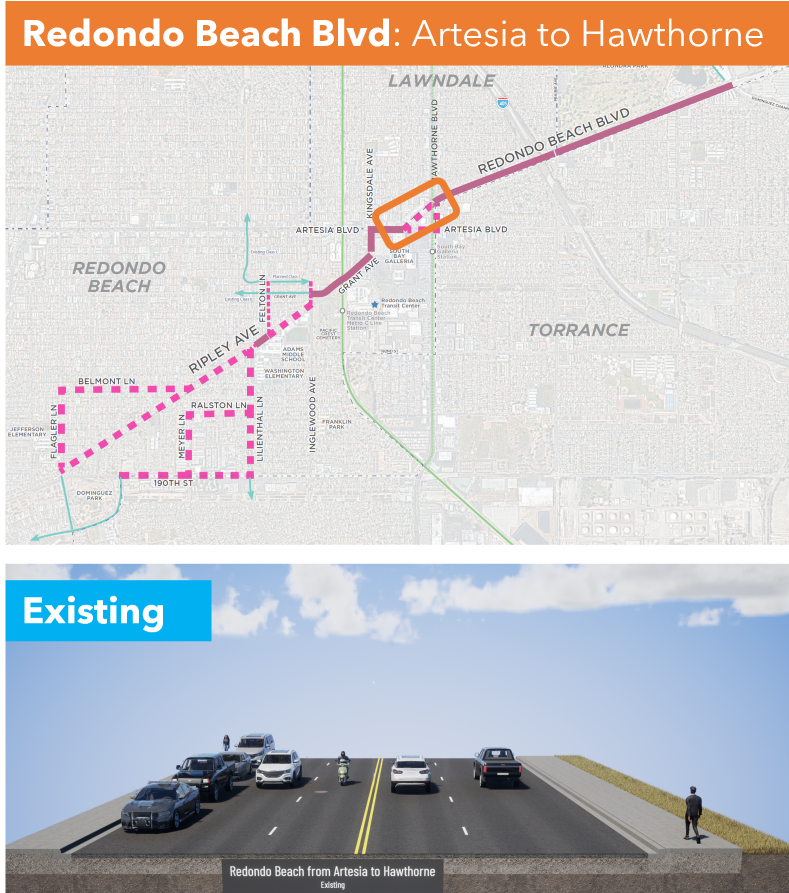
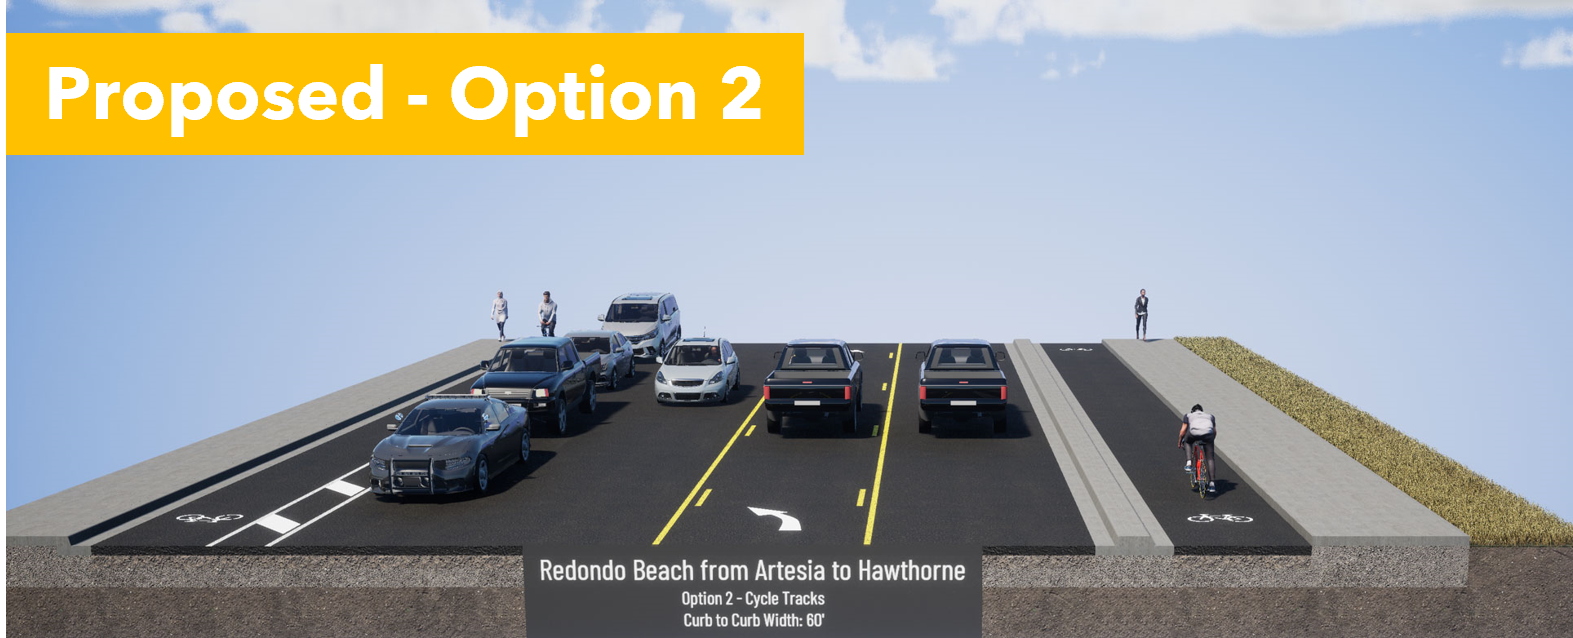
Q8: Redondo Beach Blvd from Artesia Blvd to Hawthorne Blvd. Is a tossup but both Options are so much better than the status quo.


Option 1 pits cyclists against pedestrians, but provides 2-way access to Walgreens and Starbucks. It's not terrible as long as cyclists slow down when passing pedestrians and motorists exiting the parking lots look both ways. 


Option 2 provides a clear separation between motorists, cyclists and pedestrians. Cyclists are curb-protected on the eastbound RB side, and parking-protected on the westbound Lawndale side. However, coming westbound from Walgreens/Starbucks, people will likely bike on the sidewalk until they meet the 2-way cycle track. 


Although you lose a traffic lane, it's not the cyclists' fault. One can just as easily blame the space allocated to free car storage (on-street parking) and a turn lane. Motorists are losing a travel lane to other motorists, not cyclists. Don't forget that. 

Option 1, the 2-way cycle track, provides a better alternative not suggested by Metro for the next section. 

Q9: Redondo Beach Blvd from Hawthorne Blvd to Prairie Ave. I am Very Dissatisfied & propose a better solution. 


Although the status quo is very bad, we shouldn't rush into the proposed door zone bike lane next to high-speed traffic heading to the freeway onramps. It is extremely dangerous. This will greatly reduce the number of people brave enough to ride to Alondra Park and El Camino College. 

If there is enough room for on-street parking, then there is enough room for a parking-protected bike lane. That may require narrowing the car lanes a bit, but that would also inhibit speeding, making that stretch safer and quieter for all road users. 

The freeway onramp is on the north side of RB Blvd. A 2-way cycle track on the south side of RB Blvd would keep cyclists away from the crazy line of cars trying to merge onto the 405 on-ramp. Suggest that in Q11. 

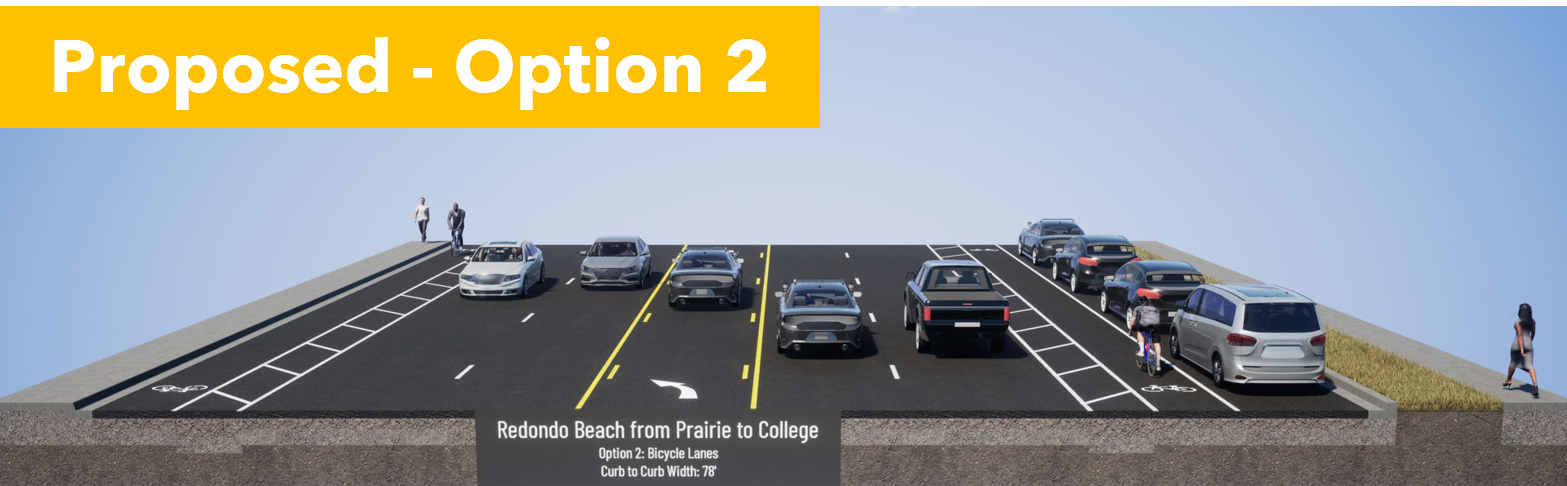
Q10: Redondo Beach Blvd from Prairie Ave to Dominguez Channel. Pick Option 1, the 2-way cycle track on the North side, next to the park and El Camino College. 


Option 1 puts cyclists next to the park and ECC. Although it is shown with plastic bendy straws, it can easily be fitted with bollards or a concrete curb for better protection when cycling to and from evening classes at ECC. 


Option 2 puts cyclists in the door zone, where they can be knocked into fast-moving traffic and killed. Drunk or malicious drivers can also harm cyclists easily with only "paint as protection". 


Q11: Additional Comments: This is where we ask for a protected 2-way cycle track on on the south side of RB Blvd between Hawthorne and Prairie. 

What do you need to be comfortable bicycling this corridor? Tell them!

Keep in mind that younger Beach Cities kids will probably only ride the western side of this corridor, west of Inglewood or Kingsdale. But older teens and young adults may need to ride to ECC or to retail jobs between Kingsdale and Crenshaw. 

There are a lot of children and seniors in Lawndale and Torrance who would benefit from these bike facilities, whether they are riding a bike, trike or mobility scooter. 

We should make this corridor welcoming for ages 8-80. 

Think about who needs to travel through this corridor and at what times. What kind of cycling facilities do they need to get there comfortably and safely?  What about seniors in mobility scooters or electric wheelchairs? Would you like to see food delivery robots in the bike lane or more food delivery by privately-owned cars?

With better bike facilities, I may choose to bike to stores further east than I currently feel safe. Every trip I make by eBike instead of car, I am "sparing the air", not taking up road space in front of you, and not competing with you for parking. 

Another thing that excites me about this project is that it connects us to the Dominguez Channel. In a separate project, LA County Public Works will be extending the bike path along the channel southwards. It currently goes north to 120th St, past Amazon, Space-X, Lowe's and to the Metro Green/C Line. A southbound channel bike path would connect to the Harbor Gateway Transit Center, with very fast connections to the Silver/J Line to USC/Expo Park (15 min) and Downtown LA (20 min). Harbor Gateway TS is already linked up to CSU Dominguez Hills. This is a large step forward for a transportation transformation for the South Bay. 

Bike lanes benefit you even if you don't ride a bike, but your neighbors do. 

Bike lanes will save you time currently spent chauffeuring your kids short distances. 

Bike lanes will benefit your kids because students who get exercise before school do better. 

Bike lanes will benefit you when you age out of driving. 

Bike lanes may allow your family to shed one car, saving you over a million dollars per lifetime

Finally, I want to close with this terrific video of a #BikeBus led by Coach Sam Balto in Portland. 

https://twitter.com/CoachBalto/status/1656353963489501190?s=20

This bike corridor will touch the lives of half the students in RBUSD and can be transformative for the way our community gets around. If half of our households can shed just one car, we would be richer, our street parking and traffic congestion problems will evaporate, our air and water will be cleaner, and we will have done our part to slow climate change. Oh, we'll be fitter and happier, too. 

* A very few students living in North RB attend Mira Costa HS in Manhattan Beach, but only if MBUSD will take them.