Showing posts with label Weather. Show all posts

Thursday, June 19, 2025

Dark Roof Lobby

I just can't make up as self-serving as the Dark Roof Lobby.  We live in the post-truth society so they are even successful despite having no science to back up their assertions. 

[I learned about this issue, and about Floodlight News from the non-billionaire-controlled social media site, Bluesky. You can find me there under the handle, gspeng.]

Remember in 2012 when we replaced our dark asphalt composite roof with a Cool Roof? It cost no more than the dark color, and was also made of composite materials. Only, the cool roof contained light-colored bits of recycled and tumbled glass instead of dark asphalt bits. Instead of absorbing 70% of incident heat, it reflected 70%. 


It's not a big change in appearance, costs no more, was just as easy and quick to install, and lasts just as long. (Actually, glass is one of the more stable materials and it might last longer than asphalt composite shingles.) Installing a cool roof will make a big difference in your comfort on a warming planet, and on your pocketbook in cooling costs.  How often do you get something that is all upside?

That's a private benefit. The real gains are when it's multiplied at the city level. In Cool Roof 2: Cool Roof, Cool City, I explained mass deployment of cool roofs are the most effective and cheap method of reducing the Urban Heat Island Effect. We're talking dozens of studies using mesoscale modeling including radiative forcing calculations (instead of cheaper parameterizations), in a variety of climates. 

In different climates, Cool Roofs always comes out the top or second most impactful intervention for combatting the Urban Heat Island Effect. They are also the cheapest. Unlike trees, they don't require you to find water in the desert to perpetually water them. 

It's a sign of the times that I am not sure of the veracity of a epa.gov website and if it will be messed with later. As of June 19, 2025, these are factually correct. 

Who could possibly be against replacing a dark roof at the end of it's natural lifespan with a cool roof? 

Enter the Dark Roof Lobby, under the guise of an astroturf group calling themselves Coalition for Sustainable Roofing. 

The Coalition for Sustainable Roofing (COSUR) represents companies who manufacture cool roofs, dark roofs, gray roofs, white roofs, and everything inbetween. Carlisle Construction Materials, Holcim Building Envelope, and Johns Manville are long-standing North American-based manufacturers of a variety of building products. Because they manufacture a wide range of roofing products instead of specializing in just one membrane type, these companies have a unique vantage point from which to offer insights on holistic roof system design and sustainable roof assemblies. COSUR works closely with roofing architects, roof consultants, and roofing contractors to emphasize holistic approaches to roofing solutions, promoting resilience, energy efficiency, and urban heat island mitigation.

What is "holistic roofing?" How is lobbying against Cool Roofs promoting resilience and energy efficiency? Just say it out loud. You don't want to change and you want to milk your old factories for as long as you can without learning how to make different things.  

COSUR has exactly one employee, an operative government relations and equity-focused leadership professional. I am not going to link to her page, but here are screen shots from her LinkedIn. 

It would be comical, except that they were successful in preventing Denver from adopting a cool roof requirement and rolling back Tennessee's requirement. COSUR also stopped  adoption of cool roof requirements in national energy efficiency codes. 

Their lobbying uses talking points that are just blatantly untrue lies. Cool roofs do not wear out any faster, or cause mold problems. They cherry-picked one study from Harvard and ignored dozens of studies from around the world showing that cool roofs are very effective at combatting the urban heat island effect. 

Whether your home lacks air conditioning or if you are among the 27% of US families that struggle to pay their energy bills, a cool roof could be literally the difference between life and death in a heat wave.  

From the Floodlight Article:

But the weight of the scientific evidence is clear: On hot days, light-colored roofs can stay more than 50 degrees cooler than dark ones, helping cut energy use, curb greenhouse gas emissions and reduce heat-related illnesses and deaths. One recent study found that reflective roofs could have saved the lives of more than 240 people who died in London’s 2018 heatwave.

Energy insecurity is borne by renters, though landlords select the roofing material. This is why cool roof mandates matter. Over time, everyone will have access to this life-saving, and money-saving, measure. But we have to stop replacing dark roofs with dark roofs. 

Large roof manufacturers can afford to retool to make cool roofs. They just don't want to. People will die. 

Saturday, September 07, 2024

Cool Roof 2: Cool Roof, Cool City

 Los Angeles is in the middle of a record-setting (again!) heat wave. NWS reposts that LAX airport, along the coast, recorded a high of 102 F (old record of 99 F in 2020) while Downtown LA hit 112 F. 

Several people asked about our Cool Roof and Heat Pump. I wrote about replacing our asphalt shingle roof with a composite shingle "Cool Roof" back in 2012. Our roof went from reflecting 30% of solar heat (absorbing 70% of the heat) to reflecting over 70% and absorbing less than 30%. If you look closely at the shingles, they incorporate bits of recycled glass, tumbled to a frosted gray, green or blue. From a distance, it looks like a light-medium gray. You wouldn't even know it was a cool roof unless I brag about it. 

When you install a cool roof, you mitigate the Urban Heat Island (UHI) impact of urbanization. "Georgescu et al. (2012, 2013) reported that summertime statewide warming due to projected urban expansion for Arizona could be reduced by about 50% with the complete integration of highly reflective cool roofs." SoCal would likely be similar. 

So, which should you pick, a cool roof, a green roof, or a photovoltaic (PV) solar roof? The answer turns out to be dependent on local climate and geography. Materials change the radiative impact of buildings. They can reduce the amount of heating during the day, but they can also disrupt the amount of cooling at night. They can heat the air above the city, strengthening the urban heat dome. There are so many variables, it takes a radiative full-physics model and a supercomputer to track them all. 

Take the case of Phoenix and Tucson, studied by Salamanca et al: Citywide Impacts of Cool Roof and Rooftop Solar Photovoltaic Deployment on Near-Surface Air Temperature and Cooling Energy Demand. "In Arizona, cool roofs reduced daily citywide cooling energy demand by 13–14%, while rooftop solar photovoltaic panels reduced them by 8–11% (without considering the additional savings derived from their electricity production)."

But, if you were in London, Brousse et all found that cool roofs would be most effective in reducing extreme heat. Nonintuitively, green roofs wouldn't make much difference overall (but help during the day). Vegetation makes a minimal difference on a city-wide scale. Rooftop solar might have an overall heating effect, as would running AC. But, if the rooftop solar energy was used to run AC, and people could take shelter from the heat indoors, they could be a net benefit. 


Governments can encourage behaviors good for society and suppress behaviors that are detrimental with subsidies/fines. If you were running the government, you would like to find out the cost-effectiveness of different interventions (eg subsidies) and fund what gives you the most bang for the buck. If you had even more money, then fund the slightly less effective but still helpful stuff. 

COOL ROOFS reduce heat experienced inside the buildings and in the urban environment. Require them in new construction. Replace dark roofing materials with cool roofs first. If you have money left over install rooftop solar. 

In 2012, I got a 10% tax credit on the cool shingles we used, but that is only a small amount compared to total cost of installation.  The shingles cost the same as the darker colors in the same product line that absorbed more heat and didn't qualify for the tax credit. I didn't need a nudge of a few hundred bucks to do what I knew would make my house cooler. 

Adding rooftop solar was not on my radar back in 2012 because I figured that the prices were still high and technology was still changing. A few people in our neighborhood installed them, but they were much bigger energy consumers than we are. We hadn't installed a heat pump yet. 

BTW, Lawrence Berkeley Laboratory puts out an annual pricing survey called Tracking the Sun, with useful data on actual installed prices of solar systems. 


DIGRESSION:

When we got our heat pump back in 2020 (or maybe 2019?), people asked why we didn't get solar panels as well. I dragged my feet because the rooftop solar salesmen (and they are always bros) were so sleazy, and I also didn't want to buy anything made with forced labor. I was waiting for the solar supply chain to clean up. I am also waiting until I replace my roof again. The timing just wasn't right. 

Besides, I know that California has an excess of solar power during the day. It used to be worse, but utility-scale batteries have been soaking up the excess solar power so that we need to shut down feed in (curtail) solar farms less than in prior years. For the last month, we have been curtailing solar farms during all the hours rooftop solar would have produced at my location. 


Even during the heat wave this week, we had to curtail cheap solar farm power. 


Yes, even during the hottest day ever (so far) in LA. 


There just wasn't much value-add for society if I add solar panels to our cool roof. 


Wednesday, August 30, 2023

When too much water leads to water scarcity

 Like clockwork, every time we have a big rainstorm, I read news stories and hear people talk about all the "wasted" water running out to sea or out of the arid area. I understand the frustration, but want to highlight some of the complexities. 

For instance, Southern California received quite a bit of rainfall ~10 days ago as the remnants of Hurricane Hilary swept through. We received 2.5" according to my backyard rain gauge. I'll write more about that in a later post (already started drafting it). 

But, I thought it would be interesting to show what happened near Palm Springs, where Interstate 10 was washed out after the area received half of their annual average rainfall in 6 hours. Interstate 10 was shut down for miles due to flooding and mud

One of the surprising things to water neophytes is that less water is captured in torrential rainfall events than in more normal, smaller and slower rain events. 

This is why water professionals are so worried about climate change. Climate models forecast, and our recent experience verifies, that SoCal will get about the same average annual rainfall as in the past--but it will come in fewer and burstier storms like we experienced in August and January/February 2023. 

In arid climates, it makes more sense to store the water underground to minimize evaporative losses. Palm Springs exists due to a large aquifer and faults that allow the groundwater to seep to the surface. After unsustainable groundwater pumping, the Coachella Valley developed percolation ponds to spread imported river water to refill the aquifers. In this way, the aquifer has stabilized. 


This land works remarkably hard precisely because of it's geology. It has the surface to aquifer connection that allows it to function as a percolation pond. But it's also a transportation corridor because it has the surface water needed by overland travelers. 

Can you see the percolation ponds, wind turbines, solar farm, Interstate 10, and the railroad tracks in this aerial photo? That's five uses, not counting housing and related services. 


You can also see wind turbines in this photo from another percolation pond just to the south of this one. 


The transportation corridor is here because of water, but it's also at risk because of water. You can see the Site of the Original Palm Springs RR Depot in this aerial photo, along with Whitewater Canyon, which feeds the Whitewater River that eventually drains into the Salton Sea. 


It's more dramatic in the terrain contour map. 


The people are here because the water is here. 
The water is here because the mountains are here to squeeze the water out of the sky. 
The mountains are here because the faults are here. 
The water reaches the surface because the faults are here. 

It's all interconnected, but I'm digressing again. 

This is about why we couldn't capture most of the water from bursty rainstorms into the aquifer. 

Turbidity and Water

You know how lake beds have very fine soil impermeable (or only slightly permeable) to water? This allows them to hold the water. Watch Who Fills Your Taps as Kathy Kunysz explains how, when water comes pouring off the mountains, the larger gravel falls out first, and then the finer silt settles into clay layers (aquitards). If you don't keep the finer particles out of your spreading basin/percolation pond, they clog up and cease to function. 


If you don't have time to watch this 75 minute video, you can view the slides


In order to preserve the percolation pond, they had to redirect the muddy runoff AWAY from them, so they didn't capture most of the runoff. This happened in January 2023 and again in August 2023. 

If the rain comes too fast, and the water contains too many fine particles, then you can't capture it in percolation ponds. More and more of our rainfall is going to come from these bursty storms. 

The good news is that they water was diverted around the percolation ponds and sent downstream to feed the shrinking Salton Sea. If we preserve and restore coastal wetlands, that silty water can replenish the marshes, build up the coastline, and help protect us from sea level rise and storm surges. The bursty flows can scour out the waterways, remodeling/refreshing wildlife habitat. 

It's all good. 

Waste is in the eye of the beholder. If you look at it in terms of what's valuable to humans, you aren't seeing the whole picture. 

But, it also means we have to work harder and and spend more money to capture the same amount or less water, due to climate change. The people who told you that we couldn't do anything to stave off climate change because it was too expensive played the American public for chumps and we fell for it. 

Wednesday, October 13, 2021

Rooftop Solar Inequity or Net Metering Goes Grrr

Brian Bartholomew tweeted this out around 3 pm on a sunny autumn afternoon (October 13, 2021) along with the message, "CAISO right now"

I ran over to CAISO's real-time prices page and saw this:


If you were buying or selling electricity then, you would have paid $0.41 per megaWatt hour, or $0.041 per kWh.  

Under Net Metering, owners of rooftop solar panels who are producing more than can use can put it on the grid and be credited against their electricity use from the grid for anytime between 7AM and 5 PM.  The problem is that electricity prices fluctuate quite a bit. Here's another graph from @BPBartholomew


Say your panels are on the west-facing side of your roof and don't generate any electricity in the early morning hours you are getting ready for work/school.  You use your credited kWh banked during midday and don't have to pay for the energy.  Say you (or your kids) come home after school and turn on the air conditioning; you can crank away between 4:00 and 5:00 PM against your credits. 

A Southern California Edison (SCE) customer under the Time of Use (TOU) Prime plan, users without credits would pay 48 cents (Jun-Sep) or 45 cents (Oct-May) for that electricity.


Sometimes, net electricity costs can be negative.  You can be paid to take electricity and move it out of a congested grid. Do you have a big bank of batteries near Los Banos?  If so, you can be paid to charge your batteries tomorrow and then sell them during the evening duck curve.  It's called Energy Arbitrage. 


Meanwhile, in Los Angeles, the owners of rooftop solar panels selling electricity to SCE (which is forced by the CPUC (California Public Utilities Commission) to take it (even if they don't want/need it), can feed electricity into the grid worth 41 cents/megaWatt-hour or 0.041 cents/kWh, get credit for it, and use that 1 for 1 to offset electricity use in the evening, when it's worth 1000x that.


There is no point in me belaboring this; just read Severin Borenstein's Rooftop Solar Inequity.

I wrote a Net Metering Fact Sheet after reading lots of books, reports and government documents about how electricity is generated, moved around, regulated, purchased and used. I'm sure it will get angry comments from the people who are benefiting the most from California's current Net Metering policies. It's important to know that academics, government scientists and CPUC agree that overall, people with rooftop solar are benefitting at the expense of those without.

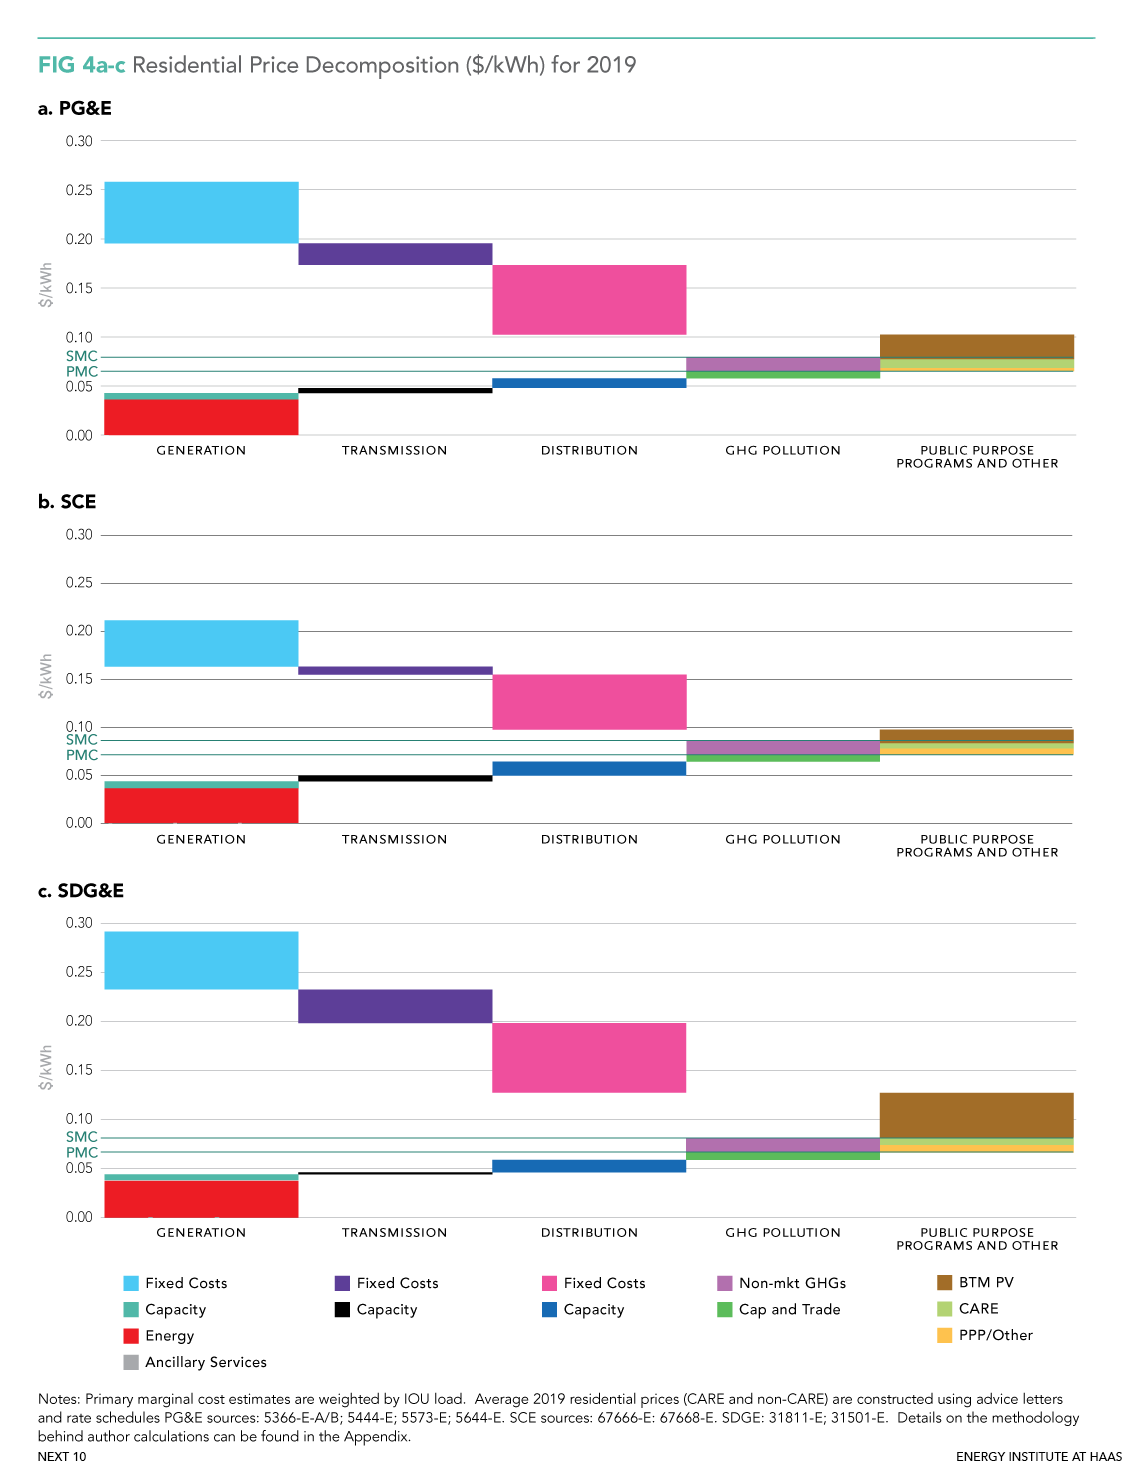
This "Energy Waterfall" plot showing the different 2019 costs for the three largest electricity providers in California from Ensuring Equity in California’s Energy Transition was very convincing. Look at the right-most column of Public Purpose Programs.  The thin green slice is aid for low-income customers under the CARE program. The fat brown slice is payment to PV owners (solar rooftop) under the current net metering scheme. 
 

Here's the detail of CARE and PV subsidies. We spend more subsidizing rooftop solar owners than low-income electricity users.  A lot more.


Who benefits from rooftop solar?  People who own their own homes and don't need to obtain HOA approval. That's basically people who live in Single Family Homes and have enough cash or home equity to purchase solar systems. They tend to be much wealthier than those who subsidize them.  (I know that lower income people have been growing among the rooftop solar owners, but that is largely because they were pushed out to live in new homes built in the deserts.)

That cost-shift from rooftop solar owners to those without is about $2 billion in 2019 and growing.

This post grew too long, so I split it up into another one explaining the Duck Curve and California's renewable energy portfolio. Stay tuned. 

Wednesday, October 09, 2019

Climate Change: Sitting in the Dark

Northern California is about to go dark in a few minutes due to a Public Safety Power Shutoff (PSPS) according to the PG&E outage map. This was forecasted well in advance, but forecasting the exact timing has been difficult. The published anticipated power shutoff start times have been earlier than the actual shutoff times.

PG&E interactive map
If you click on each colored outage circle on the map above, you can get more info along with another map of the affected area.  KQED made an easier to comprehend outage map and explainer.

KQED more informative planned outage map
The National Weather Service California Fire Weather map was also not reassuring.

Just as "land doesn't vote" maps may give an exaggerated picture, I wanted to see how many people--not just land area--were affected. It turned out to be a lot, 587,252 customers for PG&E alone. Each household (customer) can have multiple residents. Assuming an average of 3 people per household, that's about 1.7 million people. UC Berkeley had planned to cancel classes in the event of a power outage.

[My kid asked me if we have an earthquake kit. My reply is that I had started to assemble one years ago, but I can't find it among the boxes from my last 2 moves. ;-) I'm going to buy some drinking water containers and put her to work finding and testing all of our headlamps. Do iodine tablets ever expire?

It's a good thing we never got rid of our landline. Copper wire landlines continue to work after cell phone batteries and towers run out of juice.]

The downslope winds are moving southward through California. Santa Ana winds will probably arrive tonight or tomorrow in southern California.

Check to see if you in a Southern California Edison (SCE) PSPS area.  So far, only 65 customers are affected.

But, 761194 customers may be hit by PSPS between PG&E and SCE. Add in San Diego Gas & Electric and potentially 2.5 million (out of 38 million) Californians may be sitting in the dark.

How did we get here? The answer is complex, but I disagree with this woman.  She was burned out of her old home in Paradise, CA, and now she's upset about a pre-emptive power outage to prevent another fire?
“I’m really mad at them,” Heart fumed. “We’ve had high winds in California for years and they’ve never shut down the power. It’s unconscionable.”

PG&E should “bury their lines, fix their lines, take the grid and secure it better,” she said. Anything but turning off the power to 34 counties throughout California, which she sees as a completely cover-your-butt move.
The climate is a changing and it is largely due to people who move out to the margins, driving a lot of vehicle miles. A hotter planet means drier vegetation, particularly later in the dry season. More people living out in the Wildlands Urban Interface (WUI) means more ignition sources and fuel for fires.

I mostly agree with the LA Times editorial board on this one:
It wasn’t PG&E officials who approved housing developments in high-risk areas. In fact, the utility can’t say no to serving those homes, no matter how great the fire risk. The utility also doesn’t make decisions about how the vegetation around their customers’ houses and the forests nearby are managed. Nor is it the utility’s fault that human-caused climate change has created conditions that fuel massive wildfires. That’s a disgrace we all own.
Some of us are more responsible for climate change than others. The people living out in the woods should not be pointing fingers at the poor transit-riding urban residents.  The urban poor are not driving, flying or eating beef-heavy "keto" diets.  The climate would not be changing if all of us lived like the urban poor.

The 4,952 residents of census tract 2117.03 in Los Angeles, California living in 0.07108 square miles are not as culpable as the people living out in the woods.  Yes, some of them do drive alone to work, but mostly because transit is in a death spiral (that we are working really hard on reversing.)  They took up driving recently so they can hold on to their low-paying jobs that they desperately need.  Moreover, they drive very few miles.  The Paradise census tract is remarkably similar in income, housing cost and building age.

35 million, ~90% of Californians, will still have electricity because 95% of Californians live in urban areas.

The unlucky 5% potentially left in the dark live in urban clusters, as explained by Citylab:
But we're not just talking about cities here. The new figures represent the population in "urban areas," which the Census Bureau defines as "densely developed residential, commercial and other nonresidential areas."

There are officially two types of urban areas: “urbanized areas” of 50,000 or more people and “urban clusters” of between 2,500 and 50,000 people. For the 2010 count, the Census Bureau has defined 486 urbanized areas, accounting for 71.2 percent of the U.S. population. The 3,087 urban clusters account for 9.5 percent of the U.S. population.
Why should people who put up with the expense and aggravation (and also the joys) of urban living with a few million of their closest neighbors pay for undergrounding the utilities of a scattered few in the woods, at the expense of $3 Million per mile?  We'd rather spend the money undergrounding our own utilities.

We should not raise utility rates for poor people in Compton to pay for undergrounding utilities for the billionaires of Malibu.  The rich can pay to underground their own utilities.

I'm running out of steam here, but want to remind readers that Fire is a river that runs uphill. Don't move into a box canyon with only one downhill escape route.

Think about what it means to insist upon not spending a dime to improve fossil fuel infrastructure.  Suppose you were a mayor of a large city of 4 Million people and your own engineers told you to replace 70% of your fossil fuel power plants with renewable energy + battery storage but rebuild the other 30% of your power plants with new combined cycle technology so you can squeeze twice as much energy out of each molecule of CO2 emitted. What would you do?

The cheap, feel-good answer is to shut down all of your local natural gas power plants and take the photo-ops as a green mayor.  Then sign a 50-year contract to buy electricity from a new natural-gas power plant in Utah.

Intermountain power plant is ~600 miles away from LA and transmission lines go through fire corridors.  This is not a model of disaster resiliency.
What happens when the inter-state electricity transmission lines are shut down for high winds?  We'll sure miss our local power plants then.

I recently read Vaclav Smil's Natural Gas: Fuel for the 21st Century? and call bullshit on a certain mayor. (His publisher took out the ? sign.  Smil examines the case for Natural Gas and is not impressed by the hype.)

I'll be back later with more info about the differences between old and new natural gas power plants (they vary a huge amount in energy generated per unit of CO2) and natural gas production methods (super-emitters vs the best.)

Monday, October 01, 2018

Even El Ninos aren't what they used to be

Remember how things were bigger when we were younger?  How the El Niños of our youth just seemed to produce more rain in California?  How come so many El Niños of late have been La Nadas for rain?

It turns out that, like many things, the El Niños index has changed.  The NOAA Climate.gov El Niño blog explains Why are there so many ENSO indexes, instead of just one?

If you want to go deeper, read NCAR's Climate Data Guide entry about NINO SST INDICES (NINO 1+2, 3, 3.4, 4; ONI AND TNI).

The short answer is that the original El Niño index was based on the eastern Pacific areas where the effect was first noticed and named.  You may have grown up hearing TV weathercasters talking about El Niño index 2 or 3 (depending on your age.)  Today, they are probably talking about El Niño index 3.4.
Boxes denote various regions used to calculate El Niño indices.  The eastern Pacific ones (1-3) are closer to California and have a bigger impact on our rainfall patterns.  The western Pacific El Niño index is a better predictor of monsoon patterns in Asia.  El Niño index 3.4 gives the best overall diagnostic for global weather changes.
Each El Niño index is useful for someone. If you are interested in the global scale impact, the El Niño index 3.4 is the best compromise. This is the area used in official NOAA use. (However, they calculate and report all of them.)
It looks like we could have a mild El Niño in California this season. I'm cautiously optimistic for a wetter than normal winter. That may just be wishful thinking on the part of this gardener as El Niño 3 is meandering up and down in recent months.  My poor shrubs could use a good soaking to dilute the salts that have been building up from irrigation with hard water instead of rainfall.

Keep in mind that these indices are based on deviation from a departure from a 30-year mean.  The entire planet, including the oceans, has warmed in recent decades.  The temperature and pressure gradients (contrast between different areas) determine storm tracks.  But, the warmer oceans and air masses mean that storms contain more water, about 7% more water on average.

Storms are also sticking around longer due to changes in the jet stream (probably related to the melting polar ice.)  Some models suggest storms will generate 50% more rainfall in places where they land!  So, for those of us in California, rainfall will be more rare but more intense.  We need to re-engineer our cities for the new reality.  That's going to take money and cooperation because it is in everyone's best interest.  Are you with me?

Tuesday, August 07, 2018

How sticky is it?

I don't want to hear about how it is not that bad compared to Miami.  I didn't move to Miami for a reason.

My bedroom when I woke up this morning (generally the coolest part of the day.)

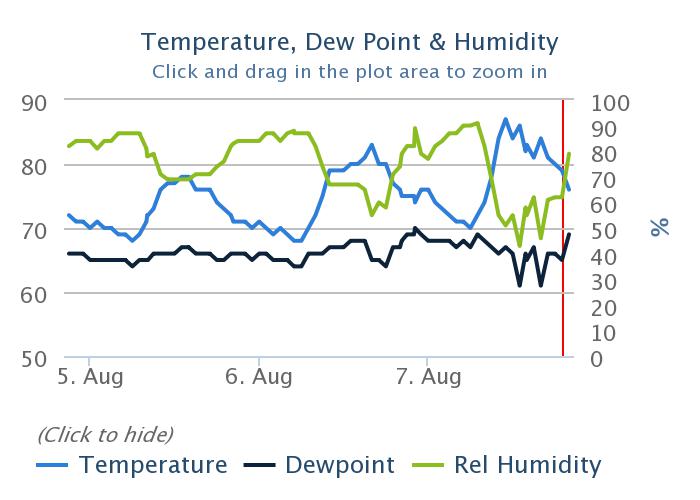
76F and over 80% relative humidity, ick.
Upstairs in the afternoon:

Almost 90F
What about the cooling sea breeze every afternoon? Nonexistent. The land-sea breeze is driven by the temperature contrast between the ocean and land. Check out this animation.
If the ocean is warmer than usual, the sea breeze weakens.

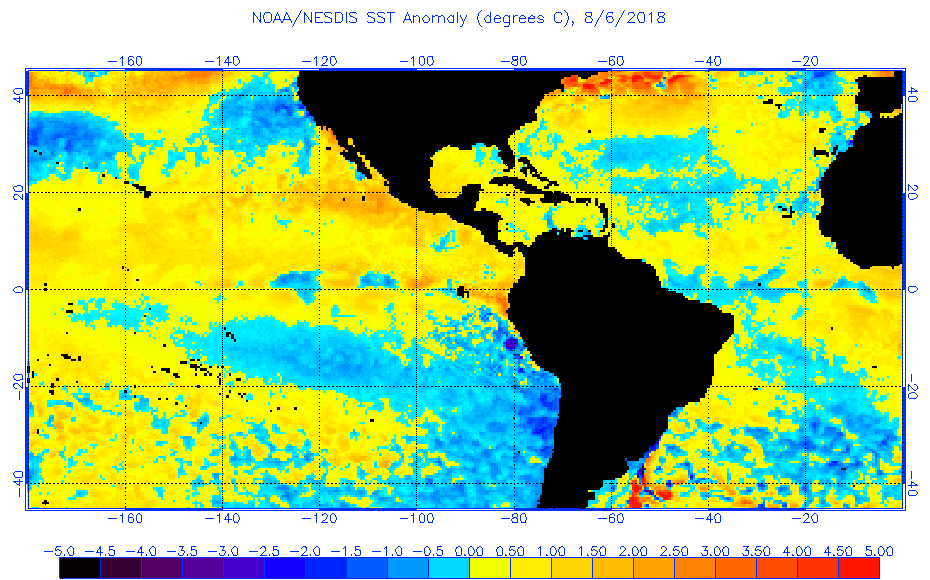
Right now, the sea surface temperature (SST) anomaly (difference from average temperature over many years for the same date) is about 3 C or 5 F warmer than usual.

SST anomaly from NOAA

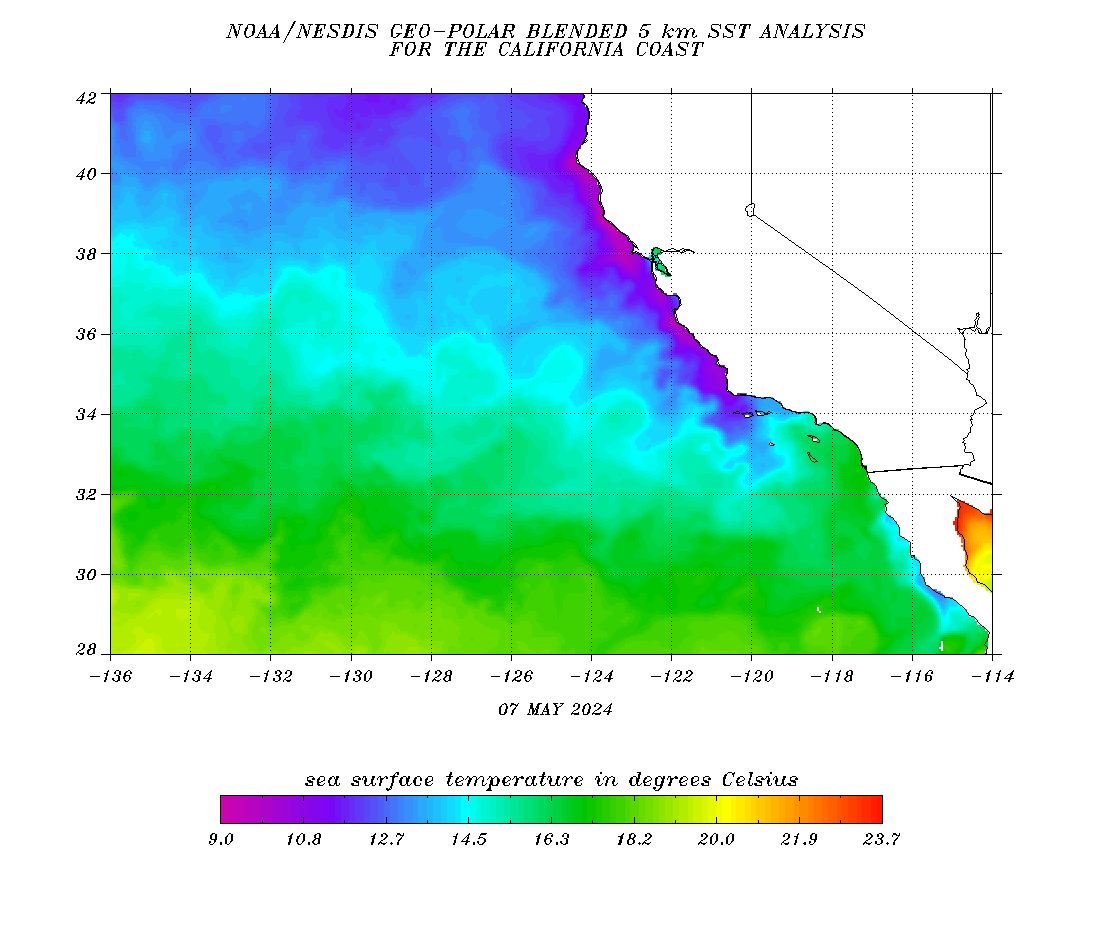
The ocean is about 22 C or about 71 F.
NOAA CA coast SST analysis
In fact, the SST at the Scripts Institute of Oceanography in San Diego is the highest in their recorded history.


I used this handy dandy relative humidity-dewpoint calculator to plug in my bedroom measurement of 84% and 76 F and got a dew point temperature of 72 F. Coincidentally, that's almost the SST offshore.

I checked my measurement against the calibrated weather station at LAX airport.  Their weather station is closer to the ocean than my house, so it will be cooler and breezier.  It looks like they are less humid, too.  (Master bedrooms run more humid than other bedrooms because of the en suite bathroom.)

In conclusion, it's not as hot as it was in early July.  But the humidity is higher and my misery is just as high.  I'm going to take a cool shower and then settle back with a book (Lightning Men) and an iced drink.

PS 5 years ago, we replaced our dark asphalt composite shingle roof with a highly reflective glass composite "cool" roof.  It made a difference and we patted ourselves on the back for not installing air conditioning, which would have cooled our home down, but heated up the planet overall (pesky thermodynamics.)  But now I'm regretting that.  As long as people are driving long distances in huge vehicles and eating tons of meat (paleo diet, I hate you!) I might use AC.

Thursday, July 19, 2018

Banking Rain for Sunny Days

Did you get the memo? Climate change will make rain less predictable and more intense in southern California. It's not clear if the total amount of rain will decrease along the coast. Rain will decrease in the Colorado River Basin, from which we import some of our water. For the sake of our water supply, we need to change how we handle water runoff.

Gregory Rachel, a firefighter and surfer, wrote a good primer on the why and how of water harvesting, with a photo of the Los Cerritos Channel Sub Basin 4 Stormwater Capture Project.


Joe Mozingo wrote A behind-the-scenes battle to divert L.A.'s storm water from going to waste for the LA Times and illustrated it with a picture of the huge Paseo del Rio at San Gabriel Coast Basin spreading grounds.


In 2016, he reported that only 65 billion gallons of rainwater is captured and stored in aquifers. Another 164 billion gallons goes out to sea.  I'm not sure if that 65 billion includes the water captured by smaller-scale "rain gardens" in homes and parks, such as this one that captures all the water on the parcel of the North Redondo Beach Branch Library.  I wrote about it in 2016.

The "local supplies" that provides ~40% of the water used in the LA area comes from wells or reservoirs stocked by water that fell as rain in our area (instead of water imported from the Colorado River or Northern California via long canals.) It does not count the rain that fell in your garden and soaked into the ground because that isn't metered/measured.

It's pretty clear that the Colorado River Basin is drying up and climate change is a major contributor. I'll write about regional competition and cooperation of cities and states in the Colorado River Compact later.

The supply from the California State Water Project that moves water from the Sacramento Delta to central and southern California is also endangered. It's threatened in the north by sea level rise and increased diversions that increase the salinity (salt) in the water supply.  Insane over-pumping of well-water by farmers in the Central Valley have caused the ground to sink as much as a foot per year in some areas, buckling and breaking the canals.  Currently, the peak capacity of the water canals to SoCal has been decreased by 20% because of the buckling.  Add to this that the canals must cross earthquake country and were built when we had much less experience in how to engineer for earthquake safety.  The California "Water Fix" is a political football and you can get whiplash from watching it.  That sounds like another blog post.

Long story short, we need to improve the things that are completely within our control.  That means we should build our neighborhoods with the intent of soaking as much rain water in the ground as we can.  It can be as simple as putting in gravel in the lowest spot in your garden so it doesn't flow off your property.  It can be giant basins that can harvest 200 million gallons from one storm and put it in the ground.   Or it can be something in between.

I'll end with pictures of a neighborhood-scale rainwater capture project in North Redondo Beach.  Thousands of people pass it every day on Aviation Boulevard and have no idea what it is.  This aerial view does not show you how hilly this area is.  Some of the streets are 15-20% grade!

Low-lying area in 90278
Some low-lying homes used to flood repeatedly.  Rather than rebuild these flood-prone homes, the homes were purchased for alternative uses.  The plot in the red box was bought by the city of Redondo Beach and turned into a parkette.  It also functions as a spreading ground to soak up the water that flows into it from surrounding areas.  After a heavy rain, it may be too soggy, or even covered in water, for kids to play in.  In that case, the park is temporarily closed off with cones until it dries up, typically in a few days.

The blue box was mysterious until I saw a workman doing maintenance there.  We had a fantastic conversation where he taught me what they do behind the chain link fence and I explained to him our best understanding of what climate change will do to our area.

The concrete channel in the blue box collects the rainwater that comes out of the storm drains (and flows off the surrounding land like the parkette.)  The "first flush" of stormwater, about 1/4" is sent to the sewage treatment plant for cleaning.  The rest of the water is sent downstream.

[LA has separate storm drains and sewage systems, aka "sanitary sewers."  Many older cities, notably Chicago, have just one system and raw sewage can be spilled when the sewage treatment plants cannot handle the rainwater volume.]

Water capture at local minima
Rainwater after the first flush is much cleaner.  It is sent slightly further downhill to a spreading ground where the water can slowly infiltrate into the shallow aquifer.  The grounds are blocked off from street view with a tall, solid fence, but an adjacent triangular permeable garden/parkette is visible from Aviation Boulevard.

Spreading grounds for rainwater
I've written earlier about how LA is ringed by hundreds of injection wells where fresh water (often reclaimed) is sent into the shallow aquifer to block sea water intrusion into the larger aquifer that we depend on.  The more rain we can get into the ground, the less fresh water we need to pump into the ground. 

Sea level rise from climate change increases the danger of salt water intrusion.  We'll need to put more fresh water into the ground along the coast to stave it off.

If we are to survive and thrive as a city/metro region in the face of climate change, we need to do smart things at the regional, local and personal levels.  Take a look around your neighborhood.  What is your city doing?  What are you personally doing?


Thursday, December 14, 2017

Not looking like a white Christmas

Have you seen the Aleutian Low? It appears to be lost. But maybe we can work together to bring it back?


I have a new personal computer at work and setting it up for weather data wrangling has been a slow and sometimes painful process.

We have a new supercomputer at work and setting it up for weather data wrangling has been an excruciatingly painful process.

Anyway, I made a movie for you of the 10-day GFS forecast and it looks really, really dry.

Instead of a low pressure system near the Aleutians, bringing in storms into the Pacific Northwest and sometimes into California, we have a variant of the Ridiculously Resilient Ridge (R3).

I plotted the Geopotential heights of the 700 mb isobaric surface (about 70% of normal sea level pressure and about the height of winter moisture.). The red area sitting over the western US is about 200-300 meters higher than surrounding areas.

This is the equivalent of a 200-300 meter high mountain range sitting between you and winter rains.  The rain is going to find a lower energy path.

Around December 20, an offshore Omega Block pattern forms.  Alaska is going to get some dramatically atypical December weather!

I'll be with family in CA and we will probably be dry, cold, and windy.

Monday, June 12, 2017

The high cost of grapes

Last week when my daughter and I were grocery shopping, she recalled the story about how I boycotted grapes for a decade* and asked if it was ok to buy them now.  I said yes with the caveat that we would buy only what we would really eat.  We were not going to let any rot in the fridge.

Do you remember when grapes were stupidly cheap? Stores used to advertise them for $.10 or $.15 per pound!  I think that today's $2/pound for California grapes (hauled hundreds of miles to Colorado) is still crazy cheap.
CA grapes image courtesy of ucanr.edu
Grapes--like all produce--is stupidly cheap because we treat farm workers as disposable people. It routinely reaches 110F (43C) at harvest time in the San Joaquin Valley.  Grape pickers work 10-12 hours a day in the searing heat to bring the harvest in on time.

Look at this list of farmworkers that died 2004-2008.  They are still dying.  Three people died in two days in 2016, including Maria Isabel Vasquez Jimenez.  It's not just grape pickers.

From California's Harvest of Shame: 2012
When a farm worker at Giumarra Vineyards, the largest table grape grower in the country, died of heat in 2004, the United Farm Workers union (UFW) began a campaign to end heat deaths. Since California issued its 2005 regulations to keep farm workers from dying of extreme heat, however, preventable farm worker deaths have continued to occur.
...
The fact is that the state simply just doesn’t have the resources to adequately enforce its heat standards. According to an August 22 editorial in the Desert Sun, “Last year only 1,090 heat inspections were conducted on California’s 81,500 farms. At that rate, many violations could go unnoticed.”

Fortunately, the UFW has a remedy. It has sponsored two bills — the Humane Treatment for Farm Workers Act (AB 2676), sponsored by Assembly member Charles Calderon, and the Farm Worker Safety Act (AB 2346), sponsored by Assembly member Betsy Butler — that will allow farm workers to protect themselves.

The Humane Treatment for Farm Workers Act says that agricultural employers must treat farm workers at least as well as animals or face the same criminal penalties. (California law makes it punishable as a misdemeanor or felony for every person who fails to provide any animal with proper food, drink, shelter or protection from the weather). The bill has already passed the Senate floor and is on its way to the Assembly.
BTW, the bill was vetoed by Governor Brown on the grounds that existing laws were sufficient.  It's hard to see this legal outcome (40 hours community service, 3 years probation and a $370 fine for killing someone) and agree with him.

As a matter of conscience (and consistency), I think that the laws against mistreating humans should be as strong as the laws against mistreating animals.

Driving down Interstate 5, I notice shelters for shade near workers and the occasional chair with an overhead mister for cooling.  Farms located where people are watching probably put on a better show. Perhaps, in the era of personal drones, we can make it harder for farmers and contractors everywhere to evade laws.

I'm heartened by the people who see an opportunity to make working conditions better and scale up. Check out Garth Patterson's $20,000 portable cooling station that can cool down 12 people at once.  Where there's a problem, there's an opportunity!

Garth Patterson with his portable cooling station.  Photo courtesy of AP via ChicoER.
I'm also heartened by the public pressure that is forcing Cal-OSHA to do their job in protecting farm workers from heat stress.

Heat deaths are not the only problem.  Heat stress can lead to kidney failure.  Think about the cost of dialysis and disability payments.  Think about disposable people.

What do you think the true cost of grapes ought to be?

For legal geeks:

Liability for Heat-Related Injuries by San Joaquin Agricultural Law Review

Aside:

* When I was a member of a Berkeley Student Cooperative, a member came to house council to ask why we never had any grapes in the kitchen. The kitchen manager explained that we subscribed to and followed the recommendations in the National Boycott Newsletter, which recommended boycotting grapes.

Summer grapes came from California's central valley, where farmers were resisting farm workers' demands for better pay and working conditions. Winter grapes came from Chile, which was run by the brutal ruler, Pinochet.

Damage to Chile's economy from boycotts might have helped push him out of power in 1988.

Friday, February 10, 2017

Los Angeles Weather and Climate

I was so shocked when I read this, it took me a while to figure out how to respond. I choose #sciencenotsilence.

 While I am aware that I have political differences with this sewing blogger, I had been prepared to look at our commonalities instead of our differences. I even took her on a tour of the Olmstead District in Old Town Torrance and introduced her to Momen+ fabric.

I'm not going to link to her blog, because that would drive up the reputation ranking of these #fakefacts. I'm just going to share a screen capture so you can see what I am talking about.


Deep breath here.  I read her blog because she is an extremely prolific and skilled sewer, knitter and photographer.  She is highly competent in her areas of expertise.  I read her blog so I can learn and be inspired.

I don't want to hurt her feelings, but I cannot let lies go unchallenged.

My blog is not glossy and professional.  I do not sew prolifically.  I sew and blog late at night.  I take photos with my phone or a compact point and shoot--often with poor lighting.  Why should you believe me and not her?

I work as a data specialist at one of the world's premier weather and climate data archives.  Prior to this, I earned a BA in Mathematics and a BS in Chemistry.  Then I earned a PhD writing models to compare theory with precision physical measurements.   The expertise I developed led to a job in an Air Force research lab running weather models and performing weather satellite Cal/Val (calibration and validation.)  I have also run climate models, but only at an introductory classroom level.  I eventually landed in my current position.   I am working in my third national lab.

I could earn much more money using my math, statistics and computer skills to spy on your web behavior to influence you to buy stuff you don't need.  Instead, I'm busy trying to preserve the best quality data available for future generations.

I am proud to be part of the global weather and climate enterprise.  It takes a huge amount of international cooperation to study our planet for our common safety and good.  I would never take part in an international conspiracy to lie to everyone.   It's absolutely ludicrous.

The reason that scientists are so alarmed about global warming is because it is a threat to all life on earth.  We're all going to fry together unless we work together to change our behavior.

So let's unpack the statements:
I don't believe in global warming
Neil deGrasse Tyson said, "The good thing about science is that it's true whether or not you believe in it."  He's right in that the planet is frying whether or not you believe in it.  But it's not a good thing.
or climate change or whatever they are calling it these days.
Don't blame the scientists. Blame the political appointees in the Bush 43 administration that forbade federal scientists from using the term, "global warming." Our scientific findings and reports were even scrubbed by fresh out of college political science majors with no science expertise whatsoever but fantastic partisan bona fides. But that is another rant.

The Obama administration did not renew that rule and some scientists drifted back to using global warming, while others use climate change. The planet does not warm uniformly, so there are good reasons to use CC when referring to some effects.
To me, it’s all weather, in some ways it’s predictable, in others it’s not.
This sows confusion.  "Oh, well.  We don't know for sure so let's ignore it."  No, we cannot ignore it and it is not confusing at all.

Actually, weather and climate are different things to scientists. The simplest definition is "Weather is what you get; climate is what you expect."

Edward N Lorenz wrote a classic explanation.

Weather is on a short time-scale and we are really good at predicting it. In fact, a 10-day forecast today is as accurate as a 3-day forecast was 20 years ago. I've written about Verification Statistics for my work blog. Weather verification is ongoing and published openly on the web. We got nothing to hide.

Climate models are similar and also very different from weather models. They have all the same physical models of how air, water and trace gases behave. But, they also vary in their external forcings (e.g. sun) and boundary conditions. Both types require millions of lines of computer code.

Early weather and climate models were not so good but both experienced continual improvement. Weather models are easier to verify and improve because of their short time-scale. I'm not going to live to see the verification statistics of 2100 climate simulations.  I'm going to have to trust that, because climate models verify well with the past, they will preform similarly well in the future.
What has been happening these last few years in California is predictable and following a pattern.
I don't know what she means by this. Is she referring to the El Nino/La Nina cycle that reverses every year of two? Or is she referring to the Pacific Decadal Oscillation, a similar warm/cool ocean pattern that occurs on much longer timescales?

When the cool phase of the PDO lines up with La Nina, rainfall plummets in southern California.  We expected a few very dry years and we got them.  We got a longer dry spell than we were expecting and there is much research about why that occurred.  Overall, scientists were less surprised than the media.  I don't know if you can blame the scientists or the professional weather communicators who are hired more for ratings rather than scientific accuracy.

This next paragraph took me a long time to unpack.
Simply put, we get rain in the winter, then we get a few years of drought, we always have fires, but at some point, we have massive fires all over the state. The following winter we will have an abundance of rain and snow, then come the mudslides. Maybe back to regular rain for a while and then the cycle repeats.
Have you studied rhetorical devices? It's useful to understand how people try to persuade you, even when the facts aren't clear.

Consider the false dilemma. They set up an either or situation. If A is right, then B is wrong. But the fancy talk obscures that there is no real logical connection between A and B.

Yes, California's normally dry summers would qualify as a drought practically anywhere else. That's just our climate. Fire is a perpetual hazard in the American west. Burned areas are prone to mudslides the following winter. All that is true.

Just because weather and seasons are cyclical does not mean that the climate is not changing.


2016 was the hottest year globally in modern history.  Higher temperatures cause more water to evaporate both directly and indirectly through evapotranspiration of plants.  Even with the same amount of water, high temperatures will create drier and more combustible forests.  We are already seeing this.  The fire season is starting earlier and ending later.  We are experiencing wildfires in January!

Just because it rains in the winter, does not mean that our climate is not changing.  No one is saying that climate change = no seasons.  In fact, we expect more weather extremes in both precipitation and temperatures.  That is exactly what we are experiencing.

The Sierra snowpack is a complex and highly alarming subject that deserves its own post at a later date.

Next, I plan another post about kettle logic and how it is weaponized to confuse people about science.

I haven't sewn anything since early December so I might as well blog about science.  #resist

Burda 6919 for my daughter was a success.