Showing posts with label Science. Show all posts

Thursday, June 19, 2025

Dark Roof Lobby

I just can't make up as self-serving as the Dark Roof Lobby.  We live in the post-truth society so they are even successful despite having no science to back up their assertions. 

[I learned about this issue, and about Floodlight News from the non-billionaire-controlled social media site, Bluesky. You can find me there under the handle, gspeng.]

Remember in 2012 when we replaced our dark asphalt composite roof with a Cool Roof? It cost no more than the dark color, and was also made of composite materials. Only, the cool roof contained light-colored bits of recycled and tumbled glass instead of dark asphalt bits. Instead of absorbing 70% of incident heat, it reflected 70%. 


It's not a big change in appearance, costs no more, was just as easy and quick to install, and lasts just as long. (Actually, glass is one of the more stable materials and it might last longer than asphalt composite shingles.) Installing a cool roof will make a big difference in your comfort on a warming planet, and on your pocketbook in cooling costs.  How often do you get something that is all upside?

That's a private benefit. The real gains are when it's multiplied at the city level. In Cool Roof 2: Cool Roof, Cool City, I explained mass deployment of cool roofs are the most effective and cheap method of reducing the Urban Heat Island Effect. We're talking dozens of studies using mesoscale modeling including radiative forcing calculations (instead of cheaper parameterizations), in a variety of climates. 

In different climates, Cool Roofs always comes out the top or second most impactful intervention for combatting the Urban Heat Island Effect. They are also the cheapest. Unlike trees, they don't require you to find water in the desert to perpetually water them. 

It's a sign of the times that I am not sure of the veracity of a epa.gov website and if it will be messed with later. As of June 19, 2025, these are factually correct. 

Who could possibly be against replacing a dark roof at the end of it's natural lifespan with a cool roof? 

Enter the Dark Roof Lobby, under the guise of an astroturf group calling themselves Coalition for Sustainable Roofing. 

The Coalition for Sustainable Roofing (COSUR) represents companies who manufacture cool roofs, dark roofs, gray roofs, white roofs, and everything inbetween. Carlisle Construction Materials, Holcim Building Envelope, and Johns Manville are long-standing North American-based manufacturers of a variety of building products. Because they manufacture a wide range of roofing products instead of specializing in just one membrane type, these companies have a unique vantage point from which to offer insights on holistic roof system design and sustainable roof assemblies. COSUR works closely with roofing architects, roof consultants, and roofing contractors to emphasize holistic approaches to roofing solutions, promoting resilience, energy efficiency, and urban heat island mitigation.

What is "holistic roofing?" How is lobbying against Cool Roofs promoting resilience and energy efficiency? Just say it out loud. You don't want to change and you want to milk your old factories for as long as you can without learning how to make different things.  

COSUR has exactly one employee, an operative government relations and equity-focused leadership professional. I am not going to link to her page, but here are screen shots from her LinkedIn. 

It would be comical, except that they were successful in preventing Denver from adopting a cool roof requirement and rolling back Tennessee's requirement. COSUR also stopped  adoption of cool roof requirements in national energy efficiency codes. 

Their lobbying uses talking points that are just blatantly untrue lies. Cool roofs do not wear out any faster, or cause mold problems. They cherry-picked one study from Harvard and ignored dozens of studies from around the world showing that cool roofs are very effective at combatting the urban heat island effect. 

Whether your home lacks air conditioning or if you are among the 27% of US families that struggle to pay their energy bills, a cool roof could be literally the difference between life and death in a heat wave.  

From the Floodlight Article:

But the weight of the scientific evidence is clear: On hot days, light-colored roofs can stay more than 50 degrees cooler than dark ones, helping cut energy use, curb greenhouse gas emissions and reduce heat-related illnesses and deaths. One recent study found that reflective roofs could have saved the lives of more than 240 people who died in London’s 2018 heatwave.

Energy insecurity is borne by renters, though landlords select the roofing material. This is why cool roof mandates matter. Over time, everyone will have access to this life-saving, and money-saving, measure. But we have to stop replacing dark roofs with dark roofs. 

Large roof manufacturers can afford to retool to make cool roofs. They just don't want to. People will die. 

Saturday, April 12, 2025

Motonormativity 2

I wrote an LA Voter newsletter (for members of League of Women Voters in Los Angeles County) article about Motonormativity and the way that local, state and federal governments reinforce it with their laws and actions. 

Professor Ian Walker wrote in the 2023 paper, Motonormativity: how social norms hide a major public health hazard, “Decisions about motor transport, by individuals and policy-makers, show unconscious biases due to cultural assumptions about the role of private cars - a phenomenon we term motonormativity.” 

His results were replicated in in the US by Professor Tara Goddard in the 2024 paper, Windshield Bias, Car Brain, Motornormativity: Different Names, Same Obscured Public Health Hazard. 

Past WIG speaker and public health researcher Isabella Chu, MPH, also spoke about the hidden public health hazard that is the top killer of US children. Indirectly, through air pollution and involuntary inactivity by making active transportation (walking, cycling) dangerous, cars may be the top killer of people in the developed world of all ages. 

Transportation, mainly private automobile use, is the largest contributor of CO2 emissions in Los Angeles County and the largest source of PM2.5 pollution (except in the occasional years when particulates from wildfire smoke affects populated areas of LACO.) 

Yet, all this is invisible to most people and especially law and policy makers. In California, it is legal to kill with a car as long as you were not intoxicated, were not speeding, and stayed at the scene of the death. This applies even if a driver kills a cyclist in a crosswalk

ILO wrote a letter to Metro’s Board of Directors for omitting protected bike lanes on the Vermont Ave BRT (Bus Rapid Transit) project plans. The City of LA’s Mobility Plan 2035 (adopted in 2014) promised to address identified shortcomings by 2035 by implementing the plan as each section of the roadways had work done. The Mobility Plan showed Vermont Ave would receive both a protected bike lane and a bus priority lane. 

Vermont Ave is infamous as more people die on Vermont Ave due to traffic violence than in the entire state of Vermont every year. (This does not include deaths due to pollution and other indirect deaths.) The LA Times explained the situation in Lawsuit filed against L.A. over lack of bike lanes, claiming Measure HLA violations

Local actions are even more important as we can no longer count on the Feds to help us. Under the Reagan Administration, Federal transportation dollars were allocated in a rigid formula of 80% to highways and 20% to transit. 

The Secretary of the Department of Transportation is Reality TV and Fox Business personality, Sean Duffy. He made headlines recently when he rode the NYC subway with NYC mayor Eric Adams and subsequently told Laura Ingraham on Fox News that "even big men don't want to ride the subway." 


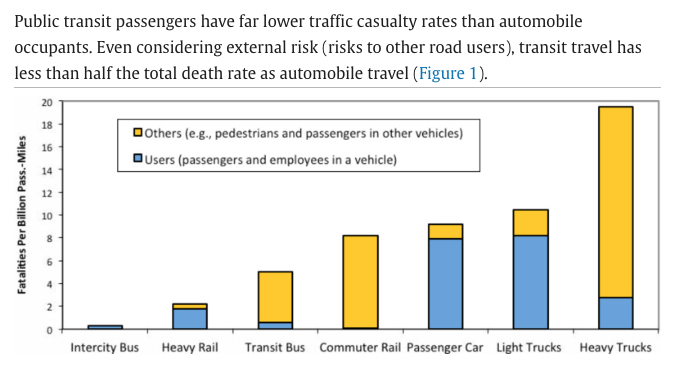
“Most transit trips include active transport (walking and/or cycling) links, and transit users tend to walk and bike more in total than motorists (Lachapelle et al. 2011). These modes have relatively high per-mile casualty rates, although this risk is largely offset by reduced risks to other travelers and improved public fitness and health, so per capita crashes tend to decline and overall health and longevity increase with more active travel in a community (Rojas-Rueda et al. 2011).” 
Transit is so safe that a 1% increase in transit mode share would result in a 2.75% reduction in road deaths. 


State lawmakers show similar characteristics of motonormativity. Until September 6, 2023, Californians could purchase EVs (electric cars) secure in the knowledge that they would receive guaranteed rebates of up to $7,500 for each EV, and that these would stack on top of Federal rebates of $7,500. The income cap was $200,000 for joint filers. California passed out over $1 Billion in EV rebates. 

Contrast that with the California eBike incentive, which has an income cap of $61,320 for a family of 2, and which exhausted the entire $10 Million allocated to eBikes within minutes. eBikes received only 1% as much money as EVs, despite global research showing that dual-mode households drove 19% less than before they obtained an eBike

 “Transportation is a climate and feminist issue. CA DMV data shows that women will spend twice as many years aged out of driving as men. Yet, our cities have not built infrastructure for people who don’t drive. 
… Car dependency is not just ruinously expensive, but it’s destroying the planet, and preventing nondrivers from fully participating in society. Women, as primary caregivers, are paying the time tax of chauffeuring people around. Protected bike lanes are mobility lanes, suitable for children on bicycles and seniors on mobility scooters alike.   
Local government decisions have kept us isolated and stressed.”

Thursday, January 02, 2025

Wastewater Surveillance Sites

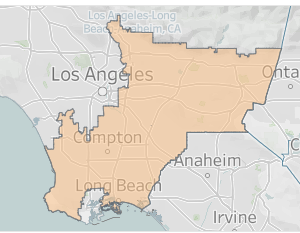
 My local wastewater treatment plant is one of the original CDC Sentinel sites where the CDC samples flu variants circulating in the population. I know that sewage-sheds are not perfect proxies for the general population. But, my wastewater (and that of 4.8 Million people in LA County) goes to the A K Warren Facility in Carson, CA. It's the largest treatment facility in LA County, the US, and among the largest in the world. 

The CDC sampled at a number of facilities around the country in different metropolitan areas, determined the circulating diseases discoverable from wastewater, and then formulated the flu vaccine supply accordingly. This is a backwards-looking process. What was circulating last summer may not be what is circulating now.  But, there is a long lead time to ordering vaccines and getting shots in arms. 

Anyway, we can test for a lot more things now. And, we have the capacity to test at more sites. I'm very nervous about what is at state now that Trump has lost the election and wants to install RFK Jr to lead the CDC. Most people won't know what we lose because they don't even know what the CDC does. This is just a small window in what this agency does.  

I just want to provide a few links to useful resources because Google Search has degraded so much, it's hard to find sites. Also, some sites have broken links--either moved elsewhere or lost their funding when the Covid Emergency declaration expired. 

This is what I could find today, Jan 2, 2025

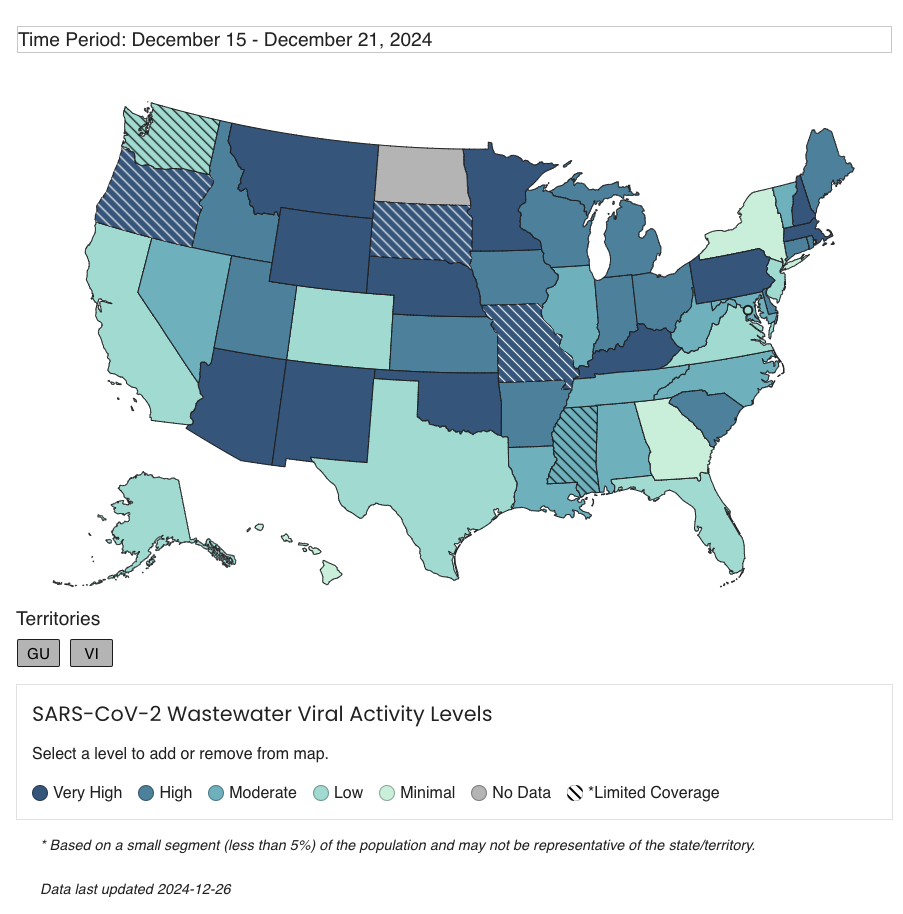
CDC National Wastewater Surveillance System (NWSS) main page has state-level data. 


Click on See the data at the left toolbar and you reach a page where you can select the pathogen and domain to create charts. For instance, here is the regional Covid-19 chart. Note that the CDC website has data until Dec 21. 


California's Department of Public Health has a newly redesigned website and I am still trying to find stuff. I used to visit the Tableau Cal SuWers weekly, but the old link doesn't work or redirect correctly.

New CalSuWers site (made with R Shiny) has data last updated Dec 26. CalSuWers reports to CDC and the national network, so it's showing data that is a bit more recent. 

Read the instructions/caveats. Then navigate to the Regional Data top level page.   Use the menus of the left to select regional or sewage-shed data. Note that this plant last updated data on Dec 31. 


Unfortunately, this data tool only reports Covid-19 data. There's lots more data I found on other sites. 

Members of  the California Water Environment Association collect a lot more data, including research products in partnership with scientists throughout California and the world. 

List of Participating CA Wastewater Surveillance participants

The best site visualization site I can find right now that collates data from around the US is from WastewaterSCAN, a Stanford-Emory led effort. 

Select the region on their national map, then zoom by region and select by sewage plant. 


Click View Chart and you can see Covid-19, RSV, Influenza A or B, Human metapneumovirus, Norovirus, Mpox, EVD68, Candida auris, Hepatitis A (for the Warren facility). The number and type of tests vary by location. The most recent data is from Dec 25. 


Based on positive detections for Hepatitis A in my subregion, I am glad that I started the 3-shot series that combines vaccines for both Hep A and Hep B. Covid-19, RSV, Inf A & B, and Norovirus are all circulating as well. 


Meanwhile, our whole family came down with a cold. We bought the Covid-19 + Inf A + Inf B home test at CVS and we just had a plain old cold. It really ruined our holiday plans. 

Mask up and stay healthy! 

A couple of additional sites:

Inside Medicine COVID-19 Metrics Dashboard by Benjamin Renton

H5N1 Dashboard by Daniel Summers


Wednesday, May 10, 2023

Guidance for the Metro Active Transportation Corridor: Redondo Beach Blvd Survey from a Local

Urgent Action Alert 

Deadline Extended to May 30, 2023 May 15, 2023 so read on and fill out the survey now 

I need you to fill out a public input survey about a vital active transportation project for Redondo Beach and surrounding cities in the South Bay region of Los Angeles County. This is our chance to reverse some of the damage wrought by past auto-centric road design in North Redondo Beach and allow those who can ride a bike to make school and shopping trips with confidence that they can make it home alive and in one piece. 

There's also a Story Map about the Redondo Beach Blvd Active Transportation Corridor Project with more information. 

Short version if you are in a hurry:

The current street allocation with car parking on both sides and massive SUVs speeding down our streets is not safe or welcoming for cyclists. The proof is in the declining bicycle mode share. 

When filling out the survey, select the options that give a protected bike lane every time. Scroll down past the background info to see my recommendations and why. 

Paint is not protection. Never select an option with a paint-only bike lane in the door zone. If someone opens a door, a cyclist in the door zone will be knocked off their bike and suffer grievous injuries. If they swerve to avoid the door, or are knocked into the traffic lane, they could be killed. No one wants to be killed or have their child killed while riding to school. 

Two-way cycle tracks are a good option, particularly near schools. When kids are arriving or leaving school, there will be a lot of traffic congestion on all modes. But cars are particularly dangerous. The less car traffic they cross while leaving the congested area, the safer they will be. Keep them on the school side of the street, with wide lanes so that there is passing room in the bikeway (keep the kids out of the car traffic lane). 

Plastic poles are not physical protection, but likely the best we can get as a first step.  Plastic poles can be replaced with bollards or concrete barriers later if we allow enough buffer space to install the plastic poles in the first place. Do not let the perfect get in the way of actions we can do right now. 

You can skip the background (but I hope you read it when you have more time).  

Background: The Connection with Schools

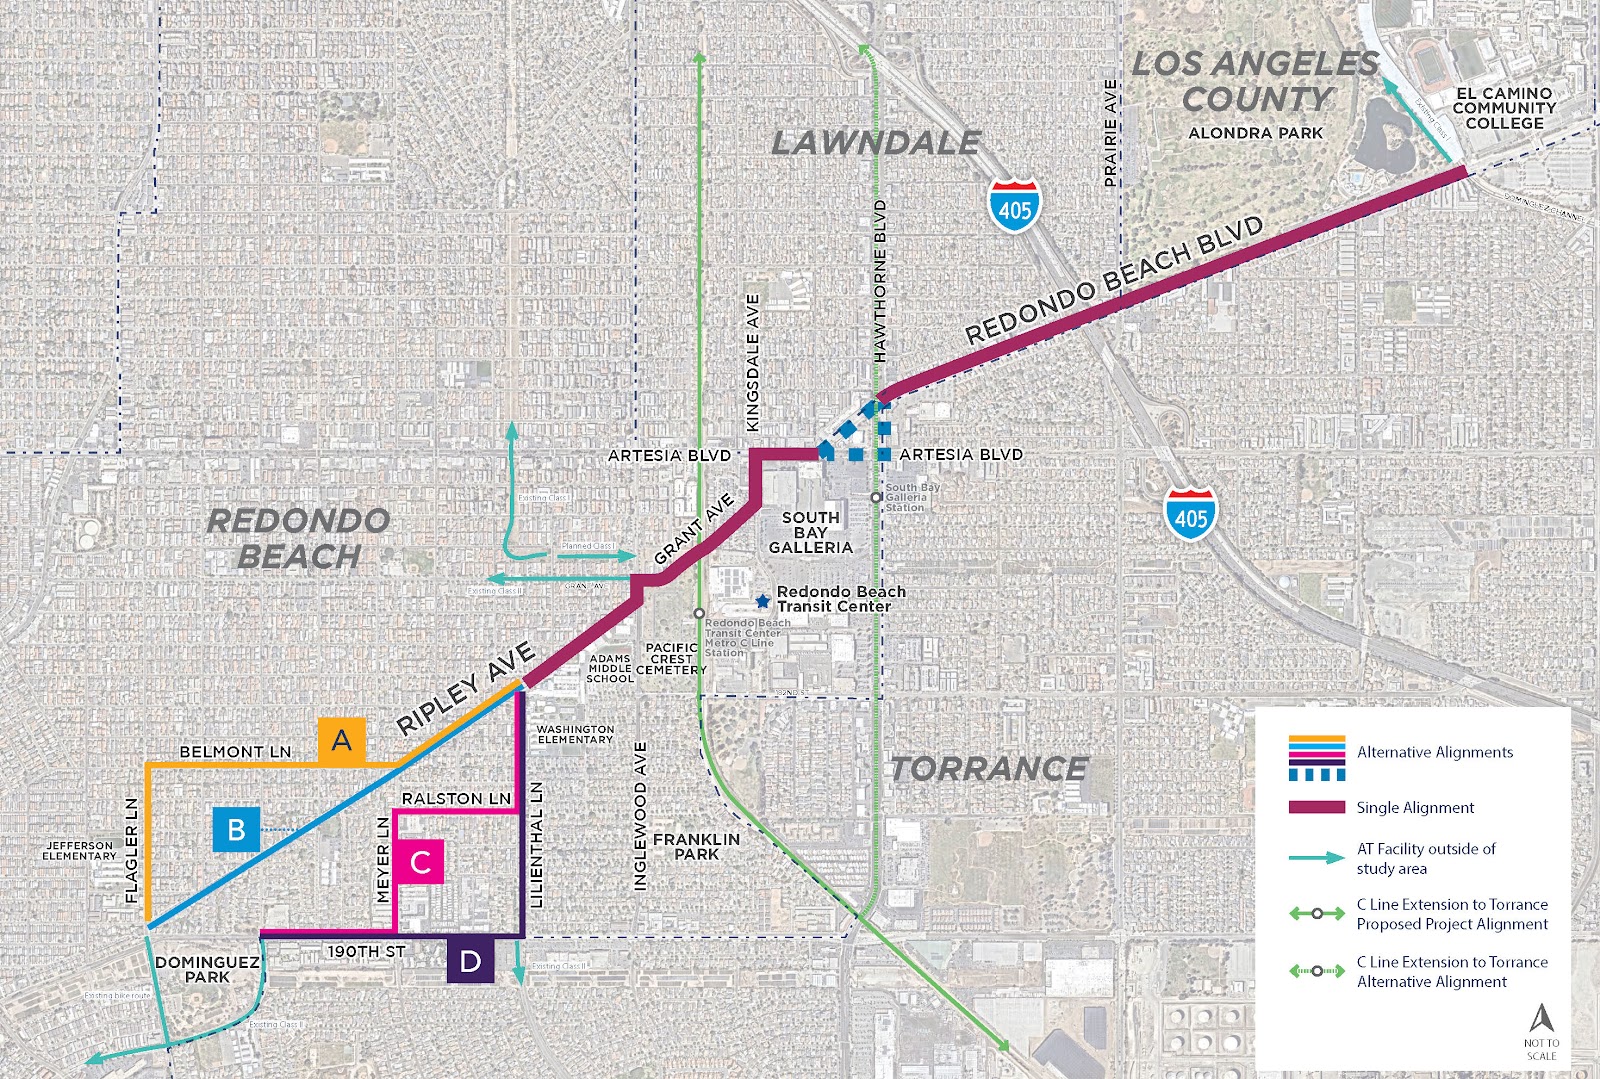
The project area below was originally going to be along the old freight route from Redondo King Harbor to the inland rail routes, but Ripley was found to be too steep (several areas with 15% grades) to be feasible for safe cycling. 


A Redondo Beach traffic study determined that 30% of the city's AM/PM peak traffic is the child school run. This travel corridor includes

  • Adams Middle School: 1066 students: 6-8 grades
  • Washington Elementary School: 801 students, K-5
  • Jefferson Elementary School: 509 students, K-5
That's almost 2400 K-12 students arriving and departing each day on this corridor. 

But that's not all, because all students in Redondo Beach Unified School District (RBUSD) attend Redondo Union High School (RUHS) in South Redondo Beach*. Jefferson ES students also attend Parras Middle School south of RUHS. 

Assuming 350/grade at Adams MS and 90/grade at Jefferson ES, 

350*4 + 90*7 = 2030 students cross 190th Street to attend school and return home each day. 

About half of all RBUSD students traverse this corridor every school day.

But that's not all; El Camino College (ECC, 22,000 students, many from the Beach Cities) is on the eastern end of this travel corridor. Some RUHS and MCHS students do concurrent enrollment and take classes at ECC while they are in HS. Due to many factors, including cost and lack of housing at UC campuses, a large number of students are enrolling in grades 13/14 at ECC before transferring to a 4-year college/university. 

When filling out the survey, think about what you would send your kid to school on. Think about what you would be comfortable riding on as you accompany your younger child to school or run your errands. I ride this area 1-2x/week to run errands in North RB or West Torrance. I want better infrastructure for my safety, too. 

Watch this video of the horrifying existing conditions as ridden by two fit MAMILs (Middle-Aged Men in Lycra). Would you ride these steep hills? Next to fast-moving busy traffic?


Here's another video of the area where Kyle, an area father, rides his kids to preschool. 


My opinionated guide for the survey choices and why they matter: 

Every cross-section shown is facing either Eastbound or Northbound.

Q1: For the westernmost portion of the corridor, which alignment(s) do you prefer? 


I picked D because that would give us a 2-way cycle track on Lilienthal and the longest length of protected bike lanes on 190th. 190th St is also the only way to avoid steep hills. 

The problem with B: The first video shows just how steep Ripley is. Notice that the lead cyclist on a light road bike has trouble getting up the hill (and the trailing cyclist with the camera is on an eBike). Going up a 15-16% grade is difficult, but going down them is downright dangerous. Do not send kids on this route. 

A and C are better, but still steep in some sections. Also, if those are the official routes, there will not be likely any road changes except Sharrows, which are shown to be more dangerous than not doing anything

Only Option D along 190th St will yield any road space allocation for cyclists. 

What is a Sharrow? 

Why are Sharrows so dangerous? 

Q2: The proposed street section for 190th St (Alignments C and D) is shown here. How satisfied are you with this proposal?


I picked Very Dissatisfied: These cross-sections are looking towards the east, with Torrance on the Right Hand Side (RHS) and Redondo Beach on the LHS. Cars are coming down the hill from Flagler and often speeding 50 eastbound mph. People drive with the sun in their eyes during the morning and evening commutes. Do you feel safe with just paint and plastic poles designed to bend when run over by vehicles?

I recognize that people living in the apartments in Torrance on the right need overflow parking, but let's swap the bike lane and parking lane. Install a parking-protected bike lane like this one in Long Beach on the Torrance side with breaks to preserve sight lines at each driveway or street crossing. 


On the RB side, I'd like to see real bollards or a curb. Imagine something like these without the parking lane. Images courtesy of National Association of City Transportation Officials (NACTO)


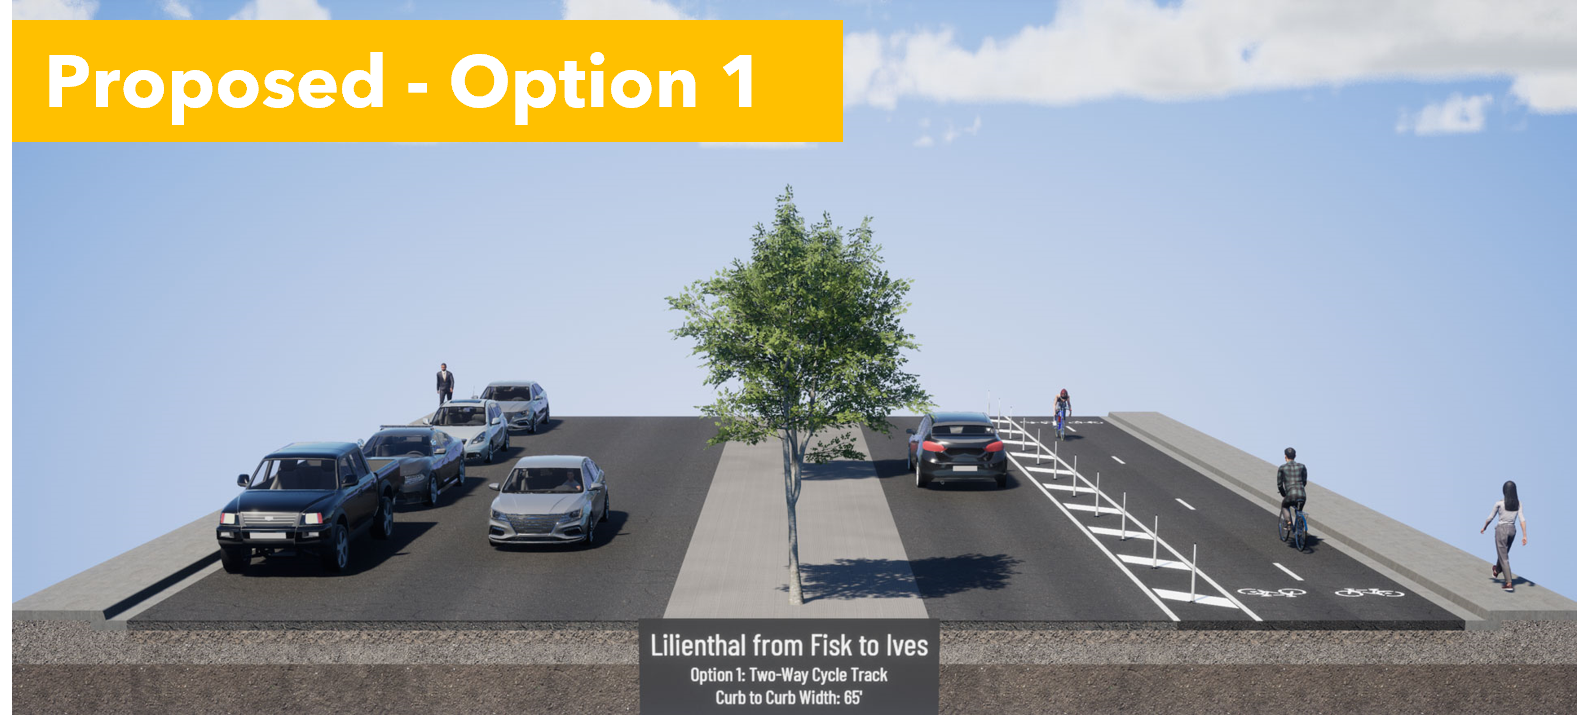
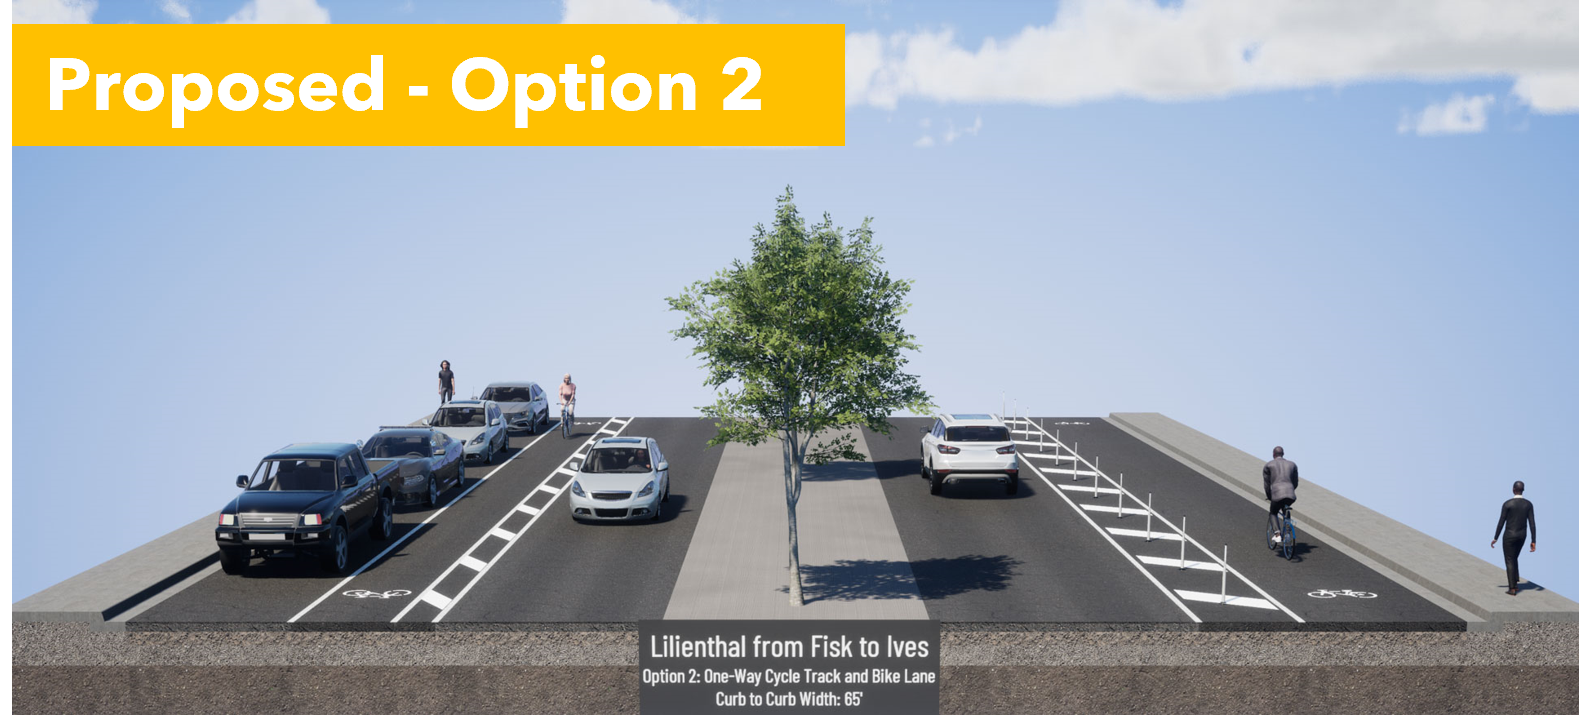
Q3: Select Option 1, the 2-way cycle track on the east side, next to Washington ES. 


Option 1 provides separation from cars, and is wide enough for passing, and allows parents to ride side by side with a child gaining confidence in their bike skills. In 2-way cycle tracks, people riding opposing car traffic are facing approaching cars, so they can see and react to dangerous drivers. It would be better to have solid protection here, but Option 1 gives us room to retrofit with more solid barriers later. 


Option 2 puts kids in the door zone on one side and makes them cross the street to get to school. It's a dangerous situation. 


Q4: Select Option 1, the 2-way cycle track on the east side, next to Washington ES.  


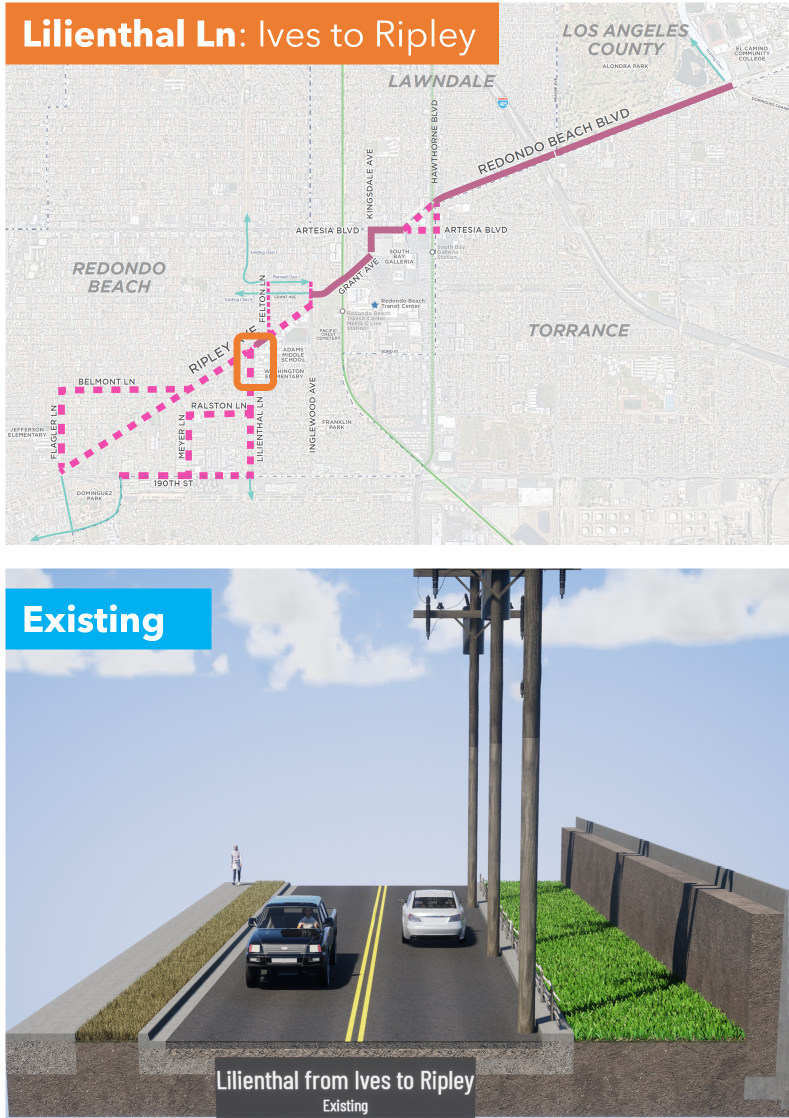
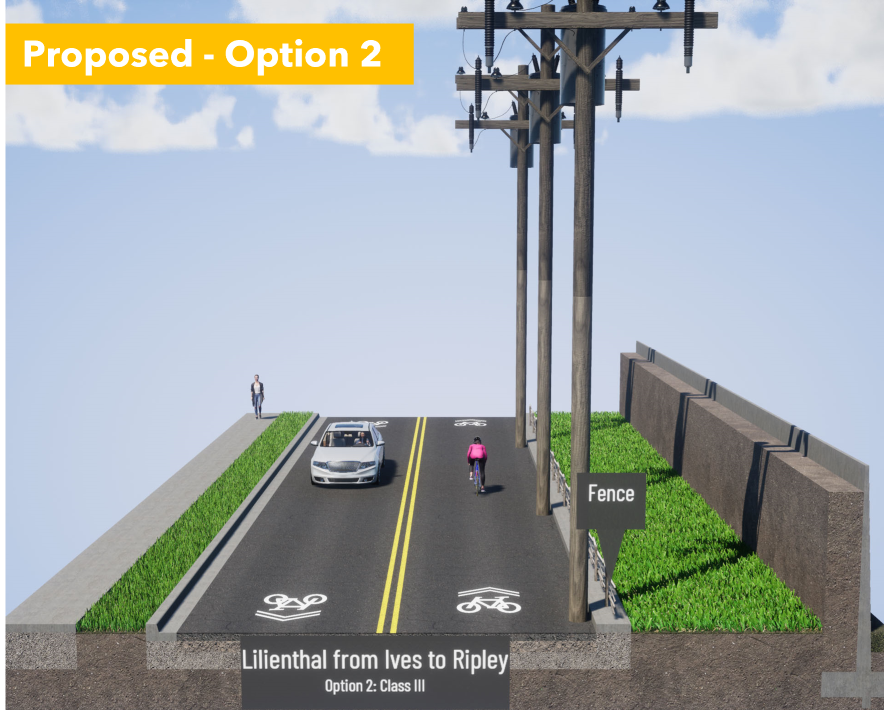
Don't be distracted by the stock visualization image with a tall solid wall. There is currently short solid wall on the parking lot side and a wood and rope fence on the road side. 


Option 1 gives a clear place for kids to ride that is physically separated from cars. The 2-way cycle track would replace the wide grassy area.


Option 2 is sharrows in a place where drivers are more focused on making a turn at Ripley than cyclists approaching from behind them. 

Motorists trying to make a right turn will pull over to the right, trapping cyclists behind them. Small children on bikes and tall, boxy hoods on todays trucks and SUVs mean that parents may not be aware of cyclists in front of them. This has led to an epidemic of frontover crashes where drivers run over people in front of them because they can't see them over their hoods. Or, they look at their screens and forget that there are children in front of them. 

Option 2, sharrows, is a safety disaster. 


Q5 on Ripley: Pick Option 1, the 2-way cycle track on the Adams MS side


Option 1 keeps the kids on the school side as long as possible. It also preserves the car unloading curb space that people are currently using. 


Option 2 puts kids in the door zone, at precisely the time that kids being driven to school are unloading. This is a safety disaster. 


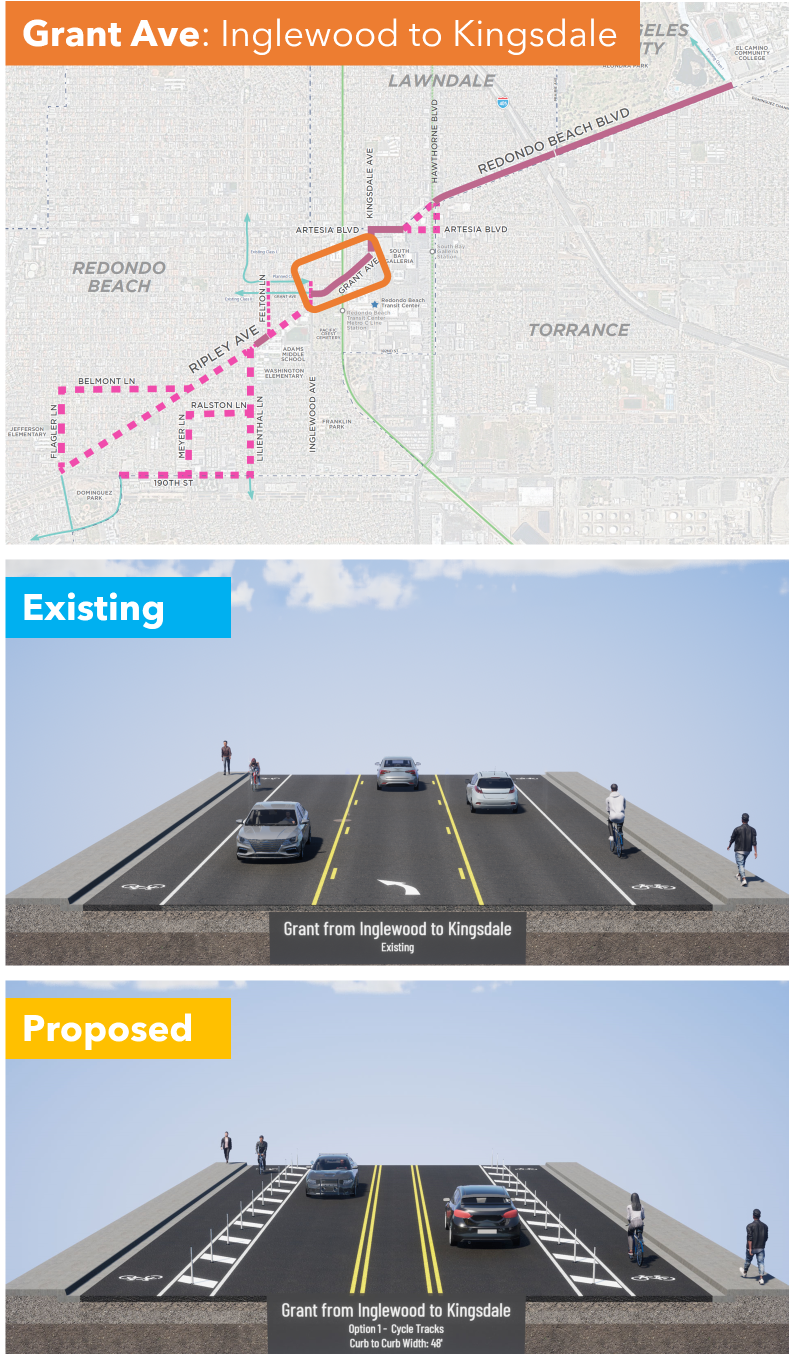
Q6: Grant Ave from Inglewood to Kingsdale; I am very dissatisfied but I selected other and explained why we need solid protection instead of plastic bendy poles


They are proposing paint, a buffered (space separation) and plastic bendy poles. 

This is better than existing conditions, but not safe. Cars pick up speed heading downhill and frequently misjudge the curve, so they end up sideswiping cyclists in the bike lane. We really need a concrete barrier on the downhill (right hand) side. 

I ride by bike to shop at the Galleria and this is the scariest part. I saw a guy almost get killed here. If we want more people to bike through this area, which connects to shopping, the South Bay Transit Center, and the 300 new homes under construction, then we deserve solid protection in this dangerous area. 

I gotta break for lunch but I'm going to hit Publish on this so you can get started. I'll finish after lunch. 

...

I'm back. Stay with me because we are on the home stretch, but the most dangerous one that crosses the 405 Freeway and has the most high-speed traffic. 

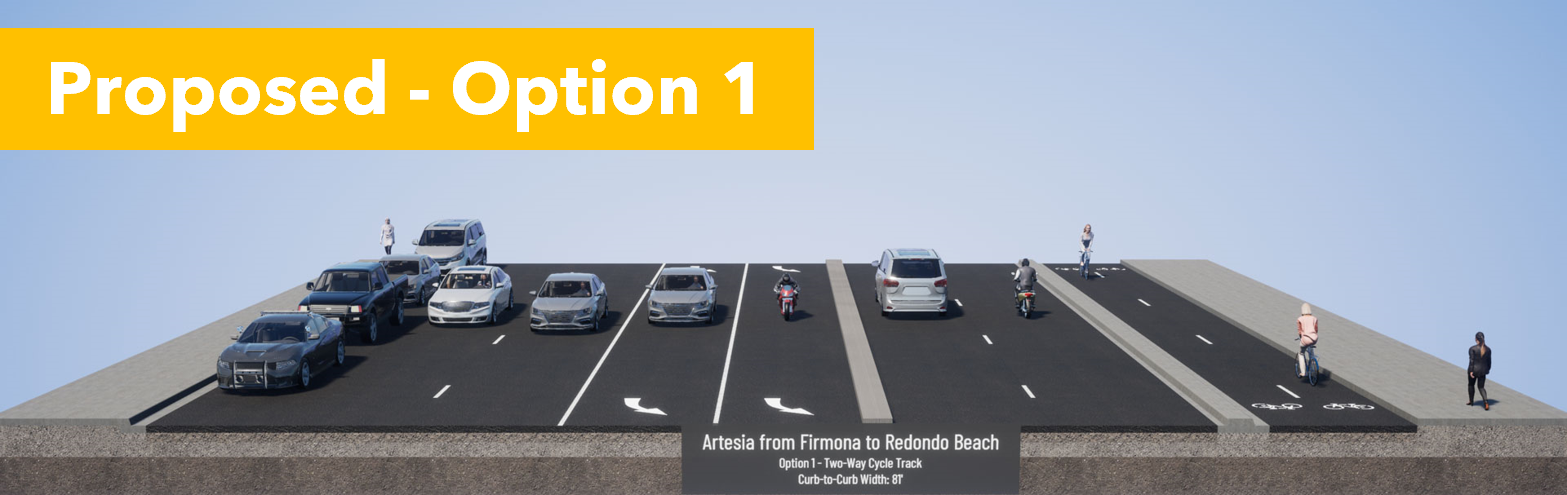
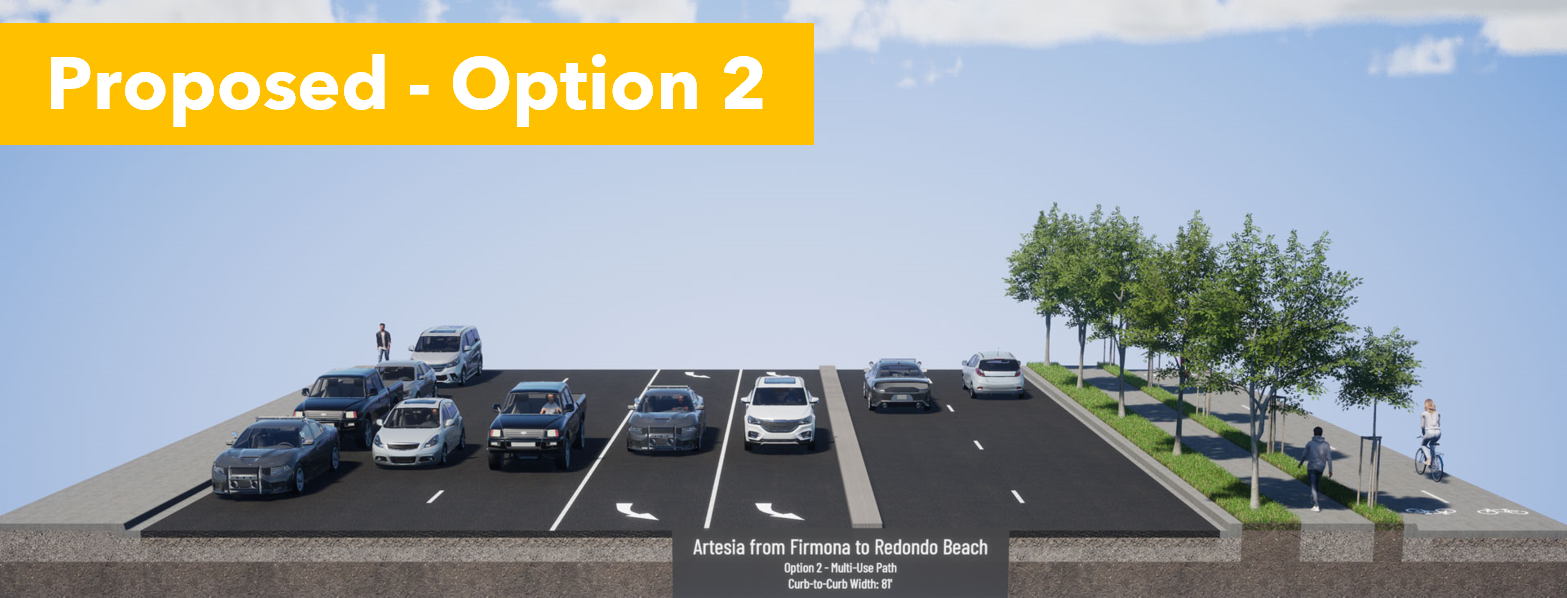
Q7: Artesia Blvd from Kingsdale Ave to Redondo Beach Blvd pick Option 2.  

Existing conditions are awful and you see very few cyclists brave enough to ride here. If they do, they are often on the sidewalk, conflicting with pedestrians. 

Option 1 puts cyclists next to vehicle lanes, but protected with a concrete curb. Pedestrians and cyclists would intuitively understand where they are supposed to be, as faster bike traffic is at the street level. However, this would interfere with bus stops. 


Option 2 puts pedestrians next to the vehicle lanes, but also next to the bus stop. Trees would provide shade. There could be some confusion with pedestrians wandering on the bike path, but that can be solved with good signage.


Our community has experience with pedestrian and bikeways next to each other in the North Redondo Beach Bikeway (NRBB). While there is some spillover, people have already learned where pedestrians and rollers have priority on the NRBB. Option 2 will work best for us and we already know how to use it. 

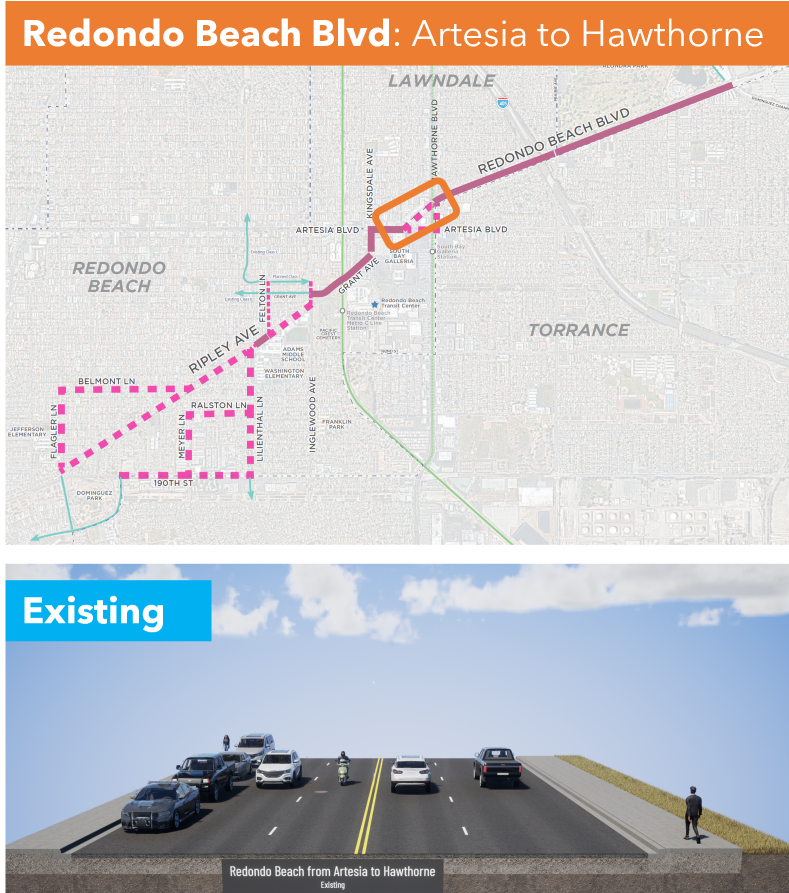
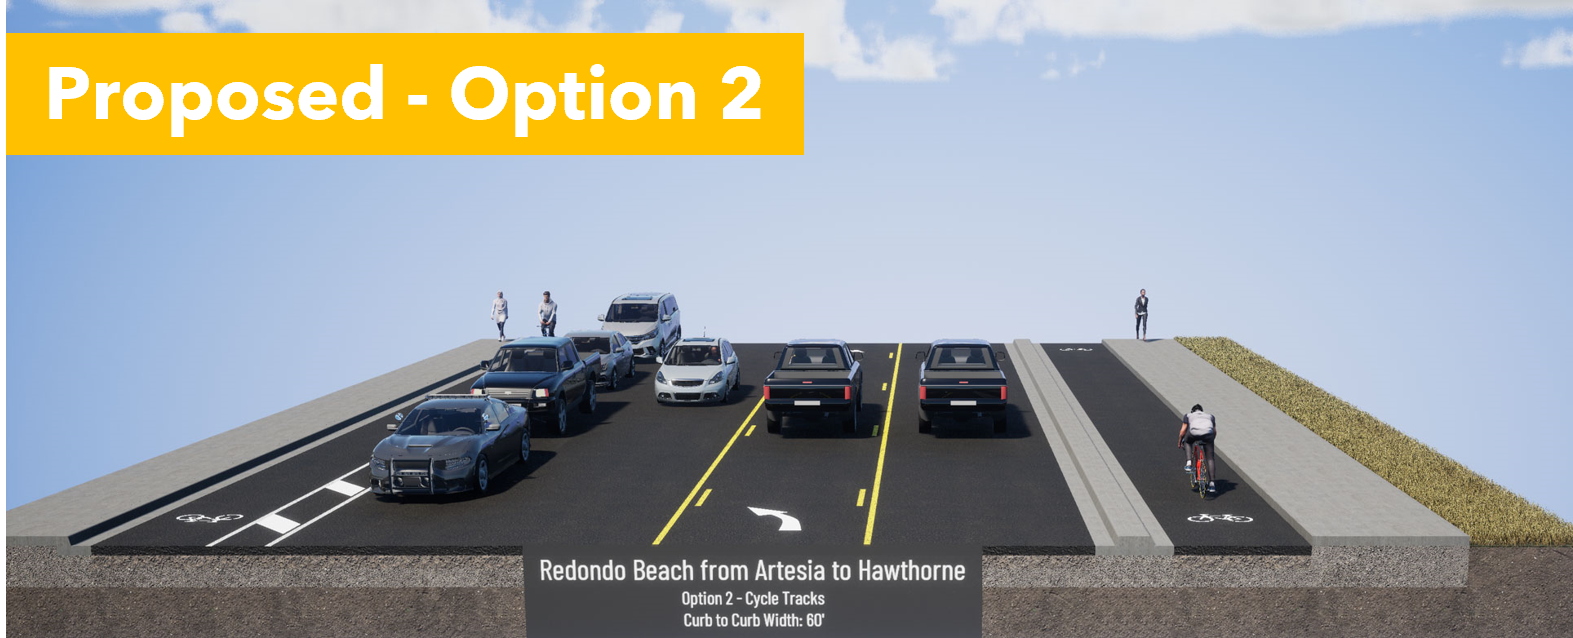
Q8: Redondo Beach Blvd from Artesia Blvd to Hawthorne Blvd. Is a tossup but both Options are so much better than the status quo.


Option 1 pits cyclists against pedestrians, but provides 2-way access to Walgreens and Starbucks. It's not terrible as long as cyclists slow down when passing pedestrians and motorists exiting the parking lots look both ways. 


Option 2 provides a clear separation between motorists, cyclists and pedestrians. Cyclists are curb-protected on the eastbound RB side, and parking-protected on the westbound Lawndale side. However, coming westbound from Walgreens/Starbucks, people will likely bike on the sidewalk until they meet the 2-way cycle track. 


Although you lose a traffic lane, it's not the cyclists' fault. One can just as easily blame the space allocated to free car storage (on-street parking) and a turn lane. Motorists are losing a travel lane to other motorists, not cyclists. Don't forget that. 

Option 1, the 2-way cycle track, provides a better alternative not suggested by Metro for the next section. 

Q9: Redondo Beach Blvd from Hawthorne Blvd to Prairie Ave. I am Very Dissatisfied & propose a better solution. 


Although the status quo is very bad, we shouldn't rush into the proposed door zone bike lane next to high-speed traffic heading to the freeway onramps. It is extremely dangerous. This will greatly reduce the number of people brave enough to ride to Alondra Park and El Camino College. 

If there is enough room for on-street parking, then there is enough room for a parking-protected bike lane. That may require narrowing the car lanes a bit, but that would also inhibit speeding, making that stretch safer and quieter for all road users. 

The freeway onramp is on the north side of RB Blvd. A 2-way cycle track on the south side of RB Blvd would keep cyclists away from the crazy line of cars trying to merge onto the 405 on-ramp. Suggest that in Q11. 

Q10: Redondo Beach Blvd from Prairie Ave to Dominguez Channel. Pick Option 1, the 2-way cycle track on the North side, next to the park and El Camino College. 


Option 1 puts cyclists next to the park and ECC. Although it is shown with plastic bendy straws, it can easily be fitted with bollards or a concrete curb for better protection when cycling to and from evening classes at ECC. 


Option 2 puts cyclists in the door zone, where they can be knocked into fast-moving traffic and killed. Drunk or malicious drivers can also harm cyclists easily with only "paint as protection". 


Q11: Additional Comments: This is where we ask for a protected 2-way cycle track on on the south side of RB Blvd between Hawthorne and Prairie. 

What do you need to be comfortable bicycling this corridor? Tell them!

Keep in mind that younger Beach Cities kids will probably only ride the western side of this corridor, west of Inglewood or Kingsdale. But older teens and young adults may need to ride to ECC or to retail jobs between Kingsdale and Crenshaw. 
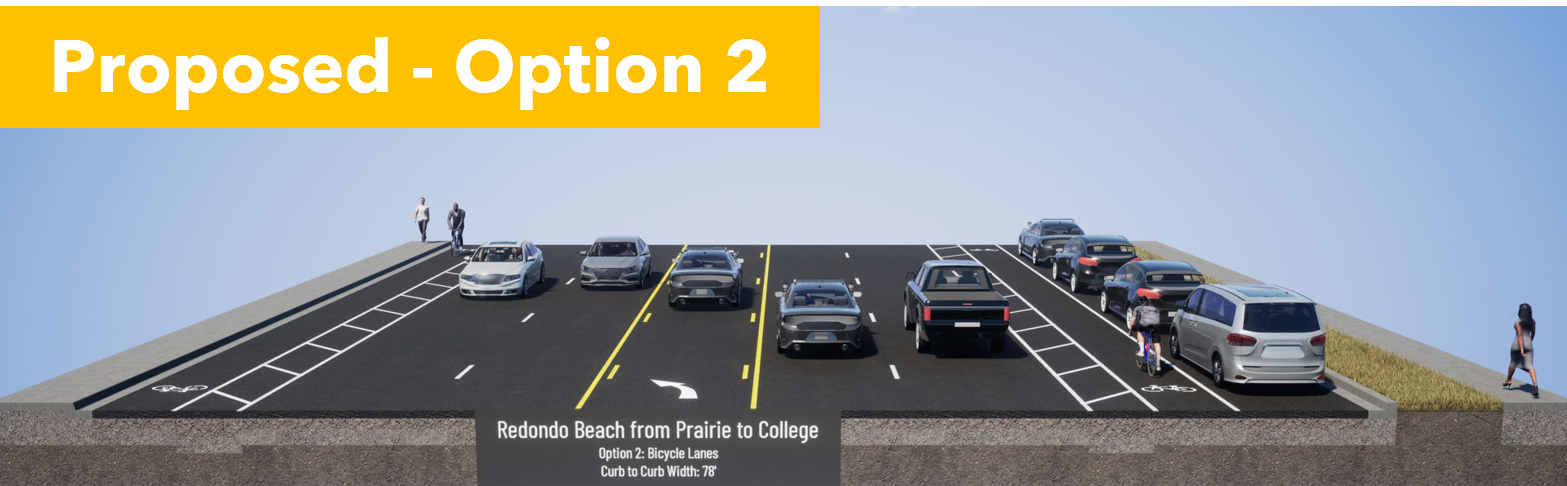
There are a lot of children and seniors in Lawndale and Torrance who would benefit from these bike facilities, whether they are riding a bike, trike or mobility scooter. 

We should make this corridor welcoming for ages 8-80. 

Think about who needs to travel through this corridor and at what times. What kind of cycling facilities do they need to get there comfortably and safely?  What about seniors in mobility scooters or electric wheelchairs? Would you like to see food delivery robots in the bike lane or more food delivery by privately-owned cars?

With better bike facilities, I may choose to bike to stores further east than I currently feel safe. Every trip I make by eBike instead of car, I am "sparing the air", not taking up road space in front of you, and not competing with you for parking. 

Another thing that excites me about this project is that it connects us to the Dominguez Channel. In a separate project, LA County Public Works will be extending the bike path along the channel southwards. It currently goes north to 120th St, past Amazon, Space-X, Lowe's and to the Metro Green/C Line. A southbound channel bike path would connect to the Harbor Gateway Transit Center, with very fast connections to the Silver/J Line to USC/Expo Park (15 min) and Downtown LA (20 min). Harbor Gateway TS is already linked up to CSU Dominguez Hills. This is a large step forward for a transportation transformation for the South Bay. 

Bike lanes benefit you even if you don't ride a bike, but your neighbors do. 

Bike lanes will save you time currently spent chauffeuring your kids short distances. 

Bike lanes will benefit your kids because students who get exercise before school do better. 

Bike lanes will benefit you when you age out of driving. 

Bike lanes may allow your family to shed one car, saving you over a million dollars per lifetime

Finally, I want to close with this terrific video of a #BikeBus led by Coach Sam Balto in Portland. 

https://twitter.com/CoachBalto/status/1656353963489501190?s=20

This bike corridor will touch the lives of half the students in RBUSD and can be transformative for the way our community gets around. If half of our households can shed just one car, we would be richer, our street parking and traffic congestion problems will evaporate, our air and water will be cleaner, and we will have done our part to slow climate change. Oh, we'll be fitter and happier, too. 

* A very few students living in North RB attend Mira Costa HS in Manhattan Beach, but only if MBUSD will take them. 

Friday, December 23, 2022

Destroying the NIMBY Sewage Capacity Talking Point: Another Zombie Myth

Meta:

I was coached to give an executive summary so people know where I am going. 

Executive Summary

  • Sewage Capacity is not a reason to deny infill housing in established areas of Los Angeles County. 
  • It's cheaper to service sewage from infill housing than for sprawl housing because you are using capacity that already exists and is currently underutilized. 
  • Infill housing reduces or eliminates the cost of declining water flows, reducing costs to existing residents.  
  • Infill housing spreads the fixed costs of infrastructure among more customers, reducing costs to existing residents

And was also told to add more color pictures, like this One Water Cycle graphic by Brown and Caldwell, 2017. 

Where I normally start my ramblings:

After I signed that petition, Change.org offered me another one to consider. 

Their algorithms offered me Oppose the mass build apartment complex on Little Britain Rd (Rt 207)


It was such a classic display of NIMBY Kettle Logic about horrible traffic and parking woes, which they themselves contribute towards. This area is simultaneously such a historic area that it should not be desecrated with more traffic, while it is already so traffic-choked, that it cannot accommodate one more car.

But, since I had just been thinking about the societal impacts of chemistry and engineering, I homed in on the arguments about sewage. 

  • A massive build like the one being proposed will dramatically change the character of our neighborhood.
  • It will also have a significant impact on traffic in the surrounding area.
  • It will further tax our already heavily burdened water and sewage systems, and potentially have damaging environmental impacts to the Quassaick Creek and its wildlife.
The build puts additional strain on the current water supply and added pressure to the city sewage system’s downstream capacity.
Residents in the town of Newburgh are currently nearing our maximum agreed sewage usage with the city.
...
In 2004 the town updated their intermunicipal sewer agreement with the city to increase the amount of sewage the town sends to the city treatment plant at 2,000,000 gals/day with the ability to send an additional 2,000,000gals/day providing the town pay to enlarge the current city facility. This previously cost taxpayers $1,250,000 to construct the necessary facilities. According to the November 3 town planning board minutes, the town is currently sending 2,000,000 gals/day already and at their first allotment. They have 2,000,000 more gallons owed to them, but much of that has already been allocated to other projects.
As stated in their draft scope, the proposed apartment complex would produce an estimated 28,380 gals of liquid waste per day. And according to the 2004 intermunicipal contract "when the town’s average flow exceeds 3.4 million gallons per day as evidenced by the last 90-day average flow" a second expansion will need to be constructed by and paid for by the town residents, unless we insist the cost be passed on to the builders of these new projects.

The US Census office estimates that Newburgh, NY has a 2021 population of 28,834. 

If 28,834 people send 2,000,000 gals/day of sewage to the treatment plant, that's 69.4 gallons per capita per day (gpcd). How many times are they flushing every day?!?! Or do they have many industrial facilities? Why are they using so much water?!?!

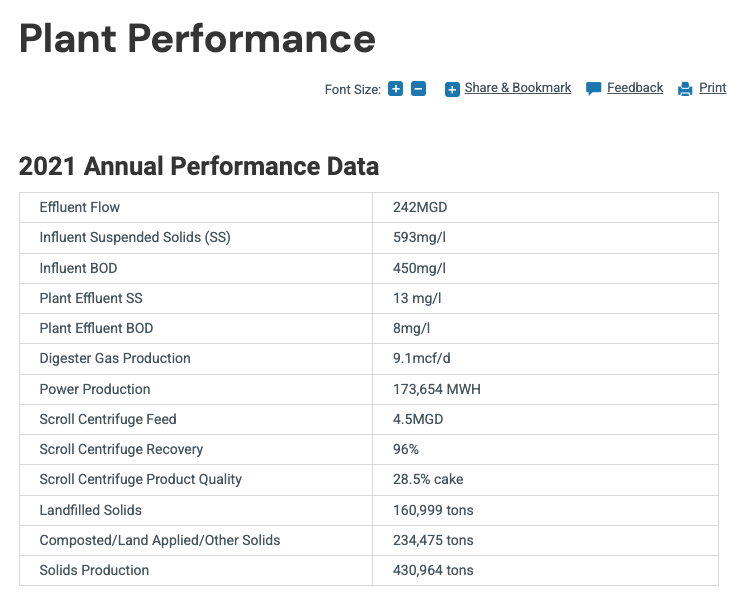
In contrast, 4.8 million Los Angeles County residents and a lot of businesses & industrial facilities sent 242 MGD of sewage (in 2021) to the Joint Water Pollution Control Plant (JWPCP), 50.4 gpcd. 

If Newburgh residents were as water-thrifty as Angelenos, they could house 10,000 more people and have cheaper sewage service as well because they would be spreading fixed costs among more customers. 

JWPCP has a design capacity of 400 MDG, we've added ~1 million people to the service area in the last 20 years, and we are still using only 60% of the capacity. We can add millions more residents without needing any more sewage treatment capacity. 


JWPCP is a huge plant that serves almost half the people in the most populous county and one of the largest manufacturing centers in the US. 


If Newburgh residents were really concerned about not overrunning their sewage capacity, they should look at water saving household appliances, low-flow toilets and low-flow shower heads.  But, perhaps they are just not interested in providing homes for people. 

They do seem interested in providing homes for cars. One of their objections to this apartment complex is that it will only provide 515 parking spots for 259 homes. 

Enough poking fun at Newburgh NIMBYs. We have plenty of NIMBYs at home in Los Angeles County to poke fun of. 

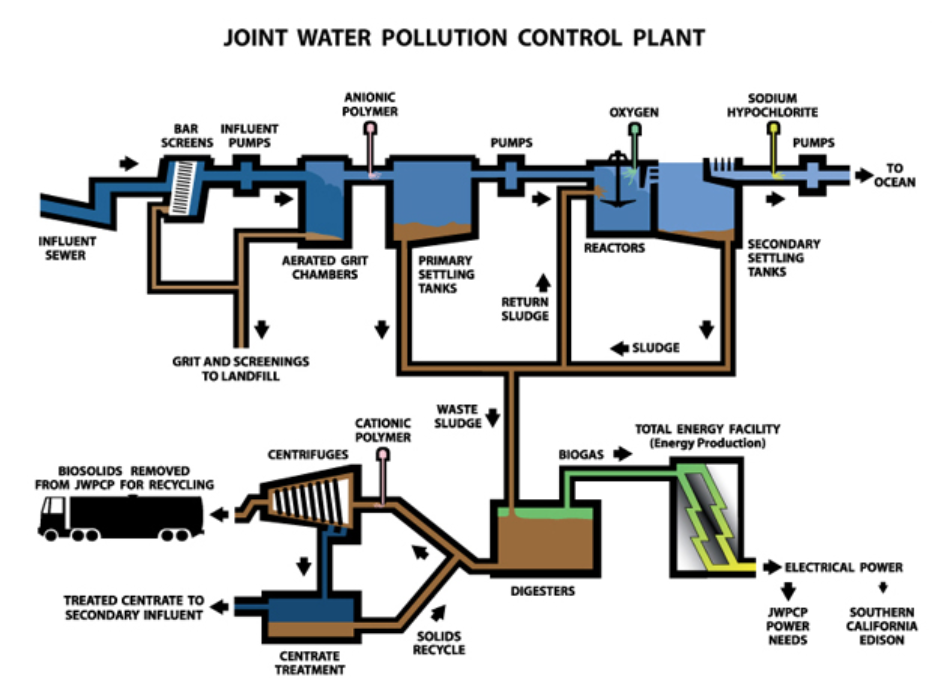
Gratuitous diagram of JWPCP, a social network tying together 4.8 M Angelenos


Consider the problem of declining water flows. This is a serious and expensive problem for established areas that are not building housing fast enough to offset improvements in water efficiency.  Californians in existing developed areas are using about 2% less water per year. If that is not offset by infill, this causes problems for both drinking water and sewage systems. 

California Urban Water Agencies surveyed their members and wrote a white paper on Adapting to Change: UtilitySystems and Declining Flows. Go to Section 6 (page 22), Impacts of Declining Flows on Wastewater Treatment Plant Operations. 40% of urban systems reported effluent quality problems. 

Lower flow means longer residence times in the sewage pipes, which exacerbate production of gases. That's both an odor and a corrosion problem. It also decreases the amount of hydraulic pressure, which works with gravity to move sewage towards the treatment plant. 

In fact, the less hydraulic pressure you have, the more energy you need to apply (e.g. sewage lifting stations) to push the effluent along. We have so much excess capacity in our existing sewage mains, it's costing us more energy to pump it to the treatment facilities.  

You also need to spend more unclogging pipes. We sometimes have to put fresh water into the sewage mains to reduce the residence times, clear clogs, and provide hydraulic pressure. 

We'll save the problem of declining flows on drinking water systems for another day. Spoiler, it's cheaper and safer for everyone if we concentrate new residents in existing areas rather than build new sprawl. 

Bonus Sewer Content:


* C&EN News = Chemical and Engineering News is the monthly general interest magazine for members of the American Chemical Society. Bad Dad and I both hold BSs in Chemistry and he also has a PhD in Chemistry (while I hold a PhD in Chemical Physics). Although our work is far from what most people consider chemistry, we still enjoy learning about happenings in the Chemistry world and the policy implications and societal impacts of Chemistry. Editorial leadership of C&EN News eliminated coverage of science policy and societal impacts. Sign the petition if you disagree

Thursday, December 08, 2022

Urban trees and the zombie carbon sequestration myth

Last summer, my city passed a tree protection ordinance that fines people for removing trees--even those on private property in side or back yards (where they don't shade public sidewalks or road asphalt). It was sent for legal review and will come back on December 20, 2022 for final passage. 

I'm not a lawyer, but I will say as a scientist that it is claptrap. 

So much nonsense was spewed that would fly under the radar of people not in the trenches of housing policy. I suspect that using the need for street trees to push through a more expansive policy is designed to make infill housing (eg ADUs*enabled by SB 9) harder or more prohibitively expensive to build. 

But, I want to push back on the pernicious myth that carbon sequestration through urban trees is better than building infill housing. 

Let's do the math!

A mature urban tree can absorb about 20 kg of CO2 per year. MIT Climate Issues rounded that to about 50 pounds. (Click through to read how they debunk some of the 'nature-based solutions' talking points.)

The EPA, US Environmental Protection Agency, reports that the Greenhouse Gas Emissions from a Typical Passenger Vehicle is 8,887 grams CO2/gallon or 404 grams CO2/mile using the US passenger car fleet average. 

The largest employers in my city are Northrop Grumman (next to a light rail station) and our local school district (dispersed around the city, not served well by transit).  Since school teachers cannot afford the median house price of $1,587,500 

or even the median condo price of $1,007,000

teachers drive in from elsewhere. The only places in LA County actively building new apartments and condos in substantial numbers is Downtown LA (DTLA) or Old Town Pasadena. 

If they want to buy an older single family home, like this one that sold yesterday in Whittier for $630,000, they also face a long commute. 

The Whittier house is 27-29 miles to Redondo Union High School depending on the route. Old Town Pasadena is 30 miles each way. 

A round-trip commute for just one of the hundreds of teachers in our city that cannot afford to live here is about 60 miles/school day. 

60 mi/day * 404 g/mi = 24,240 g/day = 24.24 kg/day

It would take a mature tree more than a year to sequester the carbon emissions of just one day's commute for a teacher commuting in from where they can find housing that they can afford.  

I looked up more data. 

California requires 180 school days/year. There are a few additional teacher prep and in-service education days, but let's use the lower 180 number. 

I looked up the RBUSD budget and see that there are 463.80 Full-Time Equivalent (FTE) teachers in the district. 

24.24 kg/day * 180 days * 463.8 teachers = 2,023,652 kg/year 

That would require 100,000 trees just for in-bound commuting teachers

That's just a few hundred of the 25,000+ jobs in Redondo Beach according to the research arm of Southern California Association of Governments (our regional housing and transportation governing body). 


I can't ensure that all infill homes will go to teachers in the community. 

I do know that teachers have to live somewhere, so they need homes. It would be great if they could live close enough to participate outside of school in the communities where they teach, and if they didn't need to drive a car to work.

The benefits of workforce housing:

  • Planet (fewer climate-wrecking CO2 emission)
  • Community (the teacher can be more present)
  • Public health (fewer car miles = less air/water pollution)
  • Teacher health (long driving commutes have well-documented detrimental health impacts)

Now substitute teacher for any other job in our city. This includes store clerks and caregivers to the elderly or young children that make just above minimum wage. They take care of us. We need to take care of them. We won't be able to build enough ADUs to fill the need. But, we can build enough apartments and condos, in a thoughtful way, to reduce the need for climate-destroying and space-gobbling automobiles. 

Asides: 

ADU = Accessory Dwelling Units or Granny Flats or In-Laws' units. ADUs generate a little extra density in single-family neighborhoods, create homes without generating much external impact. In fact, when used to house caregivers or those needing care, or local essential workers, they reduce car traffic or Vehicle Miles Traveled (VMT) overall.

Keeping low-density existing homes is NOT better than replacing them with higher density housing, even accounting for embodied carbon. But, I'll cover that myth in another post. 

I hear lots of chatter about preserving or increasing urban tree canopy in order to combat the urban heat island effect. That's a good idea. I'm all for trees. In fact, we bid aggressively on both our home purchases because they had more trees compared to other homes in our budget/area. More on that later. 

Redondo Beach has no native trees. It was a coastal prairie according to UCLA's Urban Wildlands Group (Dept of Geography). I'm stuck wondering what proponents are calling "Heritage Trees". 


Tuesday, August 23, 2022

eBikes vs Direct Air Capture

Following up on my previous post about the relative carbon intensity of eBiking vs driving. and another post about utility cycling around town...

I read that the Denver eBike Voucher program has already put 2,100 eBikes on the streets. I did a little back of the envelope math. 

Suppose each of those bikes replace 3,000 mi/year of automobile travel in gasoline vehicles that get 20 mpg in the city. Then they collectively avoid almost 3 Million kg of CO2/yr or 3,000 mT (metric tons).

3,000 mi/yr * .444 kgCO2/mi * 2,100 eBikes = 2,797,200 kgCO2/year 

Further suppose that the eBike riders are using 10 Wh/mi or .01 kWh/mi (calculation from Utility Cycling). Collectively, they are using 63 MWh/yr.

3,000 mi/yr * .01 kWh/mi * 2,100 eBikes = 63,000 kWh/yr = 63 MWh/yr

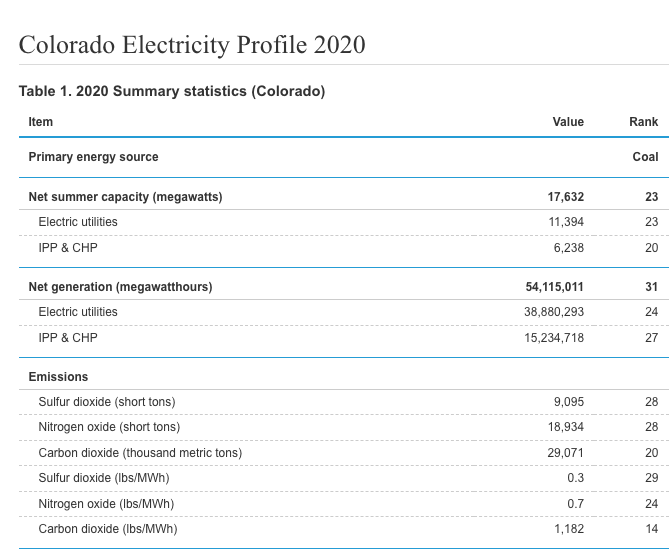
The electricity comes from the grid, and Colorado's grid has a CO2 intensity of 537 kgCO2/MWh. We need to subtract that from the CO2 savings. 


537 kgCO2/MWh * 63 MWh/yr = 33,831 kgCO2/yr

Unleashing 2,100 eBikes being ridden instead of cars for ~8 mi/day (short, local trips), makes 2,763.4 mTCO2 disappear every year. 

2,797,200 - 33,831 = 2,763,369 kgCO2/yr = 2,763.4 mTCO2/yr of avoided CO2 emissions per year. 

As the Colorado grid becomes cleaner, the CO2 savings grow.

There are many ways to make CO2 disappear from the atmosphere and they all have issues. People love nature-based solutions, but we're emitting too fast for them to be effective. If it's sequestered in a tree, then a fire can release all the carbon back into the atmosphere. If it's sequestered in soil, and someone comes and plows it up, some of it is released again. Trapping CO2 in the ocean, e.g. with kelp, is very inefficient and will only take a nibble out of current emissions. 

There are a couple of high-tech solutions, Carbon Capture and Sequestration (CCS) and Direct Air Capture (DAC). CCS can only be done at the source, like in the outflow of a power plant. CO2 is concentrated right at the source, but removing it costs 30-40% of the energy you just produced in burning stuff at the power plant. 

But, CCS is viable (as long as you have a place to sequester the CO2 forever), and the people who produce the CO2 pay for removal of the CO2. That makes accounting easier. Those who pollute, pay. 

But all of us are out there, driving cars, flying in airplanes and getting stuff delivered in trucks.  We're not going to carry around a CCS plant in our vehicles.  So we emit CO2 into the atmosphere where it gets well-mixed.  

Remember thermodynamics class in college? The more disordered a system, the more energy it takes to bring order to it?  DAC is enormously expensive and energy-intensive compared to CCS, which is already expensive and energy-intensive. 

No wonder people question whether DAC is a good use of money vs not emitting so much CO2 in the first place. I think those people are right, it's a waste of money. 

However, we've emitted so much CO2, that we painted ourselves into a corner. We don't want to pay for DAC, but we have to do it anyway. Did I mention that it's enormously expensive and only the government has that amount of money to spend? 

DOE announced it will spend $3.5 Billion to build 4 DAC plants. That won't even cover the full cost of building them or include the cost of running them. 

Meanwhile, a single bike lane installed in Thailand in 2015 has removed $1 Billion worth of DAC CO2 removal in avoided vehicle trips. And they use smaller vehicles like motorcycles in Thailand. Click through the read the very detailed journal article! It takes a while to load, but the full article is available for free. 

It sucks that individuals emit CO2, and the richest emit the most, but we don't price carbon so we socialize the cost of building DAC plants to clean up after the rich. Yes, we will all end up paying for Kylie's 2 minute private jet jaunts around Los Angeles. Removing the CO2 she dumped may end up costing the public more than it cost her to take the flight.

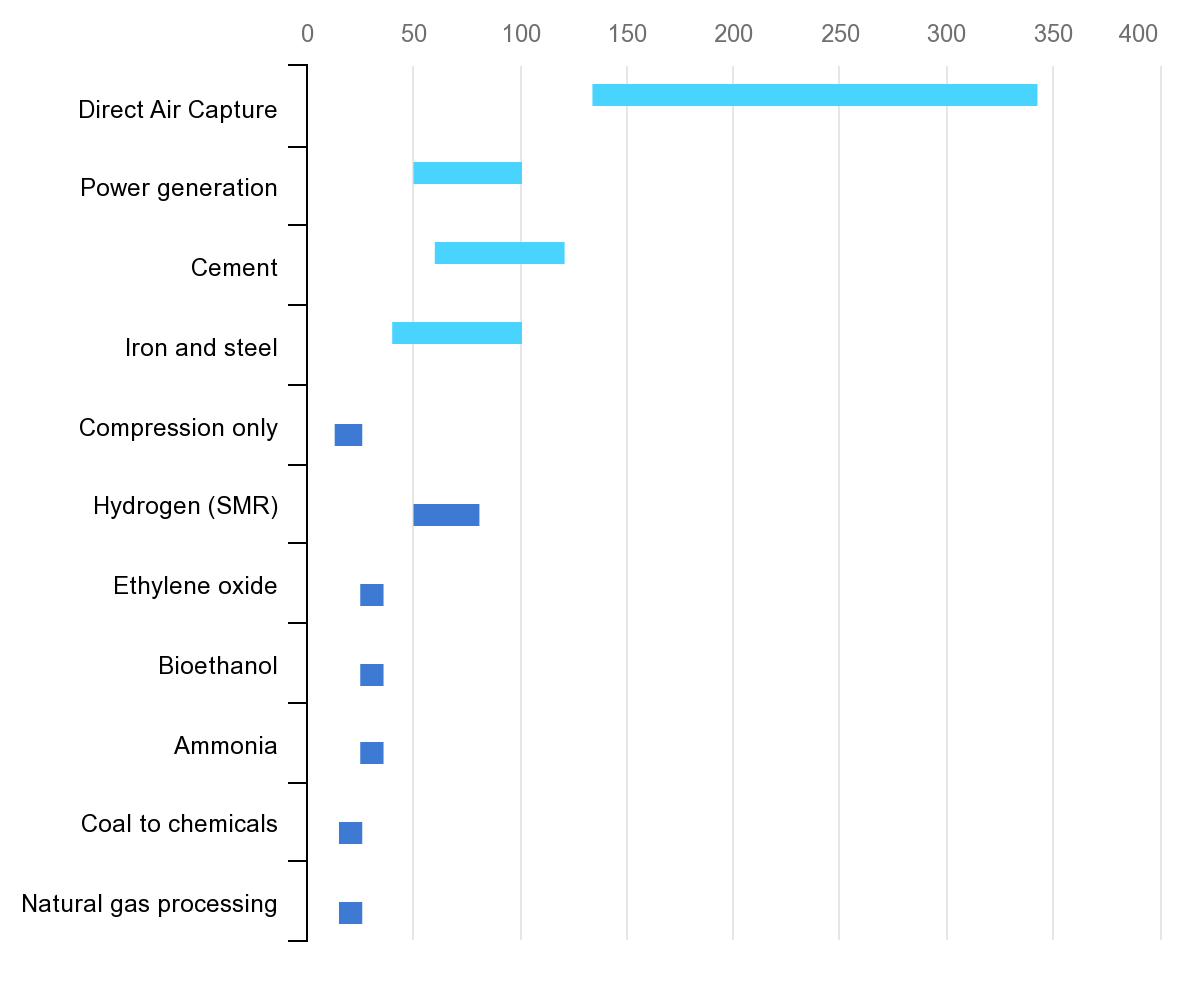
The Energy Information Agency (a part of the US Dept of Energy, DOE) estimates that Direct Air Capture (DAC) to pull that much existing CO2 out of the atmosphere costs about $250/mTCO2, not counting the cost of putting it someplace. Let's just use $300/mTCO2 for our calculations*. 

The value of not driving 2,100 vehicles 3,000 mi around the city is worth ~$830,000/yr in DAC CO2 removal.

2,763.4 mTCO2/yr * $300/mTCO2 = $829,011 

Suppose they gave a rebate of $400 for each bike, then Denver spent $840,000 in vouchers. 

But, the vouchers can only be spent in local shops, which generate sales tax. By the time you add that in, the two numbers are roughly equal.  

But the eBikes keep rolling, year after year (my eBike is 5 years old), avoiding CO2 emissions while you have to keep using huge amounts of energy pulling CO2 out of the atmosphere and throwing lots of $ at DAC year after year.   Avoiding CO2 emissions by swapping eBikes for cars looks like a pretty good deal. 

Anyway, Denver gave out vouchers of $400 ($1,200 for low income) and an additional $500 for more expensive cargo bikes capable of carrying passengers or lots of cargo. They also targeted delivery workers, who put in a lot of miles. 

It may take more than a year for the avoided cost of CO2 to pay for the vouchers. But, it has other benefits of reducing traffic congestion, air pollution and improving public health. It's a very cost-effective program and we should scale it up and replicate it. 

Which brings us to the California Air Resources Board (CARB) meeting on Wednesday, August 24, at 3:30 PDT. Click on the link to register for the Zoom meeting.
The California Air Resources Board (CARB or Board) invites you to participate in a work group meeting to discuss the Electric Bicycle Incentives Project. We invite all stakeholders to attend and provide their input and feedback on program design. The meeting agenda and any handouts will be posted to the Low Carbon Transportation Investments and Air Quality Improvement Program website ahead of the meeting.
California set aside $10 Million for eBike rebates/vouchers, but has yet to select a vendor or even an implementation program (despite promising a roll-out in July 1, 2022). So attend the meeting tomorrow and tell them to quit studying equity and just do something. They can refine the system later as they study the outcomes. 

If you want, cite the economic efficiency of avoided CO2 emissions versus future DAC. 

I'll get you started with the math. 


If each bike displaces 3,000 vehicle miles/yr at .444 kg/mi = 1,332 kgCO2/yr. 

But they will use 30 kWh = .03 MWh/yr of electricity

.03 MWh/yr * 225 kgCO2/MWh = 6.75 kgCO2/yr

That's 1,332 kgCO2/yr - 6.75 kgCO2/yr = 1,325.25 kgCO2/yr

A metric ton is 1,000 kg so each eBike results in 1.325 mTCO2/yr in avoided emissions, worth $398/yr.

* Estimates of the cost of DAC are about as real as the Hyperloop because we have so little real data.  The International Energy Agency report on DAC:
There are currently 19 direct air capture (DAC) plants operating worldwide, capturing more than 0.01 Mt CO2/year, and a 1Mt CO2/year capture plant is in advanced development in the United States.
So all the DAC plants currently in existence can pull 0.01 Million metric tons (1,000 kg) CO2 out of the atmosphere. That's 10,000 mT. The modest Denver program avoids almost 3,000 mT/year of emissions. I would say that the Denver eBike subsidy is the most successful existing CO2 removal program in the US. 

No wonder countries around the world are increasing their eBike subsidies.