I wrote an LA Voter newsletter (for members of League of Women Voters in Los Angeles County) article about Motonormativity and the way that local, state and federal governments reinforce it with their laws and actions.
Past WIG speaker and public health researcher Isabella Chu, MPH, also spoke about the hidden public health hazard that is the top killer of US children. Indirectly, through air pollution and involuntary inactivity by making active transportation (walking, cycling) dangerous, cars may be the top killer of people in the developed world of all ages.
Transportation, mainly private automobile use, is the largest contributor of CO2 emissions in Los Angeles County and the largest source of PM2.5 pollution (except in the occasional years when particulates from wildfire smoke affects populated areas of LACO.)
Yet, all this is invisible to most people and especially law and policy makers. In California, it is legal to kill with a car as long as you were not intoxicated, were not speeding, and stayed at the scene of the death. This applies even if a driver kills a cyclist in a crosswalk.
ILO wrote a letter to Metro’s Board of Directors for omitting protected bike lanes on the Vermont Ave BRT (Bus Rapid Transit) project plans. The City of LA’s Mobility Plan 2035 (adopted in 2014) promised to address identified shortcomings by 2035 by implementing the plan as each section of the roadways had work done. The Mobility Plan showed Vermont Ave would receive both a protected bike lane and a bus priority lane.
Local actions are even more important as we can no longer count on the Feds to help us. Under the Reagan Administration, Federal transportation dollars were allocated in a rigid formula of 80% to highways and 20% to transit.
The Secretary of the Department of Transportation is Reality TV and Fox Business personality, Sean Duffy. He made headlines recently when he rode the NYC subway with NYC mayor Eric Adams and subsequently told Laura Ingraham on Fox News that "even big men don't want to ride the subway."
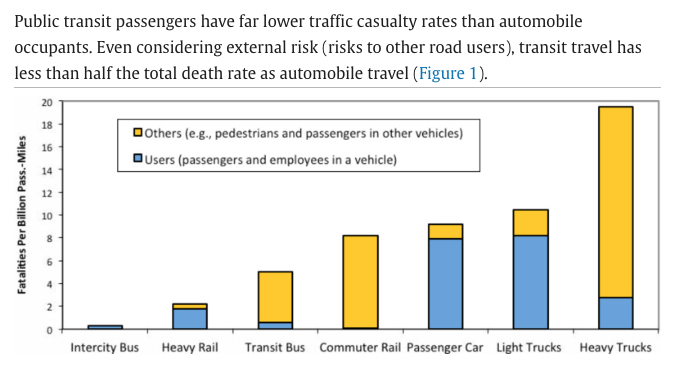
“Most transit trips include active transport (walking and/or cycling) links, and transit users tend to walk and bike more in total than motorists (Lachapelle et al. 2011). These modes have relatively high per-mile casualty rates, although this risk is largely offset by reduced risks to other travelers and improved public fitness and health, so per capita crashes tend to decline and overall health and longevity increase with more active travel in a community (Rojas-Rueda et al. 2011).”
Transit is so safe that a 1% increase in transit mode share would result in a 2.75% reduction in road deaths.
State lawmakers show similar characteristics of motonormativity. Until September 6, 2023, Californians could purchase EVs (electric cars) secure in the knowledge that they would receive guaranteed rebates of up to $7,500 for each EV, and that these would stack on top of Federal rebates of $7,500. The income cap was $200,000 for joint filers. California passed out over $1 Billion in EV rebates.
Contrast that with the California eBike incentive, which has an income cap of $61,320 for a family of 2, and which exhausted the entire $10 Million allocated to eBikes within minutes. eBikes received only 1% as much money as EVs, despite global research showing that dual-mode households drove 19% less than before they obtained an eBike.
“Transportation is a climate and feminist issue. CA DMV data shows that women will spend twice as many years aged out of driving as men. Yet, our cities have not built infrastructure for people who don’t drive.
…
Car dependency is not just ruinously expensive, but it’s destroying the planet, and preventing nondrivers from fully participating in society. Women, as primary caregivers, are paying the time tax of chauffeuring people around. Protected bike lanes are mobility lanes, suitable for children on bicycles and seniors on mobility scooters alike.
Local government decisions have kept us isolated and stressed.”
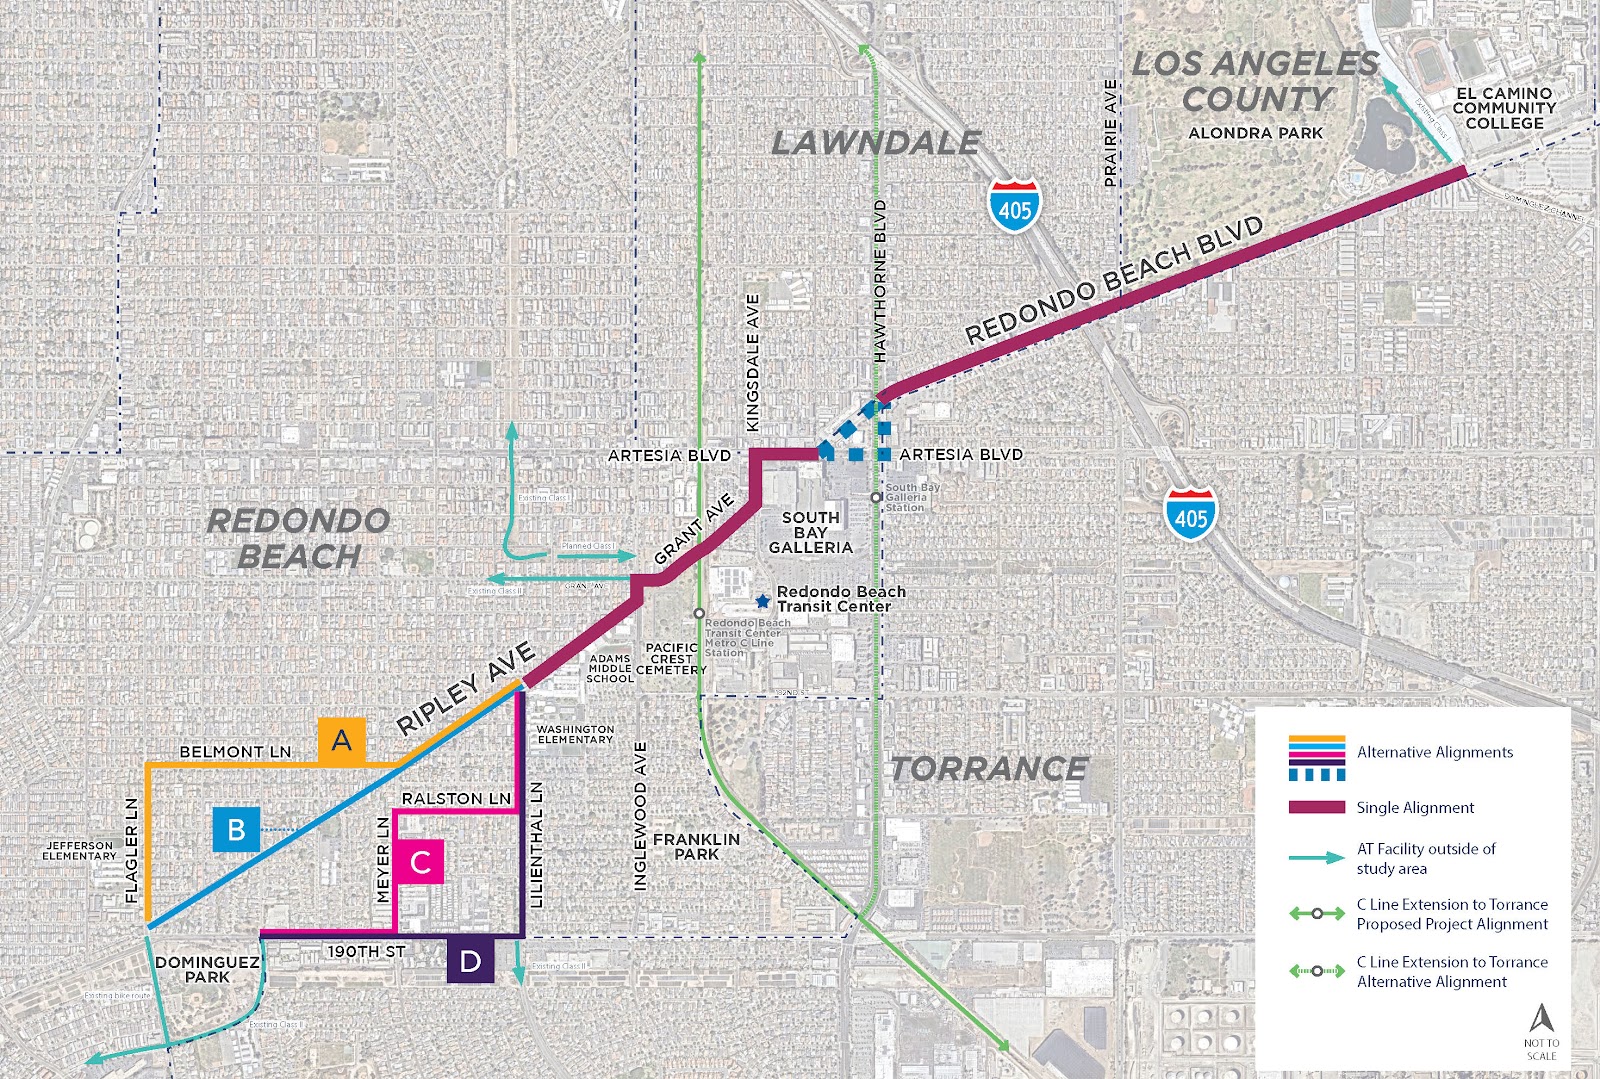
I need you to fill out a public input survey about a vital active transportation project for Redondo Beach and surrounding cities in the South Bay region of Los Angeles County. This is our chance to reverse some of the damage wrought by past auto-centric road design in North Redondo Beach and allow those who can ride a bike to make school and shopping trips with confidence that they can make it home alive and in one piece.
The current street allocation with car parking on both sides and massive SUVs speeding down our streets is not safe or welcoming for cyclists. The proof is in the declining bicycle mode share.
When filling out the survey, select the options that give a protected bike lane every time. Scroll down past the background info to see my recommendations and why.
Paint is not protection. Never select an option with a paint-only bike lane in the door zone. If someone opens a door, a cyclist in the door zone will be knocked off their bike and suffer grievous injuries. If they swerve to avoid the door, or are knocked into the traffic lane, they could be killed. No one wants to be killed or have their child killed while riding to school.
Two-way cycle tracks are a good option, particularly near schools. When kids are arriving or leaving school, there will be a lot of traffic congestion on all modes. But cars are particularly dangerous. The less car traffic they cross while leaving the congested area, the safer they will be. Keep them on the school side of the street, with wide lanes so that there is passing room in the bikeway (keep the kids out of the car traffic lane).
Plastic poles are not physical protection, but likely the best we can get as a first step. Plastic poles can be replaced with bollards or concrete barriers later if we allow enough buffer space to install the plastic poles in the first place. Do not let the perfect get in the way of actions we can do right now.
You can skip the background (but I hope you read it when you have more time).
Background: The Connection with Schools
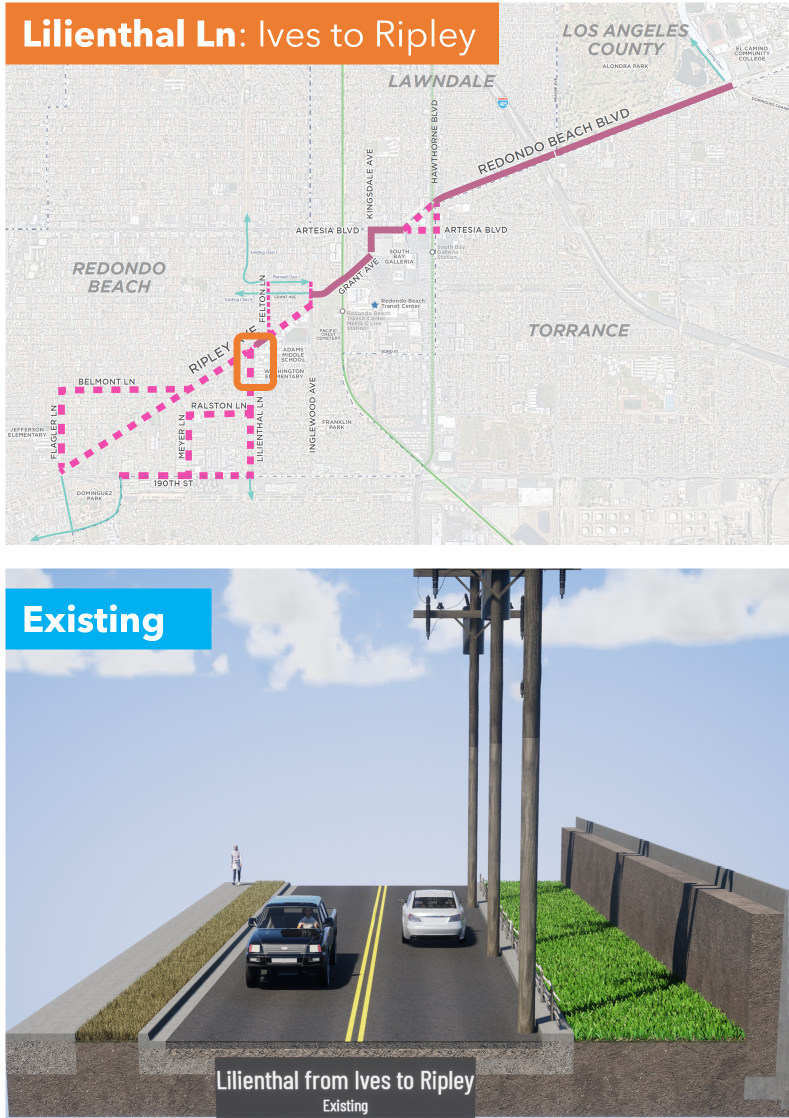
The project area below was originally going to be along the old freight route from Redondo King Harbor to the inland rail routes, but Ripley was found to be too steep (several areas with 15% grades) to be feasible for safe cycling.
A Redondo Beach traffic study determined that 30% of the city's AM/PM peak traffic is the child school run. This travel corridor includes
Adams Middle School: 1066 students: 6-8 grades
Washington Elementary School: 801 students, K-5
Jefferson Elementary School: 509 students, K-5
That's almost 2400 K-12 students arriving and departing each day on this corridor.
But that's not all, because all students in Redondo Beach Unified School District (RBUSD) attend Redondo Union High School (RUHS) in South Redondo Beach*. Jefferson ES students also attend Parras Middle School south of RUHS.
Assuming 350/grade at Adams MS and 90/grade at Jefferson ES,
350*4 + 90*7 = 2030 students cross 190th Street to attend school and return home each day.
About half of all RBUSD students traverse this corridor every school day.
But that's not all; El Camino College (ECC, 22,000 students, many from the Beach Cities) is on the eastern end of this travel corridor. Some RUHS and MCHS students do concurrent enrollment and take classes at ECC while they are in HS. Due to many factors, including cost and lack of housing at UC campuses, a large number of students are enrolling in grades 13/14 at ECC before transferring to a 4-year college/university.
When filling out the survey, think about what you would send your kid to school on. Think about what you would be comfortable riding on as you accompany your younger child to school or run your errands. I ride this area 1-2x/week to run errands in North RB or West Torrance. I want better infrastructure for my safety, too.
Watch this video of the horrifying existing conditions as ridden by two fit MAMILs (Middle-Aged Men in Lycra). Would you ride these steep hills? Next to fast-moving busy traffic?
Here's another video of the area where Kyle, an area father, rides his kids to preschool.
My opinionated guide for the survey choices and why they matter:
Every cross-section shown is facing either Eastbound or Northbound.
Q1: For the westernmost portion of the corridor, which alignment(s) do you prefer?
I picked D because that would give us a 2-way cycle track on Lilienthal and the longest length of protected bike lanes on 190th. 190th St is also the only way to avoid steep hills.
The problem with B: The first video shows just how steep Ripley is. Notice that the lead cyclist on a light road bike has trouble getting up the hill (and the trailing cyclist with the camera is on an eBike). Going up a 15-16% grade is difficult, but going down them is downright dangerous. Do not send kids on this route.
Q2: The proposed street section for 190th St (Alignments C and D) is shown here. How satisfied are you with this proposal?
I picked Very Dissatisfied: These cross-sections are looking towards the east, with Torrance on the Right Hand Side (RHS) and Redondo Beach on the LHS. Cars are coming down the hill from Flagler and often speeding 50 eastbound mph. People drive with the sun in their eyes during the morning and evening commutes. Do you feel safe with just paint and plastic poles designed to bend when run over by vehicles?
I recognize that people living in the apartments in Torrance on the right need overflow parking, but let's swap the bike lane and parking lane. Install a parking-protected bike lane like this one in Long Beach on the Torrance side with breaks to preserve sight lines at each driveway or street crossing.
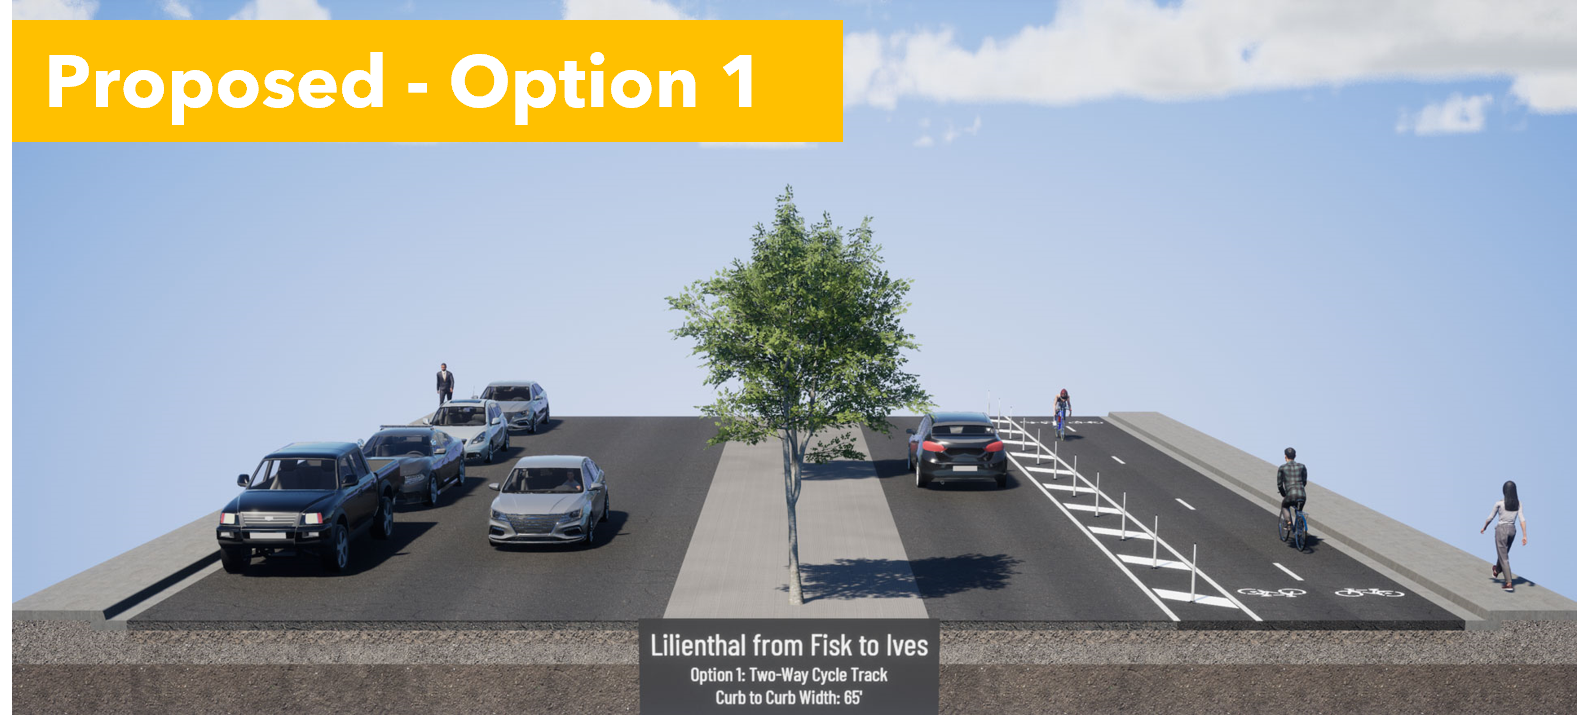
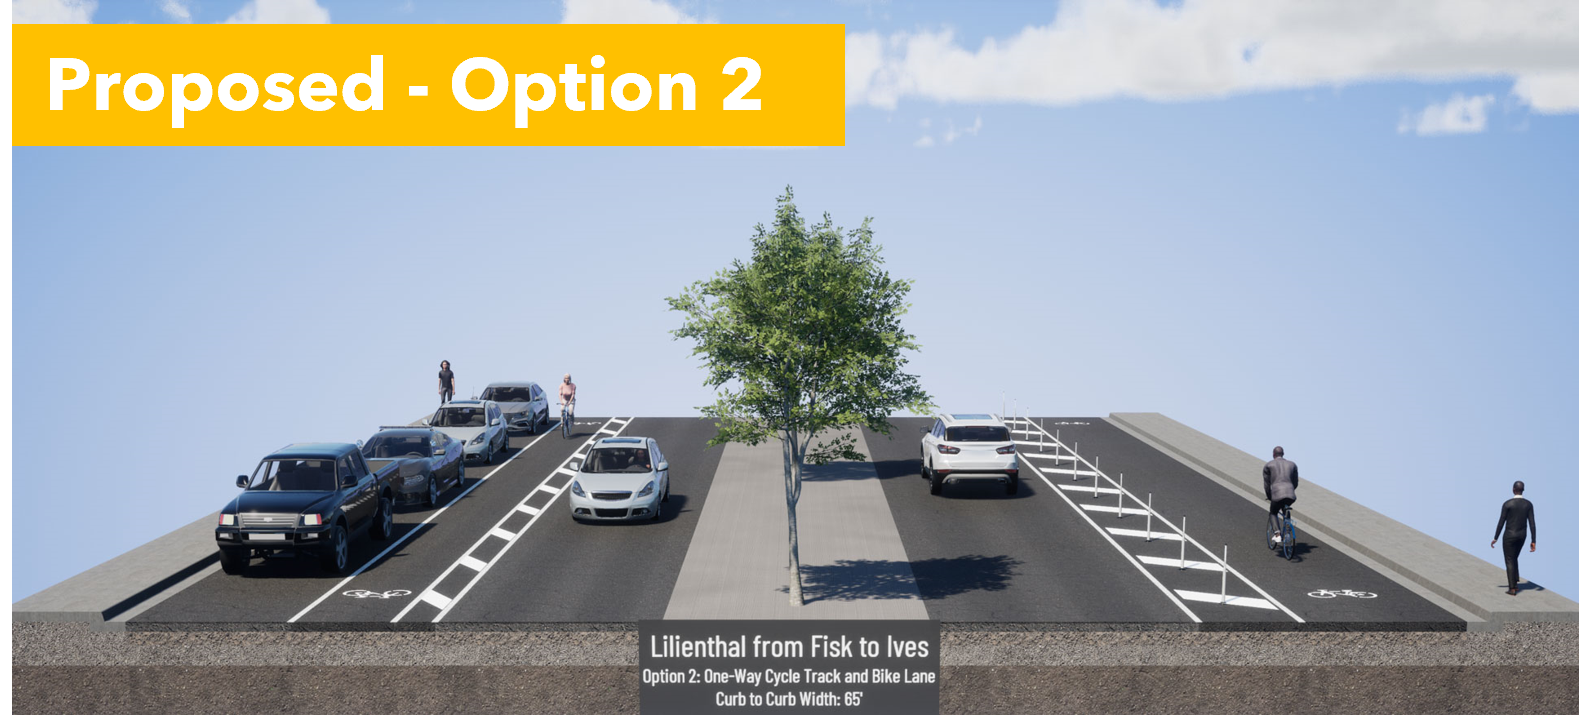
Q3: Select Option 1, the 2-way cycle track on the east side, next to Washington ES.
Option 1 provides separation from cars, and is wide enough for passing, and allows parents to ride side by side with a child gaining confidence in their bike skills. In 2-way cycle tracks, people riding opposing car traffic are facing approaching cars, so they can see and react to dangerous drivers. It would be better to have solid protection here, but Option 1 gives us room to retrofit with more solid barriers later.
Option 2 puts kids in the door zone on one side and makes them cross the street to get to school. It's a dangerous situation.
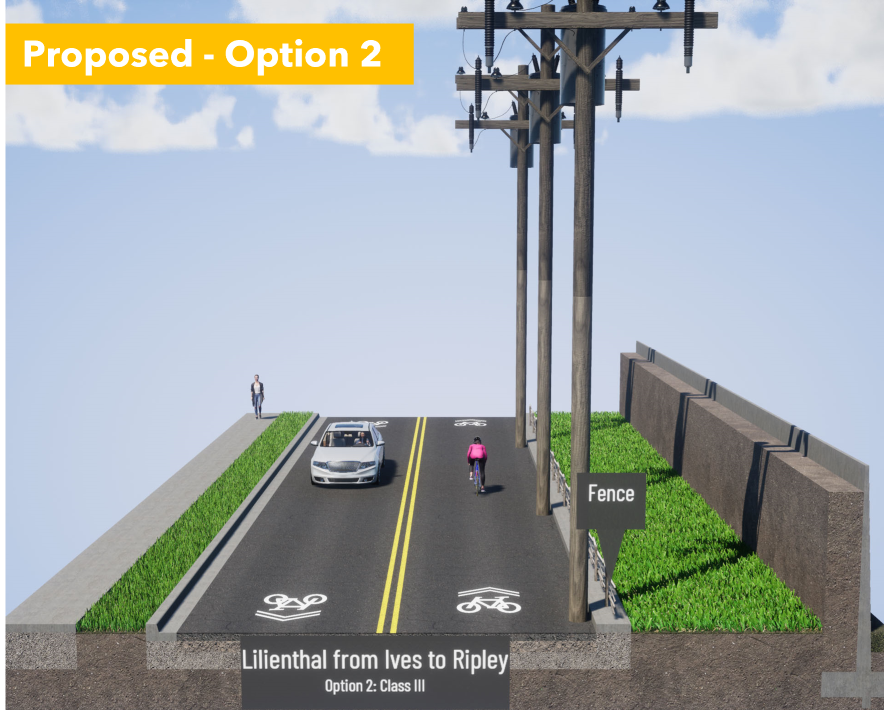
Q4: Select Option 1, the 2-way cycle track on the east side, next to Washington ES.
Don't be distracted by the stock visualization image with a tall solid wall. There is currently short solid wall on the parking lot side and a wood and rope fence on the road side.
Option 1 gives a clear place for kids to ride that is physically separated from cars. The 2-way cycle track would replace the wide grassy area.
Option 2 is sharrows in a place where drivers are more focused on making a turn at Ripley than cyclists approaching from behind them.
Motorists trying to make a right turn will pull over to the right, trapping cyclists behind them. Small children on bikes and tall, boxy hoods on todays trucks and SUVs mean that parents may not be aware of cyclists in front of them. This has led to an epidemic of frontover crashes where drivers run over people in front of them because they can't see them over their hoods. Or, they look at their screens and forget that there are children in front of them.
Option 2, sharrows, is a safety disaster.
Q5 on Ripley: Pick Option 1, the 2-way cycle track on the Adams MS side
Option 1 keeps the kids on the school side as long as possible. It also preserves the car unloading curb space that people are currently using.
Option 2 puts kids in the door zone, at precisely the time that kids being driven to school are unloading. This is a safety disaster.
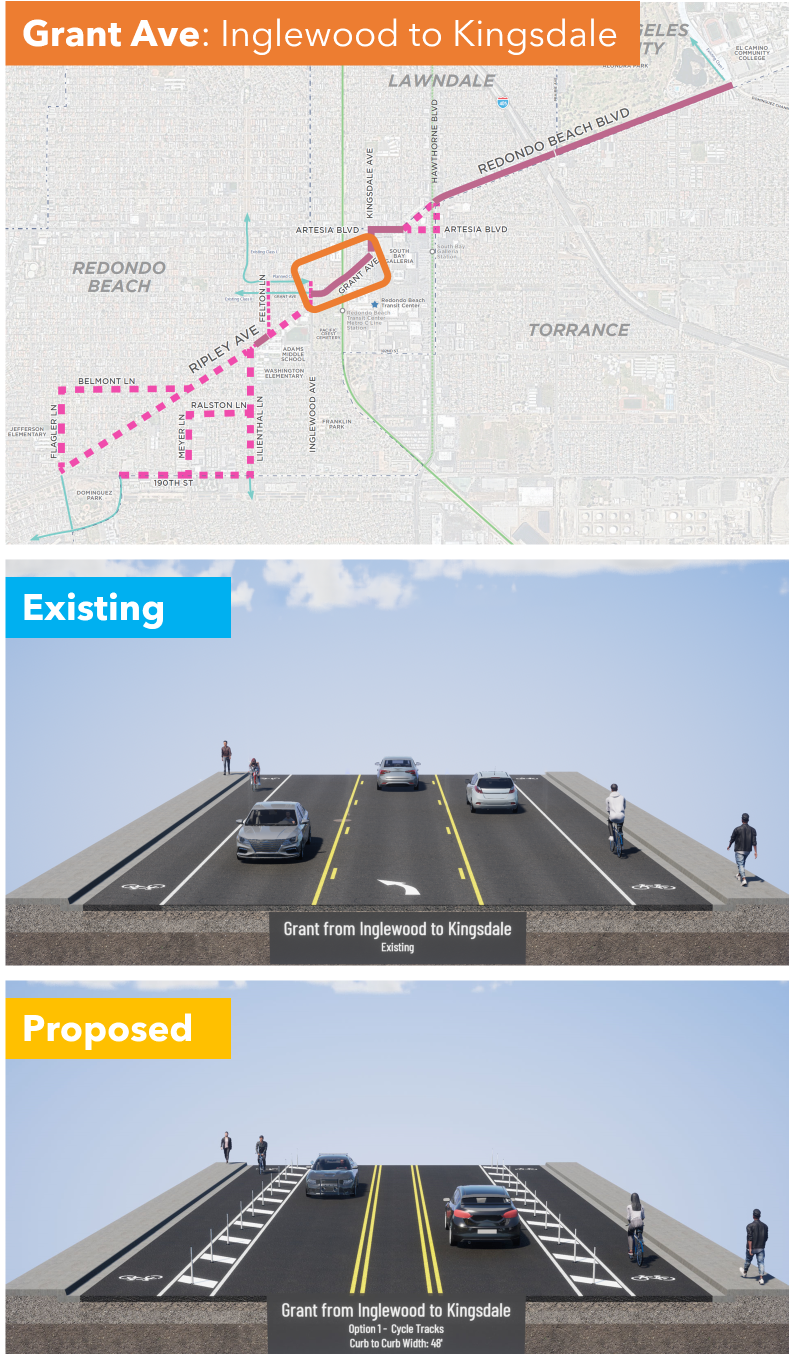
Q6: Grant Ave from Inglewood to Kingsdale; I am very dissatisfied but I selected other and explained why we need solid protection instead of plastic bendy poles
They are proposing paint, a buffered (space separation) and plastic bendy poles.
This is better than existing conditions, but not safe. Cars pick up speed heading downhill and frequently misjudge the curve, so they end up sideswiping cyclists in the bike lane. We really need a concrete barrier on the downhill (right hand) side.
I ride by bike to shop at the Galleria and this is the scariest part. I saw a guy almost get killed here. If we want more people to bike through this area, which connects to shopping, the South Bay Transit Center, and the 300 new homes under construction, then we deserve solid protection in this dangerous area.
I gotta break for lunch but I'm going to hit Publish on this so you can get started. I'll finish after lunch.
...
I'm back. Stay with me because we are on the home stretch, but the most dangerous one that crosses the 405 Freeway and has the most high-speed traffic.
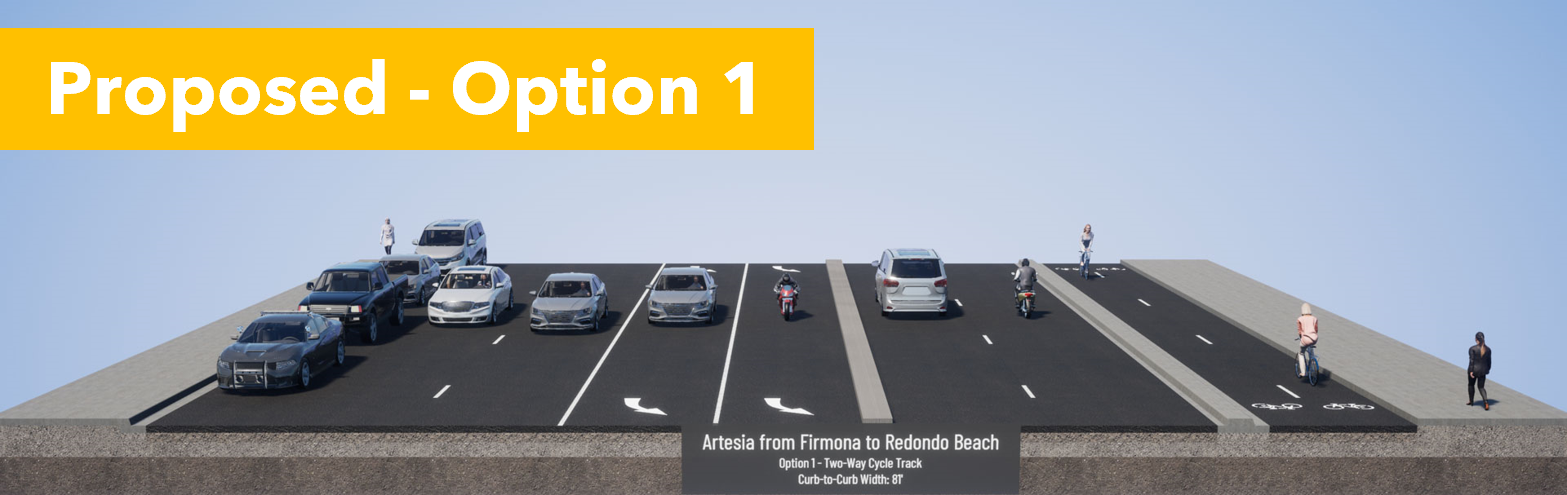
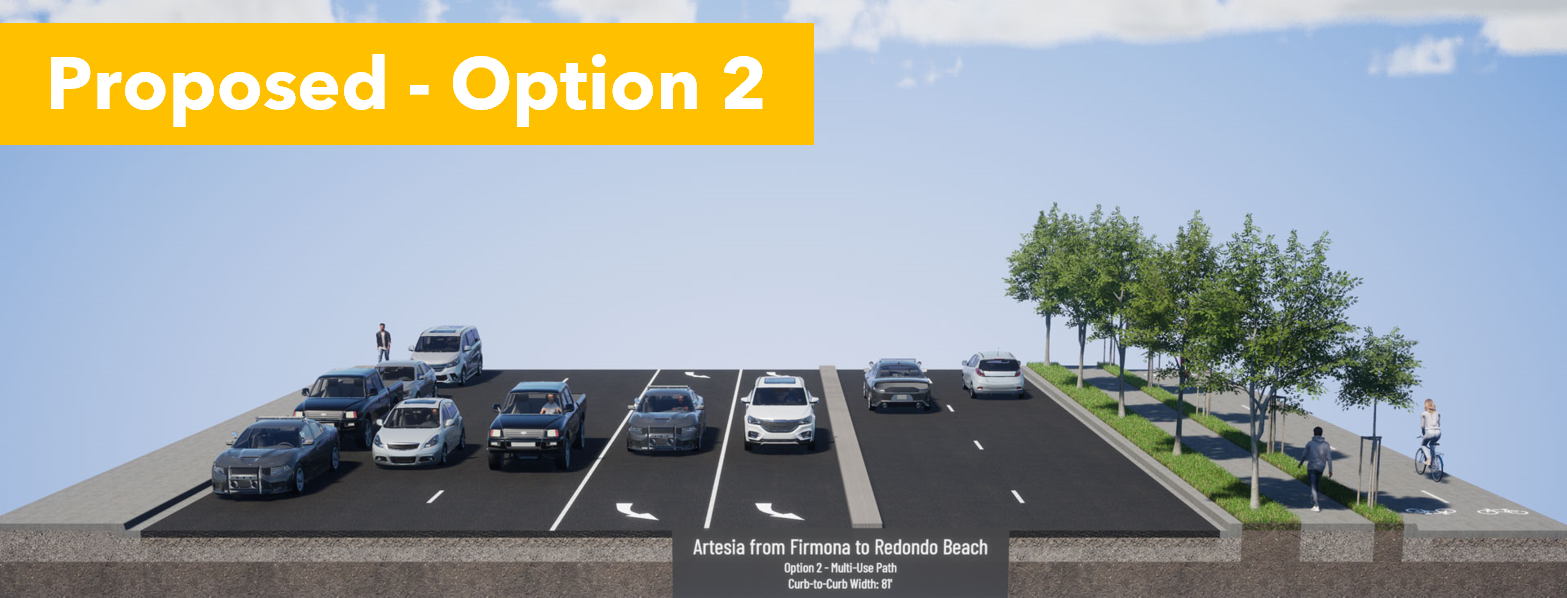
Q7: Artesia Blvd from Kingsdale Ave to Redondo Beach Blvd pick Option 2.
Existing conditions are awful and you see very few cyclists brave enough to ride here. If they do, they are often on the sidewalk, conflicting with pedestrians.
Option 1 puts cyclists next to vehicle lanes, but protected with a concrete curb. Pedestrians and cyclists would intuitively understand where they are supposed to be, as faster bike traffic is at the street level. However, this would interfere with bus stops.
Option 2 puts pedestrians next to the vehicle lanes, but also next to the bus stop. Trees would provide shade. There could be some confusion with pedestrians wandering on the bike path, but that can be solved with good signage.
Our community has experience with pedestrian and bikeways next to each other in the North Redondo Beach Bikeway (NRBB). While there is some spillover, people have already learned where pedestrians and rollers have priority on the NRBB. Option 2 will work best for us and we already know how to use it.
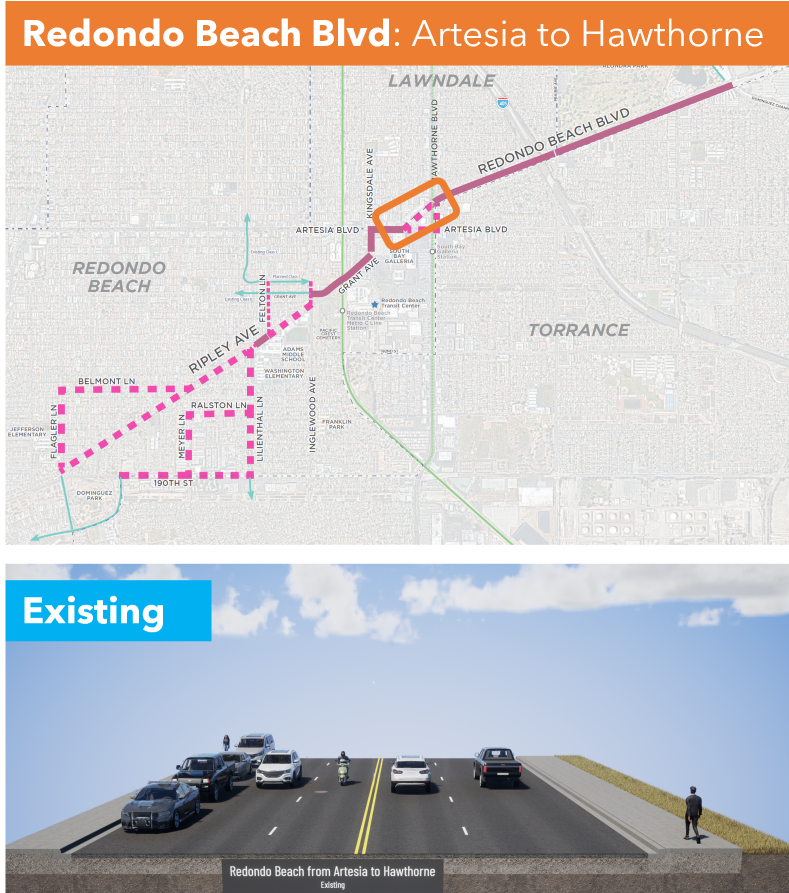
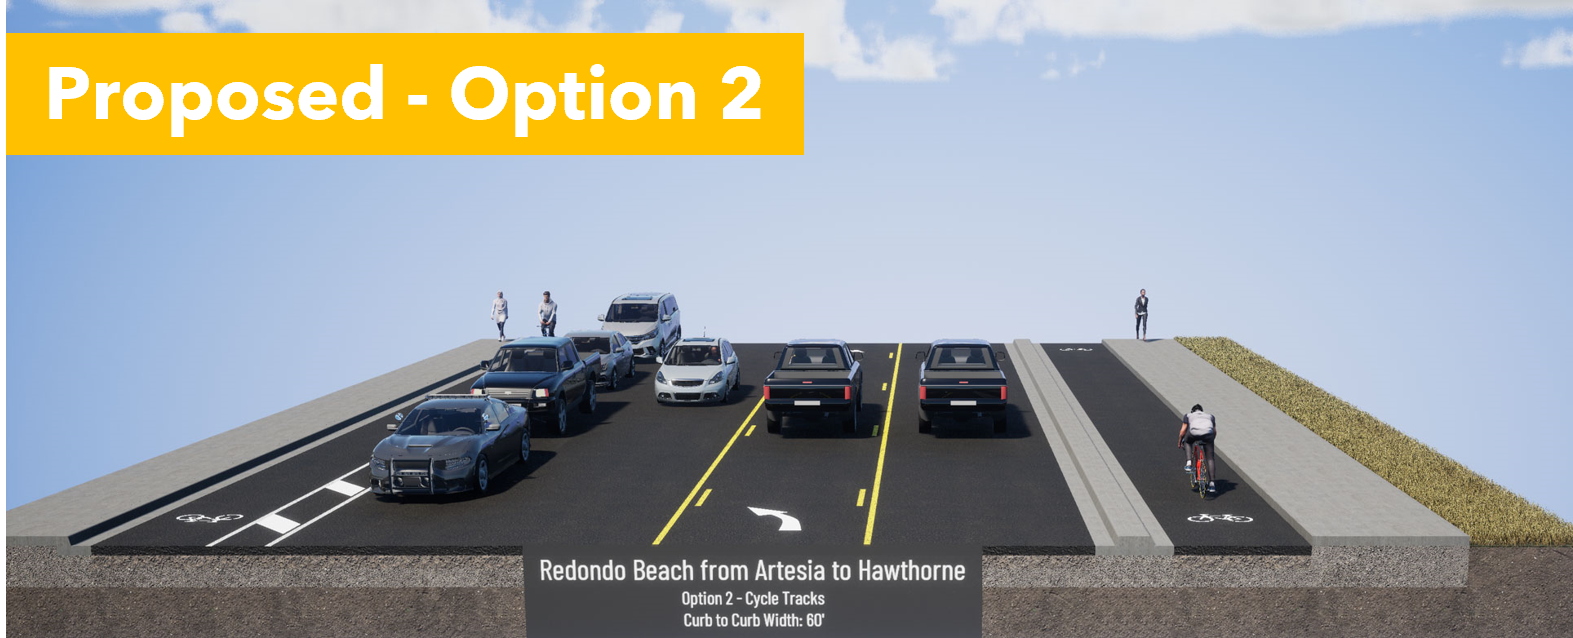
Q8: Redondo Beach Blvd from Artesia Blvd to Hawthorne Blvd. Is a tossup but both Options are so much better than the status quo.
Option 1 pits cyclists against pedestrians, but provides 2-way access to Walgreens and Starbucks. It's not terrible as long as cyclists slow down when passing pedestrians and motorists exiting the parking lots look both ways.
Option 2 provides a clear separation between motorists, cyclists and pedestrians. Cyclists are curb-protected on the eastbound RB side, and parking-protected on the westbound Lawndale side. However, coming westbound from Walgreens/Starbucks, people will likely bike on the sidewalk until they meet the 2-way cycle track.
Although you lose a traffic lane, it's not the cyclists' fault. One can just as easily blame the space allocated to free car storage (on-street parking) and a turn lane. Motorists are losing a travel lane to other motorists, not cyclists. Don't forget that.
Option 1, the 2-way cycle track, provides a better alternative not suggested by Metro for the next section.
Q9: Redondo Beach Blvd from Hawthorne Blvd to Prairie Ave. I am Very Dissatisfied & propose a better solution.
Although the status quo is very bad, we shouldn't rush into the proposed door zone bike lane next to high-speed traffic heading to the freeway onramps. It is extremely dangerous. This will greatly reduce the number of people brave enough to ride to Alondra Park and El Camino College.
If there is enough room for on-street parking, then there is enough room for a parking-protected bike lane. That may require narrowing the car lanes a bit, but that would also inhibit speeding, making that stretch safer and quieter for all road users.
The freeway onramp is on the north side of RB Blvd. A 2-way cycle track on the south side of RB Blvd would keep cyclists away from the crazy line of cars trying to merge onto the 405 on-ramp. Suggest that in Q11.
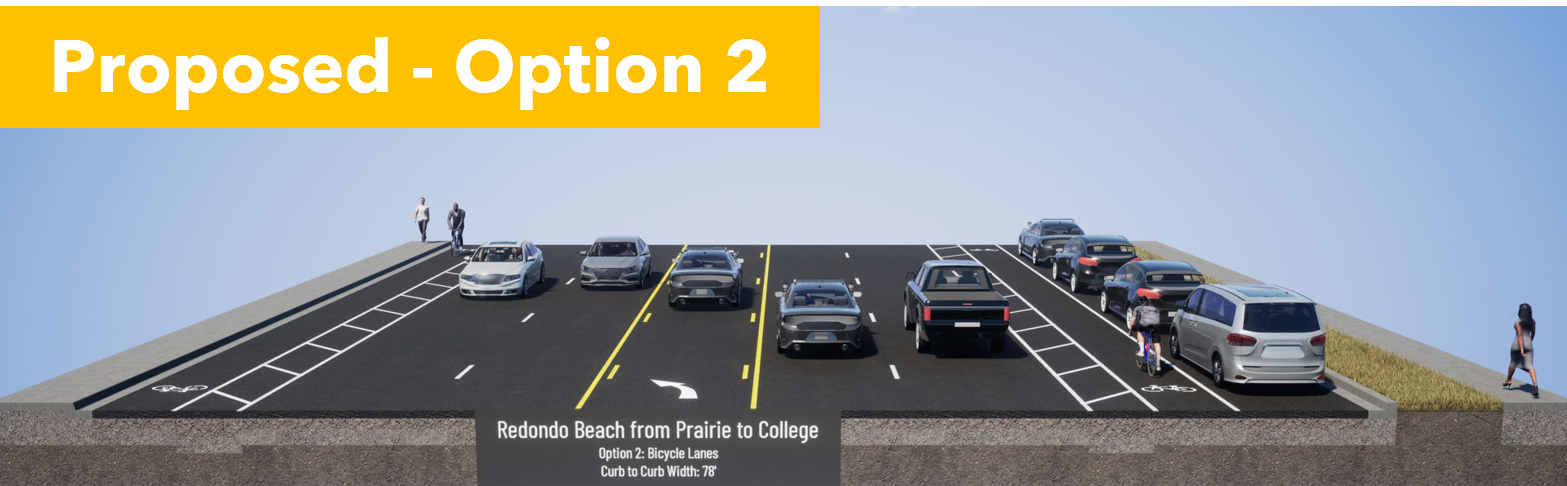
Q10: Redondo Beach Blvd from Prairie Ave to Dominguez Channel. Pick Option 1, the 2-way cycle track on the North side, next to the park and El Camino College.
Option 1 puts cyclists next to the park and ECC. Although it is shown with plastic bendy straws, it can easily be fitted with bollards or a concrete curb for better protection when cycling to and from evening classes at ECC.
Option 2 puts cyclists in the door zone, where they can be knocked into fast-moving traffic and killed. Drunk or malicious drivers can also harm cyclists easily with only "paint as protection".
Q11: Additional Comments: This is where we ask for a protected 2-way cycle track on on the south side of RB Blvd between Hawthorne and Prairie.
What do you need to be comfortable bicycling this corridor? Tell them!
Keep in mind that younger Beach Cities kids will probably only ride the western side of this corridor, west of Inglewood or Kingsdale. But older teens and young adults may need to ride to ECC or to retail jobs between Kingsdale and Crenshaw.
There are a lot of children and seniors in Lawndale and Torrance who would benefit from these bike facilities, whether they are riding a bike, trike or mobility scooter.
We should make this corridor welcoming for ages 8-80.
Think about who needs to travel through this corridor and at what times. What kind of cycling facilities do they need to get there comfortably and safely? What about seniors in mobility scooters or electric wheelchairs? Would you like to see food delivery robots in the bike lane or more food delivery by privately-owned cars?
With better bike facilities, I may choose to bike to stores further east than I currently feel safe. Every trip I make by eBike instead of car, I am "sparing the air", not taking up road space in front of you, and not competing with you for parking.
Another thing that excites me about this project is that it connects us to the Dominguez Channel. In a separate project, LA County Public Works will be extending the bike path along the channel southwards. It currently goes north to 120th St, past Amazon, Space-X, Lowe's and to the Metro Green/C Line. A southbound channel bike path would connect to the Harbor Gateway Transit Center, with very fast connections to the Silver/J Line to USC/Expo Park (15 min) and Downtown LA (20 min). Harbor Gateway TS is already linked up to CSU Dominguez Hills. This is a large step forward for a transportation transformation for the South Bay.
Bike lanes benefit you even if you don't ride a bike, but your neighbors do.
Bike lanes will save you time currently spent chauffeuring your kids short distances.
Bike lanes will benefit your kids because students who get exercise before school do better.
Bike lanes will benefit you when you age out of driving.
This bike corridor will touch the lives of half the students in RBUSD and can be transformative for the way our community gets around. If half of our households can shed just one car, we would be richer, our street parking and traffic congestion problems will evaporate, our air and water will be cleaner, and we will have done our part to slow climate change. Oh, we'll be fitter and happier, too.
* A very few students living in North RB attend Mira Costa HS in Manhattan Beach, but only if MBUSD will take them.
I've given a talk in December 2022 and am scheduled to talk again in January and February 2023 to groups comprised mainly of older homeowners concerned about lack of transit and wheelchair-accessible housing in their communities. Most are unaware that those are connected.
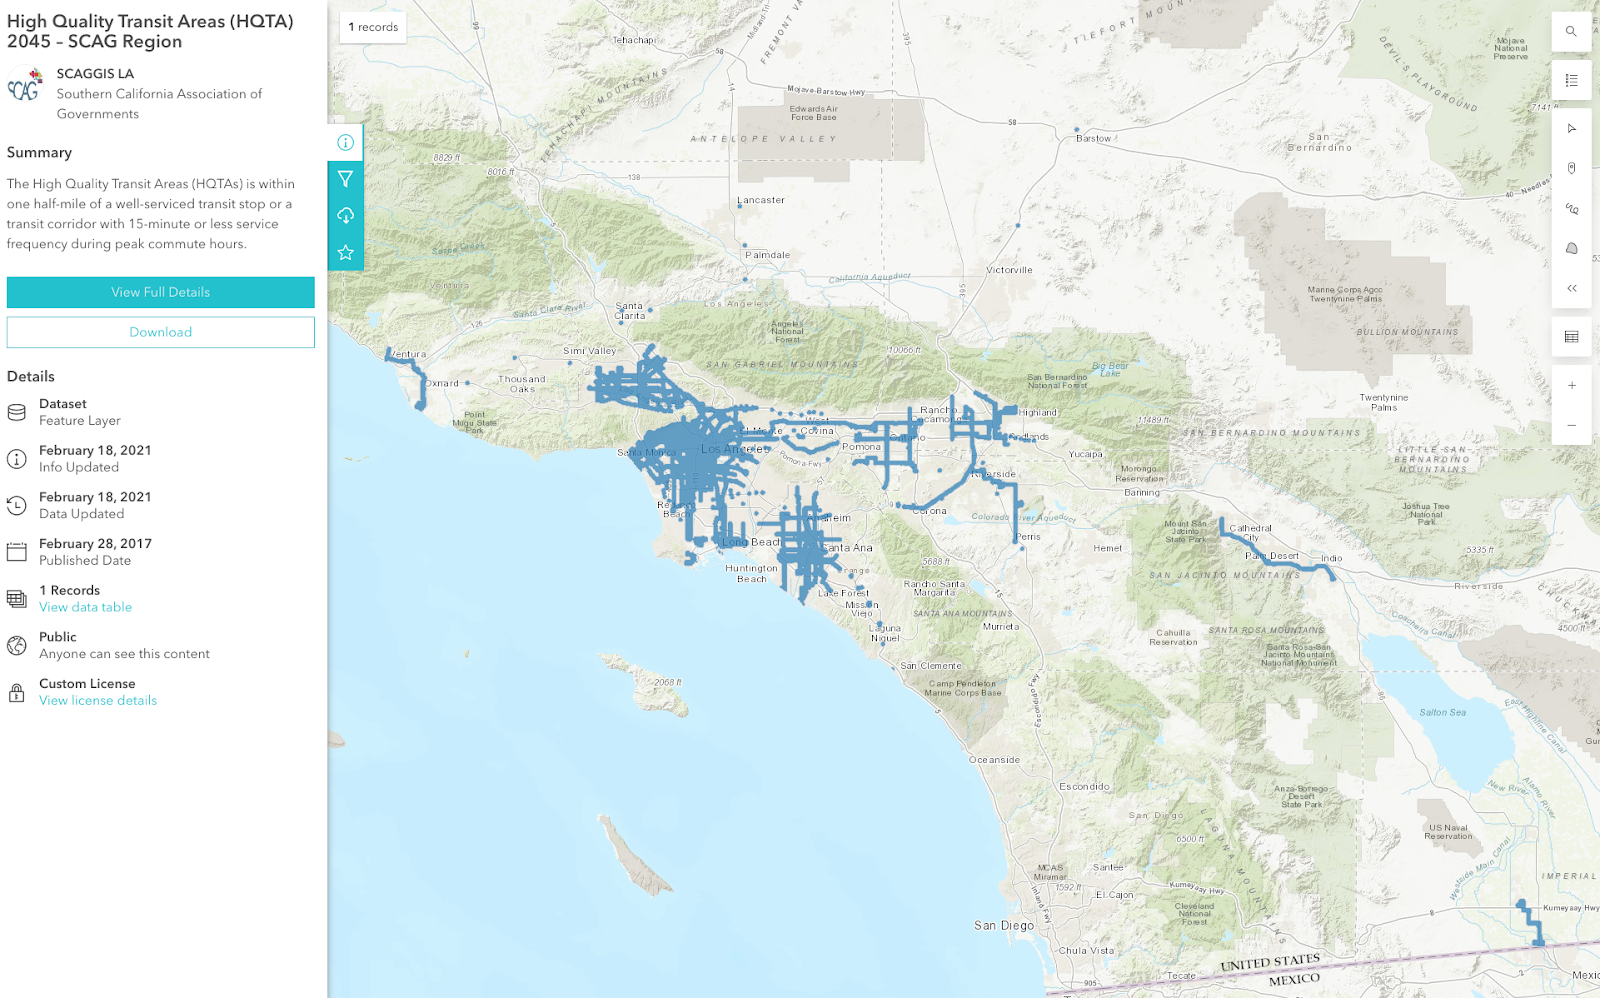
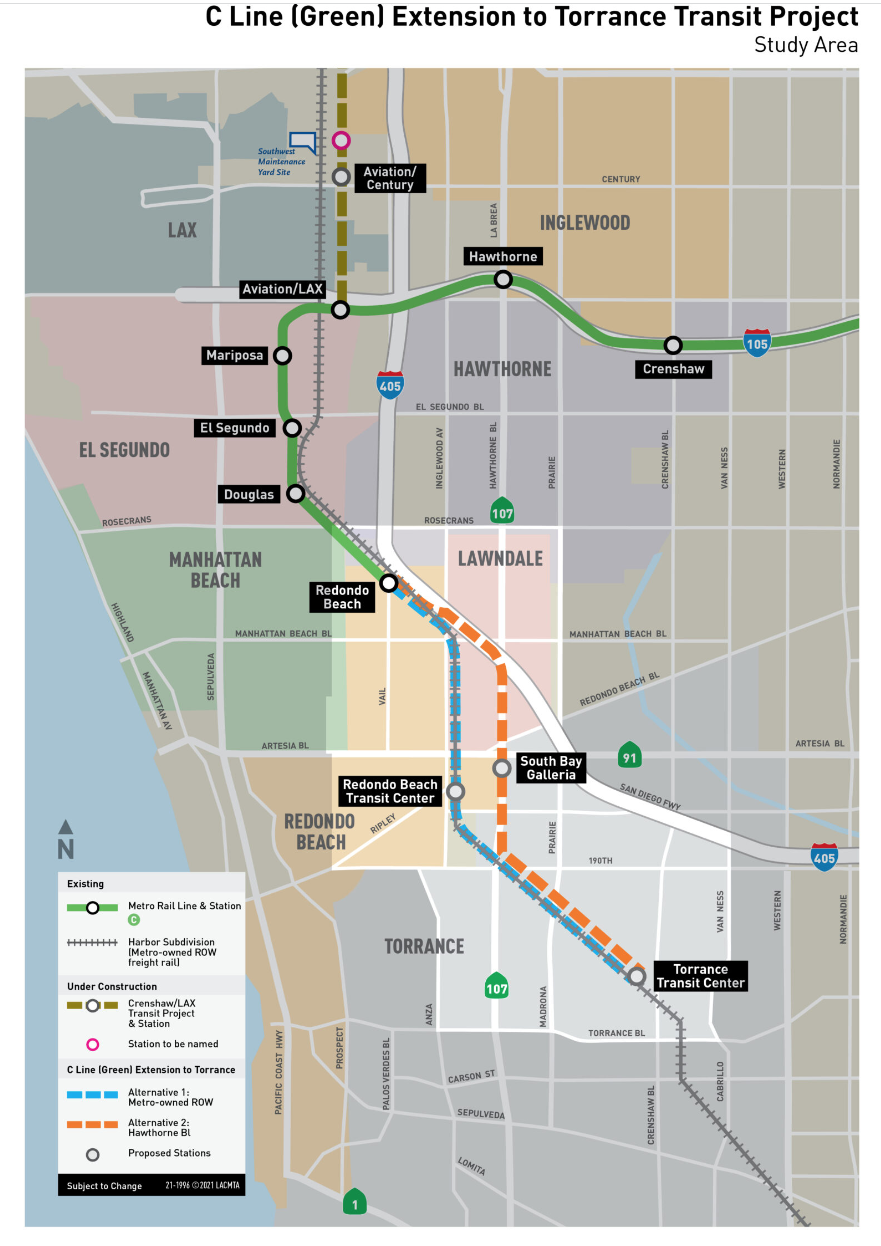
The High Quality Transit Areas (HQTAs) is within one half-mile of a well-serviced transit stop or a transit corridor with 15-minute or less service frequency during peak commute hours.
Founded in 1965, the Southern California Association of Governments (SCAG) is a Joint Powers Authority under California state law, established as an association of local governments and agencies that voluntarily convene as a forum to address regional issues. Under federal law, SCAG is designated as a Metropolitan Planning Organization (MPO) and under state law as a Regional Transportation Planning Agency and a Council of Governments.
The SCAG region encompasses six counties (Imperial, Los Angeles, Orange, Riverside, San Bernardino and Ventura) and 191 cities in an area covering more than 38,000 square miles. The agency develops long-range regional transportation plans including sustainable communities strategy and growth forecast components, regional transportation improvement programs, regional housing needs allocations and a portion of the South Coast Air Quality management plans
Seniors want to stay in their own homes, or at least in their own communities. And they want frequent transit to serve them. They've looked around and are deeply unhappy with what they have found. Why can't we have frequent and good transit like other places they have vacationed at?
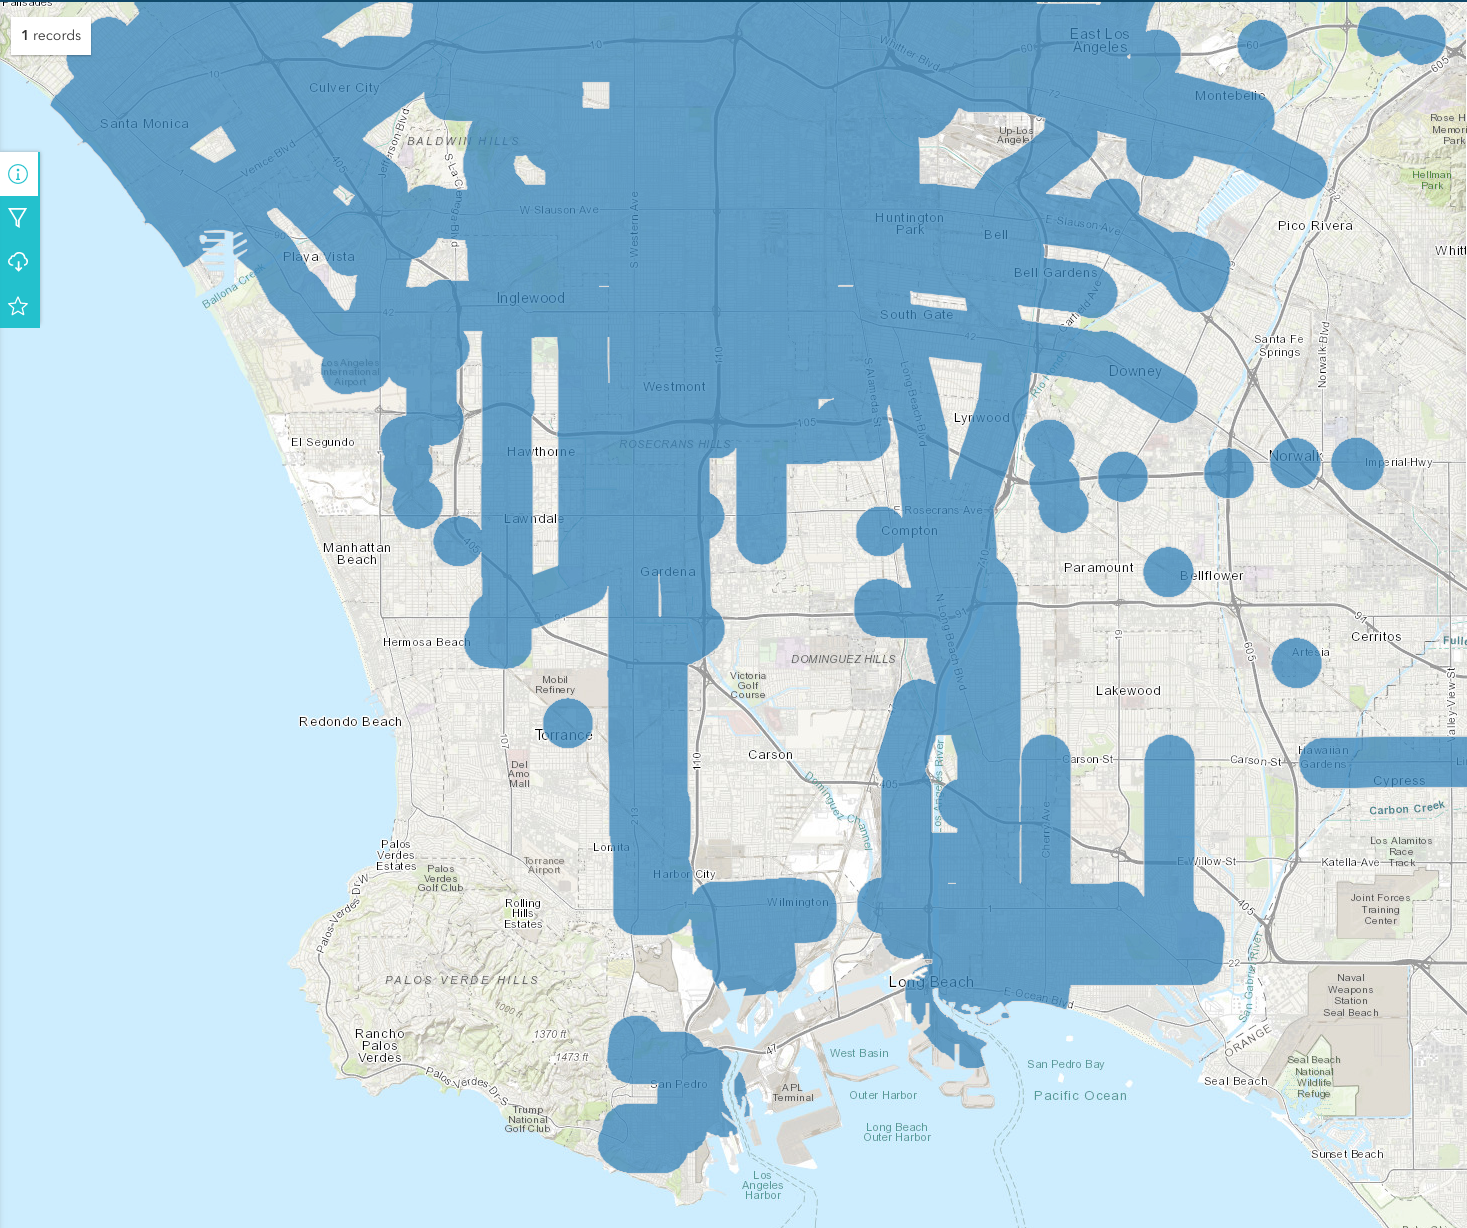
Why doesn't the South Bay have good transit? We're visibly a transit hole. High quality, frequent transit does not touch most of the residential areas of the Beach Cities, El Segundo, Torrance and Palos Verdes Cities.
Is it because wealthy people can afford cars and don't need transit? Nope, not if you compare to Santa Monica, Culver City, Pasadena and Beverly Hills.
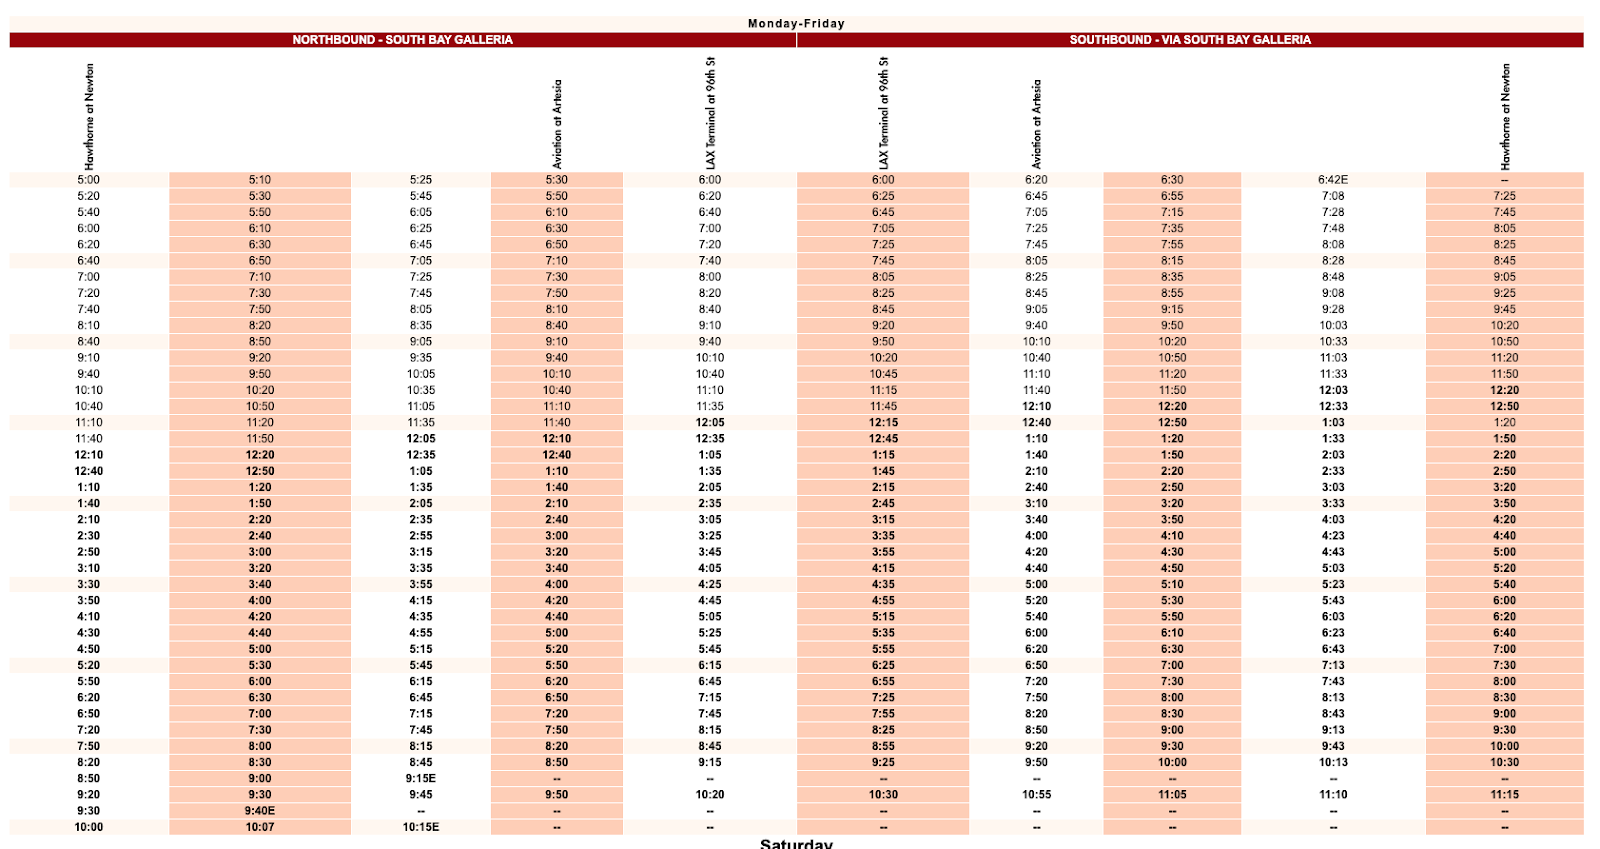
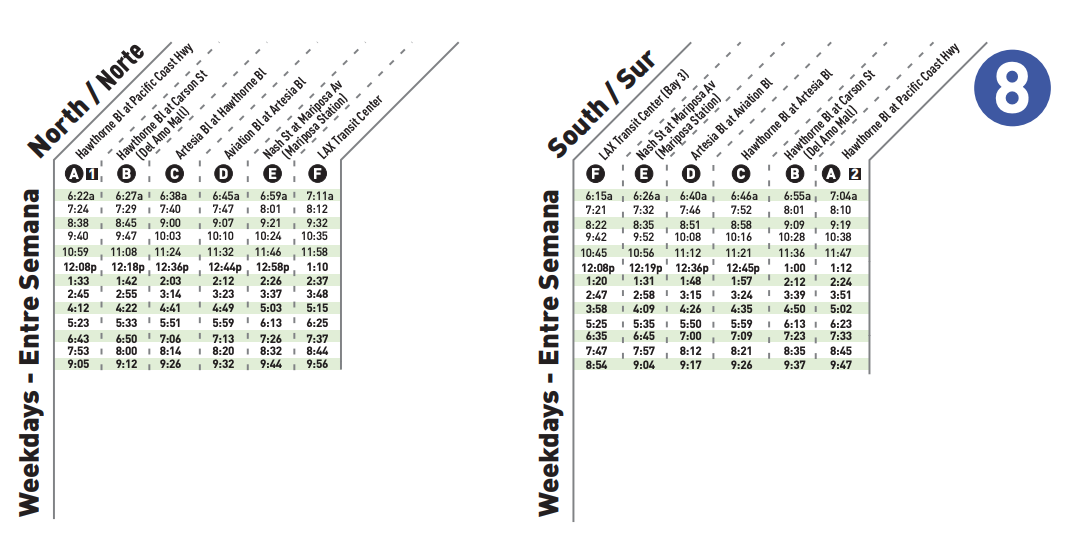
When we purchased our home in the late 1990s, we researched bus lines, bike commutes and USGS geologic maps. We really liked that the Torrance 8 bus ran between our home, daycare, workplace at 30 minute frequency throughout the day and even more often during peak commute hours. Those buses were well-used by people who worked in El Segundo and lived along the route in Torrance, North Redondo Beach and Hawthorne.
Over time, the service degraded noticeably and wasn't reliable any more. That's the main reason why I ride my eBike during the day and drive at night. Transit isn't viable for me any more, even if I want to take a bus to dinner and then walk home (burn off dessert) or catch a ride home with my dinner companions. Even during peak hours, the buses are infrequent and often get canceled at the last minute.
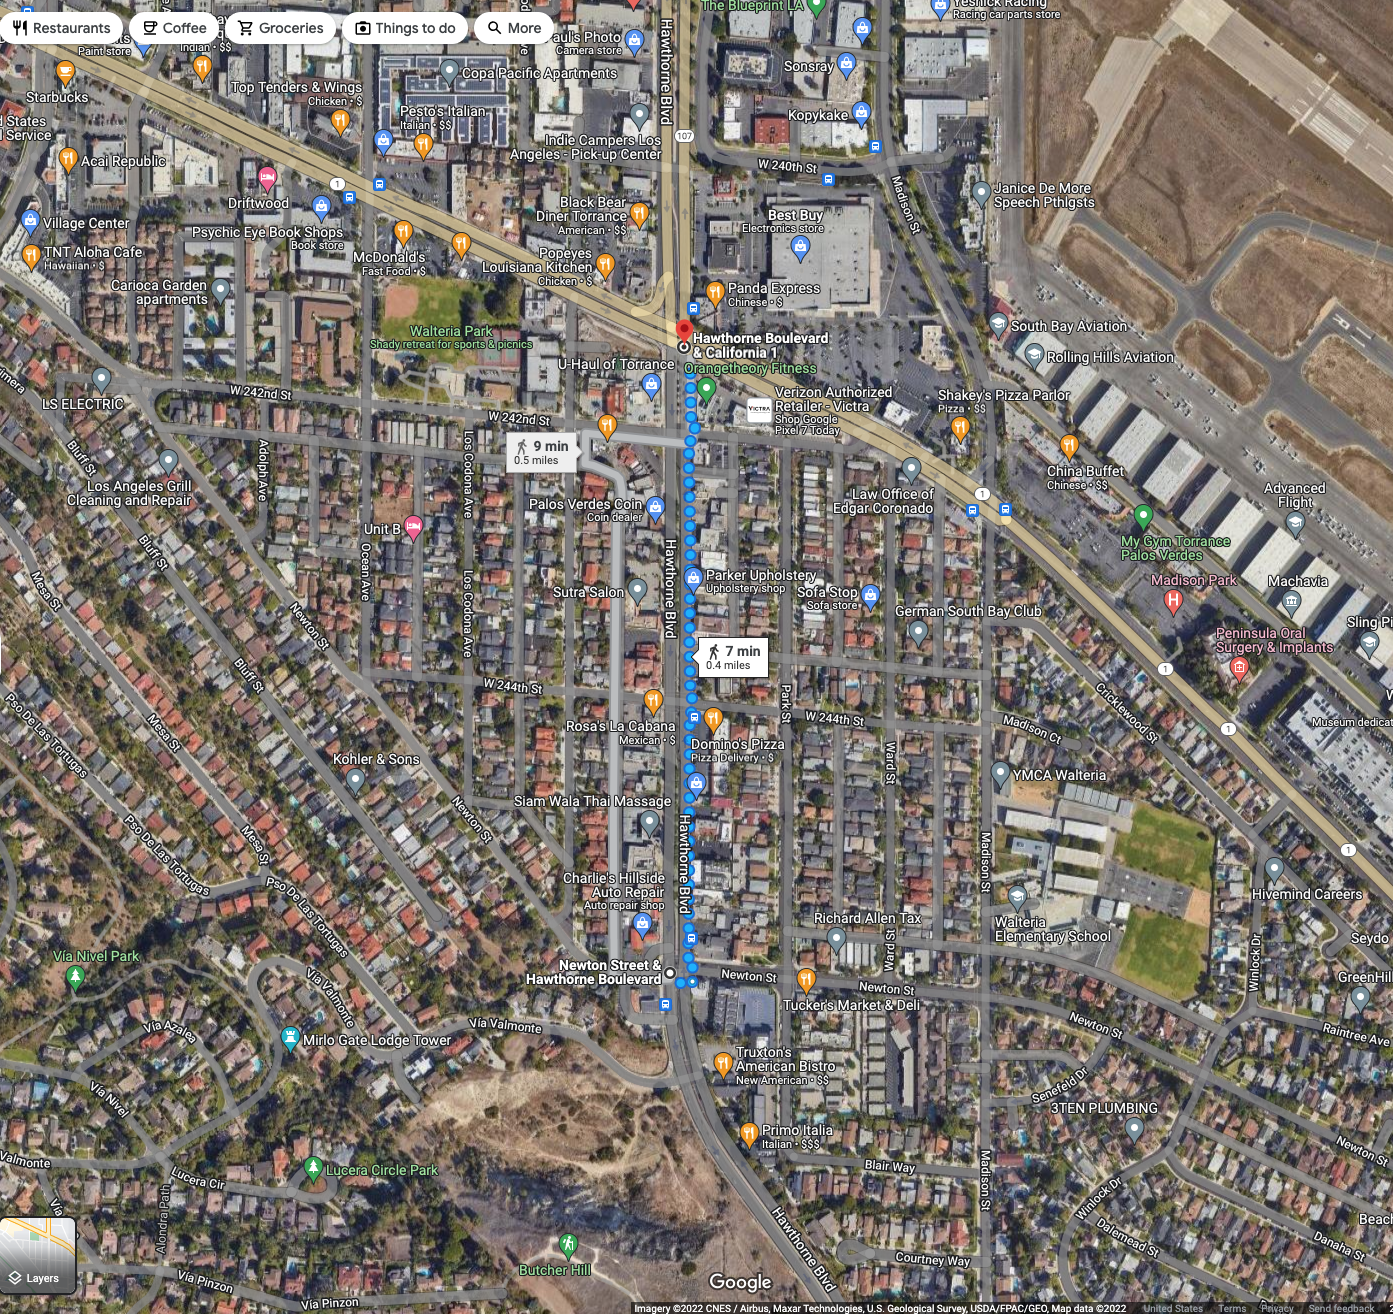
Moreover, the southern terminus of the route used to be at Newton St and Hawthorne Blvd, a short walk from hundreds of homes. Now the route has been shortened to end at the intersection of two state highways, Pacific Coast Highway (CA1) and Hawthorne Boulevard (CA107). To reach the stop, people have to walk farther from their homes and cross wide highways with 7-9 lanes of deafening traffic.
When I regularly took the bus, they were well-utilized. Most seats were occupied at peak hours. Even after peak, about half the seats were taken by people out shopping or going to their retail/service jobs.
Buses operate at a loss. That's why we pay taxes to subsidize them. But roads and parking lots also operate a loss and we never question whether or not they are necessary. Fuel and registration fees cover only about half the costs of roads; the rest comes from general funds.
The cost of "free parking" is borne by customers or tax payers, including those that didn't drive there. The subsidy is flowing towards drivers, not bike riders. In fact, pedestrians receive the lowest subsidy, then bike riders (cost of bike racks), then transit riders, then drivers.
But I digress. Let's get back to poor bus service. The seniors I talk to all want frequent buses that run near their homes. They would prefer the buses to run past their existing homes, but are willing to move to a condo or apartment complex within their communities if that is the only way they will get high-quality transit.
Sounds good. Let's pick some areas to serve intensively with transit, and then build lots of homes there. The more transit riders there are, the better service we can maintain; it's a virtuous cycle that serves seniors aging out of driving well.
Not so fast, building housing is politically toxic throughout the southland. Today's seniors have elected (for decades) local leaders running on platforms of preserving the "neighborhood character" of their "unique community", and fighting "overbuilding" and "Sacramento overreach".
Elected leaders are suing the state of California about whether they should be exempt from state housing law (like the Housing Accountability Act) and questioning both the legality and the numbers in the Regional Housing Needs Allocation.
The State of California's Department of Housing and Community Development (the CA analog of the Federal Government's HUD), tells each regional planning authority how many homes their region needs to build to provide for existing and future residents. Each region decides for themselves how they want to allocate those homes based on their goals and values.
The formula is a product of our professed values. We claim to value opportunity, so we assign more housing near where the jobs are. We claim to value clean air and want to lower Greenhouse Gas (GHG) emissions, so we place homes in HQTAs. We claim we want to address inequality, so we assign more low income housing to places that traditionally have not provided lower income residents.
Conversely, it assigns more higher income housing in poorer communities that can benefit from the tax base provided by higher earners. It's not forced gentrification or ghettofication. It's just trying to level the playing field to help everyone succeed. The goal is to work together with neighbors to solve regional problems like pollution, congestion, and the housing crisis.
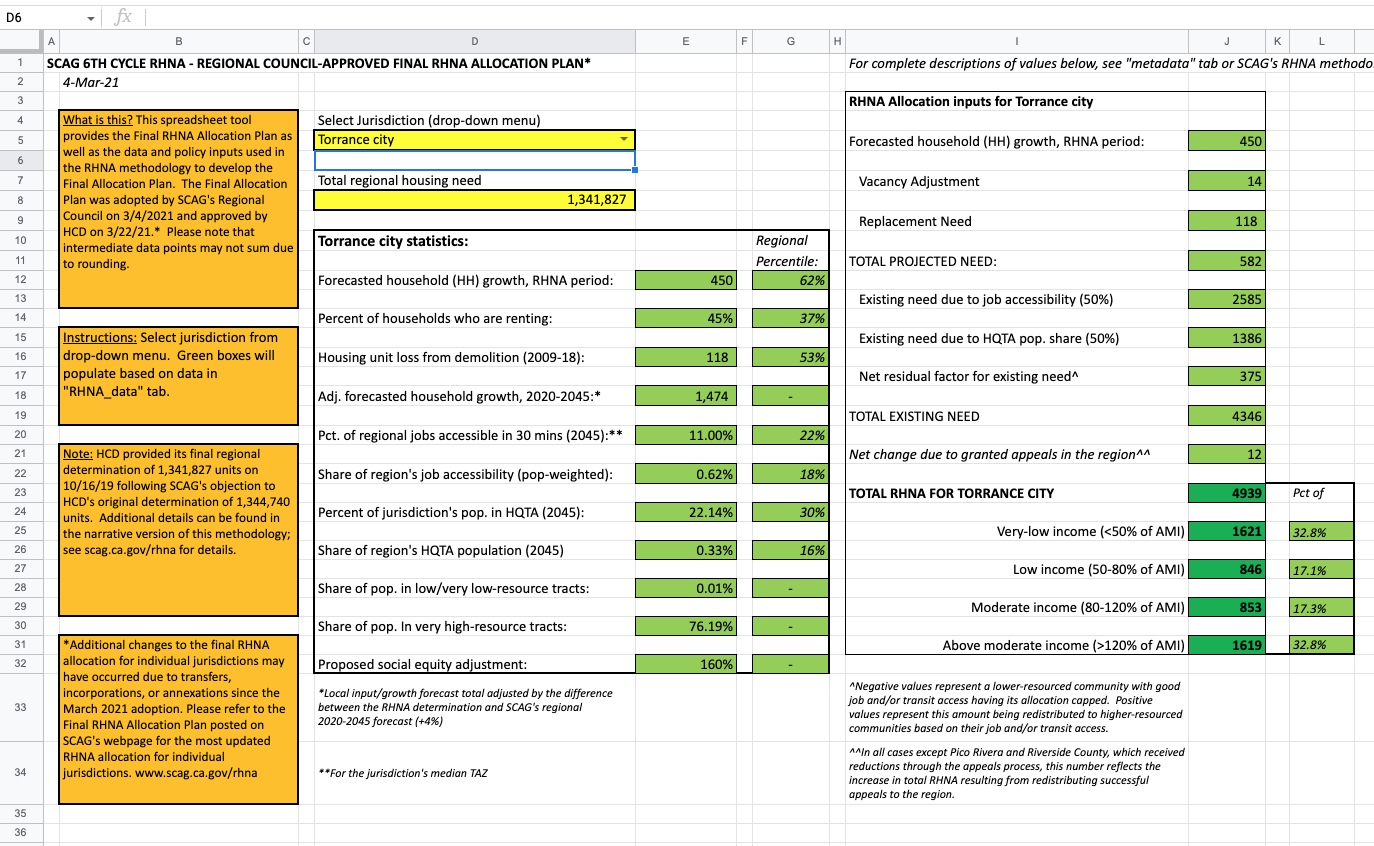
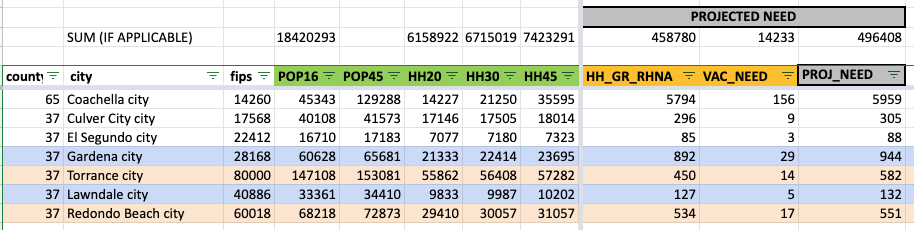
Just select your city of interest in cell D5. Here's Torrance, the city that runs Torrance Transit and presided over its demise. Torrance is big mad at their 6th Cycle RHNA "quota" of 4,939 homes over the next ~8 year RHNA cycle. They have never been given such a high allocation before. Their 5th Cycle allocation was 1,450, and they didn't even meet that.
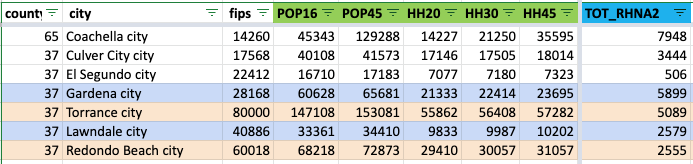
I paired Torrance with their neighbor, Gardena; and Redondo Beach with neighboring Lawndale. Notice how the smaller cities are given higher RHNA allocations than their larger and more affluent neighbors. They are assigned 2-3x as many homes per capita.
Is it because of job access? Look at the SCAG GIS map of Job Centers. Torrance is smack dab in the middle of one of the largest job centers in Southern California, with ~129,000 jobs.
Both loudly-complaining cities, Torrance and Redondo Beach, have more jobs and easier access to jobs than Gardena and Lawndale, hence they were assigned more homes in the Jobs column.
What explains the big differences then?
Go back and look at the HQTA map. It's all based on existing population in the HQTAs within each jurisdiction.
The more people already living inside the existing HQTAs used in the planning formula, the higher their HQTA-based RHNA allocations. Most cities like jobs (with the possible exception of pre-pandemic San Francisco) so they don't play as many games with that.
Cities know that the way to finesse lower RHNA housing allocations is to minimize the areal coverage of HQTAs in your city, and then to minimize the number of people who live in the HQTAs.
This is how El Segundo, home to LAX and the 121,000 jobs in the LAX job center,
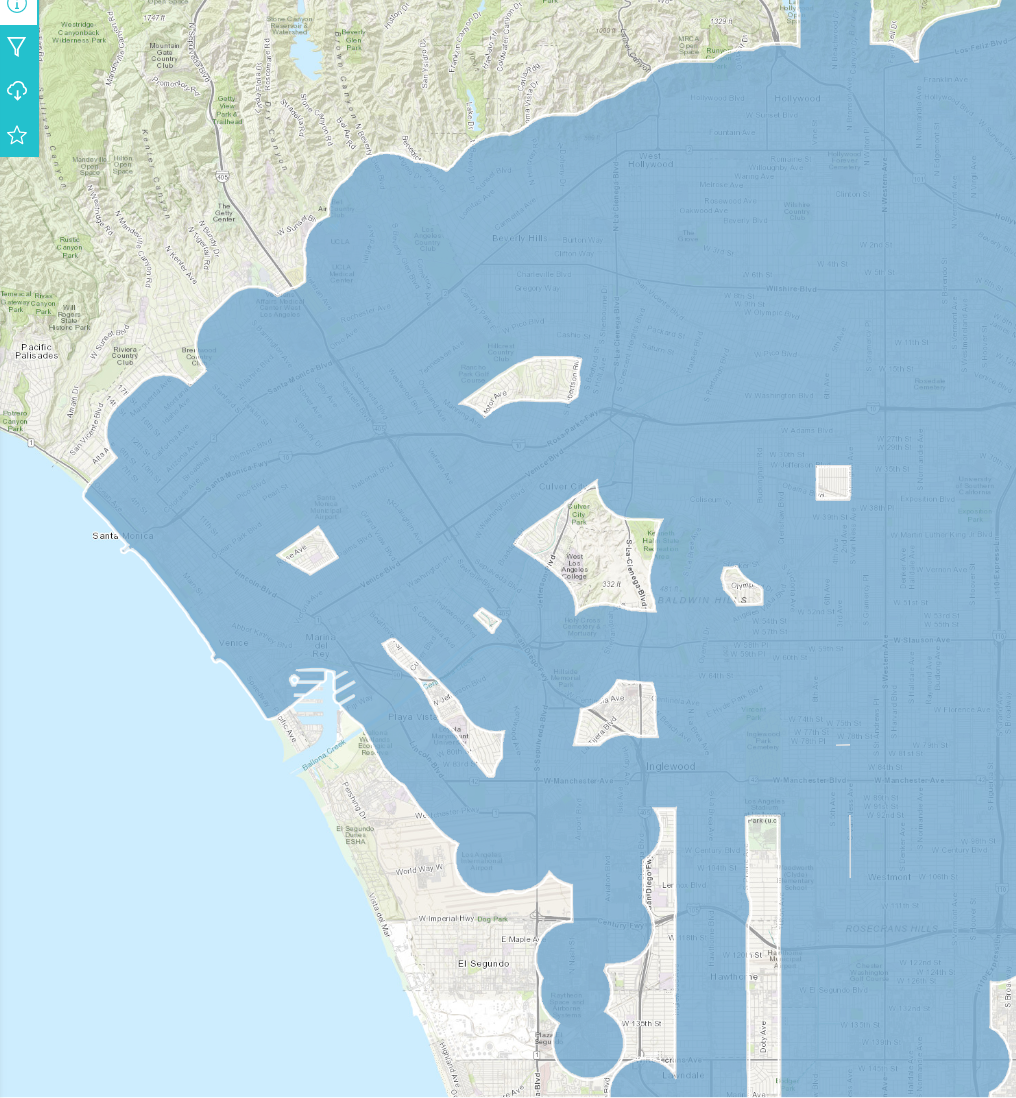
and with 3 light rail stations inside of their cities and one just over the border at LAX, got allocated just 1 home due to HQTA. Yes, just 1 home!
When El Segundo fought to avoid permitting homes east of PCH, this is the subtext. They gave up land to Hawthorne to avoid having homes in their jurisdiction near a rail station.
Sorry to be the bearer of bad news, but South Bay seniors who want to live in wheelchair accessible home with viable public transit will have to move away. Transit sucks now and will not be added back if it will expand HQTA coverage area. No new homes will be built in HQTAs if local officials can stop it.
(This is also why California enacted laws to preempt local officials to force them to permit home building in HQTAs.)
It's all connected to the decisions made by the people we elected and the incentives they operate under. When they talk about preserving the "neighborhood character" of your "unique community", and fighting "overbuilding" and "Sacramento overreach", they collect donations and win elections.
They don't tell you that they will never allow expansion of HQTAs within their jurisdictions if they can help it. This is a large part of the subtext of the fight over Metro C line extension routing. Your elected officials are fighting to ensure you don't get access to rail transit (which is harder to cancel/decrease than bus lines) so that they won't have to build housing.
They don't even want to build in existing HQTAs lest it expose them to higher RHNA allocations in future cycles. So instead, they talk about shadows and view sheds, impose high parking minimums. These all serve to reduce the number of homes that can be built and the number of people in the homes.
They don't tell you that the kind of low-density zoning they are protecting will only every yield townhomes with stairs, built on top of car garages. Low density zoning and height limits makes building accessible apartments with elevators prohibitively expensive to build. They hope developments don't "pencil out" (can't be built profitably), so that the developers go away.
What homes do get produced will be very expensive because they have to cover the parking and land. If you can build 2 stories of housing over 1 story of parking, they have to charge a lot more than if they built 4 stories of housing over the same parking structure on the same land. To maximize affordability, they could even stop requiring parking since seniors and the disabled are much less likely to drive or own cars anyway. Parking is another proxy war to suppress housing.
If you want to solve a problem. then you solve the problem. You don't spend decades screaming the problem doesn't exist. You don't enact ordinances that make the problem even worse. You don't sue people who point out that the problem exists. You don't defund researchers who collect data and evidence on the problem.
This applies to climate change and our regional housing crisis.
Enough, tonight. I just want to point out that it's all related.
Enjoy the Metro C Line (Green) Extension to Torrance Project Simulation Video. Think about how you want to live as you or your parents age out of driving. Think about where you want your children and grandchildren to live as the planet gets hotter and hotter. Do you want them on the cooler coast with you? Then make room for them.
I know that I will fight for a light rail route that is closer to my home. And I will also fight for a 7th Cycle RHNA allocation that can't be gamed by climate arsonists.
Even if we get a higher RHNA allocation based on light rail routing, California law gives us local control about where we place that home growth. We can and should spread it out, particularly as our area ages. The medical industry jobs in Torrance keep growing, and South Redondo Beach is very close to those jobs.
Aside:
Coastal Los Angeles Communities are facing a Silver Tsunami of aging residents and a dearth of younger families. Housing is so expensive, our children move far away. (A few may live with us.) The SCAG RHNA formula projects future housing needs based on demographics of existing residents. If you have few current residents of child-bearing age, then you won't have many births or future residents to house.
Since we have moved homes affordable for young, families so far into the inland deserts, they were assigned higher RHNA allocations than older communities along the coast. I included the data for Coachella in my comparison table.
Coachella has 14,277 Households in 2020, while Culver City has 17,146. Yet, Household Growth in Coachella is projected to be 5,794 while Culver City's is only 296. That's a 20-fold difference!
If you push young people out of your city, you will be assigned lower RHNA numbers. But then, who will help you change your senior diapers? How often will you see your children and grandchildren?
Anyway, stop fixating on "winning" a game of foisting housing elsewhere. Plan for a better future for yourself by planning for a more inclusive future in your community.
I do a lot of utility cycling around my suburban LA area since I bought an eBike. It's so easy to stop and take photos when out on bikes, I document some of the delightful or ridiculous things I see along the way. If you follow me on Twitter, you see the photos.
There are some bike snobs who insist that riding eBikes is cheating and we are not exercising. So I wrote a Twitter thread about a recent 9.2 mi loop covering 3 errands.
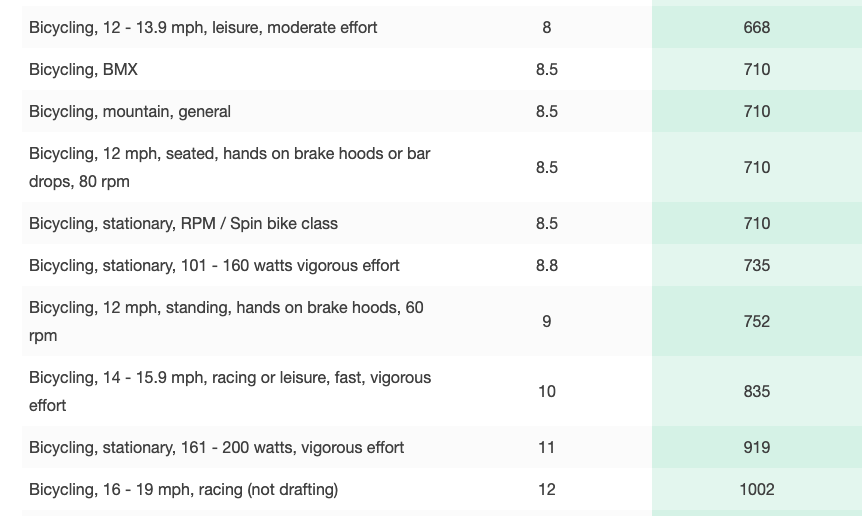
Sure enough, bicycling 10 miles in an hour burns 484 calories, according to the chart. Walking three miles in an hour burns 353 calories. And driving 30 miles in an hour burns — wait for it — 170 calories!
That presumes a lighter person on a lighter bike. My 53# eBike, 9# U-lock, 2" wide tires, middle-aged weight, and groceries mean I'm burning over 500 calories/hour if not using e-assist. I turn on e-assist only when going up steep or long hills, to get started at traffic lights/stop signs, to hit green lights (which are timed for car speeds), or to keep up with traffic on fast/busy roads.
I'm also a bit obsessed with data so I bought a Kill-a-Watt device to track how many watts I use recharging my eBike battery. I typically use 9-10 watt-hours (Wh) per mile in utility riding.
1 food calorie = 1 kilocalorie of energy = 0.0011622 kWh
I used 90 watt-hours = 77.44 kcal/food calories of electricity.
If I had ridden a non-assist bike at 10 mph, I would have used at least 500 calories. Assuming 77.44 of those calories came from e-assist, the breakdown would be 15% motor, 85% myself.
40 minutes of 15 mph riding on an eBike would be about 500 calories, same as the earlier estimate. This is reassuring confirmation. I'm using my eBike to ride faster and further. Hills will not stop me! Numerous studies show that I am not alone.
The people who bought e-bikes increased their bicycle use from 2.1 kilometers (1.3 miles) to 9.2 kilometers (5.7 miles) on average per day; a 340% increase. The e-bike's share of all their transportation increased dramatically too; from 17% to 49%, where they e-biked instead of walking, taking public transit, and driving.
I take my eBike instead of my car for more of my errands. That's a win for me (exercise in a busy schedule), for my community (no wear tear and parking to provide) and for my region (no air pollution).
I hope you try an eBike soon. If you have, drop a comment with your experiences.
There's been much hoopla about California's budget surplus and high gasoline prices. So why not use some of that surplus to alleviate pain at the pump? That may be good political messaging when the impetus is the much more mundane Gann Limit on CA public spending. The ghost of Howard Jarvis strikes again. Not content to limit just property taxes, they sponsored and got the electorate to approve caps on overall spending that limit public investment overall.
I don't want to belabor the stupidity of giving people who own cars $400 per car, up to $800 per person, while not similarly rewarding people who are either too poor to own cars and/or care enough about the common good to not own a private car in the first place.
In a world without all the stupid laws that we inherited, we could have fully funded our Active Transportation Program (ATP) to increase the proportion of trips accomplished by biking and walking. The majority of ATP-funded projects are Safe Routes to Schools--to help children get safely to and from school. Basically, we need to protect kids outside of cars from the cars chauffeuring them around.
In 2014, cities and counties across the state requested about $1 billion in funding for pedestrian and bicycle safety projects, but there was only $368 million available, meaning about 37 percent of applicants were funded that cycle. Fast forward to Cycle 5 in 2020 when over $2.5 billion in funding requests were submitted for $554 million in available funding, a success rate of about 22 percent. In Los Angeles County, only 14 of 64 applications were awarded even partial funding, or 22 percent total – demoralizing, yet consistent with the statewide average.
The 2023-24 ATP budget is even grimmer. ATP has $147,670,000 to spend that is not already committed to other projects. That means, the 6-county SCAG region of 20 M people (including LA County, has only $31,242,000 or about $1.50/resident.
In contrast, Governor Newsom's proposed 5-year infrastructure plan will devote $10 B to electric cars and $20 B for roads, roughly $5 B/year (pages 7-8). This isn't even counting the $ spent on CHP and traffic enforcement. Due to the Gann limit, every $ spent in one place is a $ we can't spend somewhere else. This is extremely discouraging.
In the mean time, we depend on volunteers and advocates such as Safe Routes Partnership to help communities hone their proposals to improve their odds of winning an ATP grant. "In ATP Cycle 5, four out of the five communities we worked with scored an 86/100 or above." In other words, communities can compete to get technical help to further compete to get funds to improve street safety for school children.
My community finally won an ATP grant, but the funds allotted are well short of what we really need to remodel our streets. We're likely to end up with some paint and street signs. Sigh.
We have so much work to do. Spend some time exploring the California ATP Transportation Injury Mapping System. (You need to register to create a free account, but it's worth it. UC Berkeley researchers built the system and don't do anything nefarious with your search terms.)
Here's a heat map of the 2017-2021 carnage.
People who live in the neighborhoods with the larges blotches of red are least likely to own a car but most likely to be killed or maimed by one. In Los Angeles County, over 5 years, 173 cyclists dead, 1323 pedestrians dead, thousands more injured and maimed. Their lives will forever be marked by pain and disability. (I'm not even counting the effect of air pollution in their neighborhoods.)
The Gann Limit requires CA to give out rebates. I wish that the rebates be used for restorative justice instead of rewarding people for owning cars. Who's with me?
We've circled the sun one more time to another World Water Day. This year, the theme is Groundwater.
I co-organize a monthly (Zoom) series for the League of Women Voters of Los Angeles County that grew out of a one-time water walking tour I led in the Beach Cities. We record and post all the Water and Infrastructure Group (WIG) lectures along with the slides. Occasionally, I add articles about what we learned or add further information on each month's subject.
Mr. Matthew Hacker is a registered geologist in California and is currently a Senior Resource Specialist at the Metropolitan Water District of Southern California. He has more than 27 years of experience in water resources planning and local resource development in the areas of groundwater, stormwater, and water recycling. Currently, he is striving to create a more resilient water future for Southern California through innovative new projects such as Metropolitan’s groundbreaking Regional Recycled Water Program.
His prepared talk is under an hour, half the video is Q and A.
One fascinating thing I learned is that Metropolitan stores imported river water in the vast LA coastal aquifer. That water we pump out, treat, and deliver to our homes, may have originated in Northern California or Colorado.
You can learn more about that by watching the Who Fills Your Taps? Video or reading the Who Fills Your Taps? Slide Deck. This is a marathon one that is better ingested in two bites. WIG co-organizer, Kathy Kunysz, is a scientist & planner who has had a long & varied career in water. She knows so much, it's an honor and an education to co-host this series with her.
If you consider yourself an environmentalist and live in California, odds are high that your inbox has been bombarded with misinformation from a certain group that purports to speak for small solar rooftop owners combatting climate change.
They call themselves The Something Rights Alliance. Notice their rhetoric focuses on Individual Rights vs Collective Responsibilities. This Libertarian framing is then wokewashed with faux concern for the poor to argue for policies that actively harm the poor.
This Dark Money group is so effective at Flooding the Zone with Misinformation that I'm not going to name them for fear of their web sniffers and the mobs they unleash. But pay attention to the loaded, emotional language that they use in order to short-circuit critical thinking.
I've been taking a lot of heat from this group and was going to lie low. But, this morning, I read Skeptics Say, ‘Do Your Own Research.’ It’s Not That Simple. written by Nathan Ballantyne and David Dunning (yes, that Dunning) and decided that I have to speak out against armchair environmentalists and the Dark Money manipulators weaponizing them.
It's bad enough that we are dealing with Covid & Climate Change deniers, but now we have to worry about Regulatory Capture by Big Solar as well?
“Dark money” refers to spending meant to influence political outcomes where the source of the money is not disclosed. Here’s how dark money makes its way into elections:
Politically active nonprofits such as 501(c)(4)s are generally under no legal obligation to disclose their donors even if they spend to influence elections. When they choose not to reveal their sources of funding, they are considered dark money groups.
IRS 990 for 2018, showed they went from $0 income to $215,017 income, but did not file a (now purely optional) supplement to show who gave them the money. Meanwhile, the board shuffled a bit, but kept the same executive director. He earns his keep by being very active on the bird app and always in your inbox stoking outrage for Straw Man claims that no one is seriously proposing or considering.
Enough about the Dark Money, let's talk about the lies. I wrote an entire fact sheet debunking the wild things they say in their mass emails. It all sounds so physically plausible, until you pick up a physics textbook and calculator.
The kerfuffle is over Net Metering, the methodology where we credit rooftop solar owners at retail rates for excess electricity that they export onto the shared grid. It made sense when the goal is to nurture a nascent industry, but it becomes a problem when the industry is mature, per panel costs have come down over 90%, and a lot of homeowners are trying to do the same thing.
When CA passed the first Net Metering law back in the 1990s, lawmakers were worried about the day when residential rooftop solar would be ubiquitous enough that Net Metering would cause a cost-shift from solar owners to non solar owners. They wrote in the legislation that they would periodically examine the cost-shift and readjust incentives as necessary. This Dark Money group wants to subvert the law.
This is further exacerbated by the fact that (with few exceptions) you have to own your home and have enough home equity to swing a loan to install solar panels on the home. Guess who has the money? It's generally older, wealthier and whiter people than the general population. Over half of Californians are renters. Add in the people who live in condos/townhomes, whose smaller roof area per resident constrain their ability to generate excess electricity to export.
According to the vast majority of energy experts in academia, national labs and industry; that cost-shift is happening, costs CA electricity customers without solar over $3 Billion per year (and rapidly climbing), and is a very inefficient way ($ and materials) to decarbonize California's grid. I'm not going to belabor the points, it's already covered in my Fact Sheet. The main point is that people who have larger systems, and fewer residents/users, export the most electricity to the grid and benefit the most under the status quo NEM 2.0.
This Dark Money organization tried to stop the regulatory reform process by claiming it was rigged. When that failed, they turned to organizing a mob to lobby Governor Newsom to either veto the proposed decision or to appoint new California Public Utilities Commissioners that are friendlier to them. This might work because the CPUC was led by an environmental justice rock star, Martha Guzman Aceves, who has been tapped by the Biden administration to head up the EPA for Region 9, which includes California.
There will be two openings on the CPUC, so this is where they might actually succeed. The vote is scheduled for January 27, 2022 and there might be new commissioners, or the vote can take place without two stalwart defenders of poorer Californians. This is why I'm writing about it here. I'm hoping you will learn more, and then help vaccinate the population against the lunacy. They are going to flood the governor and the CPUC with their talking points. So I want to get mine out as well.
Simply put, the Grid is a support system that binds all of us together. We depend on our neighbors and they depend on us. That is the rationale for the Grid Participation Charge, GPC.
The Grid is a complex and expensive system to build and maintain. It's also extremely creaky, with many system components from the Rural Electrification Act era, over 80 years ago. If we are not going to burn coal or fossil gas, for which we already have plants close to the users, then we need to build out a twenty-first century national grid to move renewable energy around from source regions to use regions.
Transmission losses are inversely proportional to voltage; high-voltage interstate transmission lines that bring New Mexico evening wind energy to Los Angeles can lose as little electricity to transmission loss as from a neighborhood substation to a home in the suburbs (a few % each). That's all taken into account in the Avoided Costs Calculator that NEM 3.0 uses.
People without solar pay for the grid through volumetric rates ($ per kWh) and a very daily fee. Rooftop owners push/export electricity to the grid during midday and then pull/import from after sunset. They are heavy users of the grid, but their volumetric bill can be effectively zero. So they are not financially supporting the grid even though they are heavily reliant on the grid.
In order to encourage conservation, we set volumetric rates so that, the more you use, the more you pay. That makes intuitive sense, as long as everyone is paying into it. But, suppose all the heavy users, who also happen to be the wealthiest, install privatized systems--rooftop solar. With volumetric rates, they buy a lot less electricity, which means the (~9/10) non solar customers have to pick up the slack to support the grid.
The fewer people paying for the Grid through volumetric rates, they higher the volumetric rate (cost per kilowatt hour) needs to be to pay for the Grid. Under the current Net Energy Metering 2.0 program, rooftop solar owners get paid the retail rate for electricity they export, which is about 5 times as much as the avoided cost (generally wholesale cost of utility-scale solar plus transmission & reserve capacity).
This retail rates have to go up to cover this overpayment, which then generates even higher payments to the rooftop solar owners. This is a positive feedback mechanism, also known as a runaway train.
Net Metering Reform is about countering this runaway train effect.
It's long, it's complex, the ruling (proposed decision) is 204 pages for a reason. But I want to counter two BIG LIES.
The first is that the Grid Participation Charge will hurt low-income solar owners (or which there are very few). Nothing could be further from the truth.
Remember earlier when I explained that the Grid is a social contract? Well, we acknowledge some people have more needs and less resources than others. We subsidize the vulnerable. Low income and disabled people (their entire households) will be exempt from the GPC. The GPC will phase in slowly over 5 years, with a Market Transition Credit to soften the landing. Low income households will also get the MTC so they will get a negative GPC.
In contrast, NEM 2.0 is paying low income homeowners with solar LOWER prices than for much wealthier solar owners. Why? Because low income people pay 18-35% lower retail electricity rates. So, the wealthier you are, the more you are earning under NEM 2.0.
The second lie is that the CPUC is doing the bidding of the utility companies and designing NEM reform to kill their competitor, roof top solar. Utility companies are regulated monopolies. They can wish for the sky, but the CPUC tells makes the rules.
The CPUC has an obligation to keep the Grid in good working order (capacity and maintenance); ensure a safe, reliable and affordable electricity supply for all users; decarbonize the Grid in a cost-effective way as fast as possible, using roof top solar as one of their many tools; and to sustainably promote roof top solar. It's a tough balance, which is why they studied the issue for so long, listened to many arguments, examined a lot of data.
The CPUC isn't trying to kill off an industry they are tasked to support. They are just trying to do it within the constraints of the other things they must also ensure--like affordable rates and a robust grid for everyone.
The second lie is related to the resilience argument. Currently, the CPUC and the public who pays for NEM 2.0 has no say in where new rooftop solar is installed and subsidized. Adoption is much broader in wealthy communities. That leaves a lot of poor communities vulnerable to rolling blackouts and Public Safety Power Shutoffs. Rooftop solar + batteries/storage help insulate people from power outages. If your community has a lot of solar power, and it is set up to run in island/micro-grid mode, then you may be able to access some intermittent power off the micro-grid. But it's not reliable.
Under NEM 2.0, the resiliency benefits of rooftop solar accrue to the owners, and a little bit to their neighbors. If you are so worried about access to reliable electricity for the medically fragile in the era of frequent Public Safety Power Shutoffs, why not just give solar systems with batteries for the disabled? Or build Community Resilience Centers in poor neighborhoods where people can come for air conditioning, electricity, wi-fi, hot showers, etc?
That's the beauty of proposed NEM 3.0. It would raise and disburse $150 Million each year to fund solar installations with storage (batteries) for those in highest need. We would swap a horribly inefficient subsidy system, NEM 2.0, for a new subsidy that identifies those in highest need and directs the largest subsides to help them. Disabled people who are on SSI (and their households), regardless of income, will be exempt from the GPCs.
It's about efficiency with our dollars. It's about directing help to those in need instead of waiting for trickle-down solar to work. It's about helping renters and multi-family residents instead of single family home owners (who have a larger rooftop/person ratio).
Please, please, please, don't feed the outrage machine. Read the Proposed Decision yourself (the conclusions of law starts on page 175 and the order starts on page 179), or at least the CPUC NEM Fact Sheet.