Showing posts with label Windsday. Show all posts

Monday, January 03, 2022

Dark Money Greenwash Wokewash

If you consider yourself an environmentalist and live in California, odds are high that your inbox has been bombarded with misinformation from a certain group that purports to speak for small solar rooftop owners combatting climate change. 

They call themselves The Something Rights Alliance.  Notice their rhetoric focuses on Individual Rights vs Collective Responsibilities.  This Libertarian framing is then wokewashed with faux concern for the poor to argue for policies that actively harm the poor. 

This Dark Money group is so effective at Flooding the Zone with Misinformation that I'm not going to name them for fear of their web sniffers and the mobs they unleash. But pay attention to the loaded, emotional language that they use in order to short-circuit critical thinking. 

I've been taking a lot of heat from this group and was going to lie low. But, this morning, I read Skeptics Say, ‘Do Your Own Research.’ It’s Not That Simple. written by Nathan Ballantyne and David Dunning (yes, that Dunning) and decided that I have to speak out against armchair environmentalists and the Dark Money manipulators weaponizing them.

It's bad enough that we are dealing with Covid & Climate Change deniers, but now we have to worry about Regulatory Capture by Big Solar as well? 

Let's start with Dark Money.

“Dark money” refers to spending meant to influence political outcomes where the source of the money is not disclosed. Here’s how dark money makes its way into elections: 
Politically active nonprofits such as 501(c)(4)s are generally under no legal obligation to disclose their donors even if they spend to influence elections. When they choose not to reveal their sources of funding, they are considered dark money groups.

I looked up this group in Charity Navigator to find out more about them. They are unscored because they won't disclose information. Hmmm. Then I looked up their 990s on the IRS website. They reported ZERO income in 2017, the last year 501(c)(4)s were required to disclose their donors in a supplement. New grassroots organizations may start with no money and a bunch of volunteers, then grow slowly (both members and $), but this organization's funds grew overnight and then stayed flat. 
IRS 990 for 2018, showed they went from $0 income to $215,017 income, but did not file a (now purely optional) supplement to show who gave them the money. Meanwhile, the board shuffled a bit, but kept the same executive director. He earns his keep by being very active on the bird app and always in your inbox stoking outrage for Straw Man claims that no one is seriously proposing or considering.
In 2019, they report $215,027 in income and their board changes slightly again with the addition of more minorities to bolster their wokewash credentials.
 

Enough about the Dark Money, let's talk about the lies. I wrote an entire fact sheet debunking the wild things they say in their mass emails. It all sounds so physically plausible, until you pick up a physics textbook and calculator. 

The kerfuffle is over Net Metering, the methodology where we credit rooftop solar owners at retail rates for excess electricity that they export onto the shared grid. It made sense when the goal is to nurture a nascent industry, but it becomes a problem when the industry is mature, per panel costs have come down over 90%, and a lot of homeowners are trying to do the same thing. 

When CA passed the first Net Metering law back in the 1990s, lawmakers were worried about the day when residential rooftop solar would be ubiquitous enough that Net Metering would cause a cost-shift from solar owners to non solar owners.  They wrote in the legislation that they would periodically examine the cost-shift and readjust incentives as necessary. This Dark Money group wants to subvert the law. 

This is further exacerbated by the fact that (with few exceptions) you have to own your home and have enough home equity to swing a loan to install solar panels on the home. Guess who has the money?  It's generally older, wealthier and whiter people than the general population.  Over half of Californians are renters. Add in the people who live in condos/townhomes, whose smaller roof area per resident constrain their ability to generate excess electricity to export. 

According to the vast majority of energy experts in academia, national labs and industry; that cost-shift is happening, costs CA electricity customers without solar over $3 Billion per year (and rapidly climbing), and is a very inefficient way ($ and materials) to decarbonize California's grid.  I'm not going to belabor the points, it's already covered in my Fact Sheet. The main point is that people who have  larger systems, and fewer residents/users, export the most electricity to the grid and benefit the most under the status quo NEM 2.0. 

This Dark Money organization tried to stop the regulatory reform process by claiming it was rigged.  When that failed, they turned to organizing a mob to lobby Governor Newsom to either veto the proposed decision or to appoint new California Public Utilities Commissioners that are friendlier to them. This might work because the CPUC was led by an environmental justice rock star, Martha Guzman Aceves, who has been tapped by the Biden administration to head up the EPA for Region 9, which includes California. 

There will be two openings on the CPUC, so this is where they might actually succeed. The vote is scheduled for January 27, 2022 and there might be new commissioners, or the vote can take place without two stalwart defenders of poorer Californians. This is why I'm writing about it here. I'm hoping you will learn more, and then help vaccinate the population against the lunacy.  They are going to flood the governor and the CPUC with their talking points. So I want to get mine out as well. 

I want to talk about the Straw Man claims vs the actual California Public Utilities Proposed Decision. The Dark Money group is using wildly inflated numbers for the Grid Participation Charge. The math doesn't even work out right on their claims.  If you don't want to read the 204 pages of the Proposed Decision (PD), then at least read the CPUC NEM Fact Sheet: Modernizing California’s Net Energy Metering Program to Meet Our Clean Energy Goals Proposed Decision for Proceeding R.20-08-020. 

Simply put, the Grid is a support system that binds all of us together.  We depend on our neighbors and they depend on us. That is the rationale for the Grid Participation Charge, GPC. 

The Grid is a complex and expensive system to build and maintain.  It's also extremely creaky, with many system components from the Rural Electrification Act era, over 80 years ago. If we are not going to burn coal or fossil gas, for which we already have plants close to the users, then we need to build out a twenty-first century national grid to move renewable energy around from source regions to use regions. 

Transmission losses are inversely proportional to voltage; high-voltage interstate transmission lines that bring New Mexico evening wind energy to Los Angeles can lose as little electricity to transmission loss as from a neighborhood substation to a home in the suburbs (a few % each).  That's all taken into account in the Avoided Costs Calculator that NEM 3.0 uses. 

People without solar pay for the grid through volumetric rates ($ per kWh) and a very daily fee.  Rooftop owners push/export electricity to the grid during midday and then pull/import from after sunset.  They are heavy users of the grid, but their volumetric bill can be effectively zero. So they are not financially supporting the grid even though they are heavily reliant on the grid.

In order to encourage conservation, we set volumetric rates so that, the more you use, the more you pay.  That makes intuitive sense, as long as everyone is paying into it.  But, suppose all the heavy users, who also happen to be the wealthiest, install privatized systems--rooftop solar. With volumetric rates, they buy a lot less electricity, which means the (~9/10) non solar customers have to pick up the slack to support the grid.  

The fewer people paying for the Grid through volumetric rates, they higher the volumetric rate (cost per kilowatt hour) needs to be to pay for the Grid.  Under the current Net Energy Metering 2.0 program, rooftop solar owners get paid the retail rate for electricity they export, which is about 5 times as much as the avoided cost (generally wholesale cost of utility-scale solar plus transmission & reserve capacity).

This retail rates have to go up to cover this overpayment, which then generates even higher payments to the rooftop solar owners.  This is a positive feedback mechanism, also known as a runaway train.

Net Metering Reform is about countering this runaway train effect. 

It's long, it's complex, the ruling (proposed decision) is 204 pages for a reason. But I want to counter two BIG LIES. 

The first is that the Grid Participation Charge will hurt low-income solar owners (or which there are very few).  Nothing could be further from the truth. 

Remember earlier when I explained that the Grid is a social contract?  Well, we acknowledge some people have more needs and less resources than others.  We subsidize the vulnerable.  Low income and disabled people (their entire households) will be exempt from the GPC.  The GPC will phase in slowly over 5 years, with a Market Transition Credit to soften the landing. Low income households will also get the MTC so they will get a negative GPC. 


In contrast, NEM 2.0 is paying low income homeowners with solar LOWER prices than for much wealthier solar owners.  Why? Because low income people pay 18-35% lower retail electricity rates.  So, the wealthier you are, the more you are earning under NEM 2.0. 

The second lie is that the CPUC is doing the bidding of the utility companies and designing NEM reform to kill their competitor, roof top solar.  Utility companies are regulated monopolies. They can wish for the sky, but the CPUC tells makes the rules. 

The CPUC has an obligation to keep the Grid in good working order (capacity and maintenance); ensure a safe, reliable and affordable electricity supply for all users; decarbonize the Grid in a cost-effective way as fast as possible, using roof top solar as one of their many tools; and to sustainably promote roof top solar.  It's a tough balance, which is why they studied the issue for so long, listened to many arguments, examined a lot of data. 

The CPUC isn't trying to kill off an industry they are tasked to support.  They are just trying to do it within the constraints of the other things they must also ensure--like affordable rates and a robust grid for everyone.

The second lie is related to the resilience argument.  Currently, the CPUC and the public who pays for NEM 2.0 has no say in where new rooftop solar is installed and subsidized.  Adoption is much broader in wealthy communities. That leaves a lot of poor communities vulnerable to rolling blackouts and Public Safety Power Shutoffs.  Rooftop solar + batteries/storage help insulate people from power outages. If your community has a lot of solar power, and it is set up to run in island/micro-grid mode, then you may be able to access some intermittent power off the micro-grid. But it's not reliable.

Under NEM 2.0, the resiliency benefits of rooftop solar accrue to the owners, and a little bit to their neighbors.  If you are so worried about access to reliable electricity for the medically fragile in the era of frequent Public Safety Power Shutoffs, why not just give solar systems with batteries for the disabled?  Or build Community Resilience Centers in poor neighborhoods where people can come for air conditioning, electricity, wi-fi, hot showers, etc?

That's the beauty of proposed NEM 3.0.  It would raise and disburse $150 Million each year to fund solar installations with storage (batteries) for those in highest need.  We would swap a horribly inefficient subsidy system, NEM 2.0, for a new subsidy that identifies those in highest need and directs the largest subsides to help them. Disabled people who are on SSI (and their households), regardless of income, will be exempt from the GPCs. 

It's about efficiency with our dollars. It's about directing help to those in need instead of waiting for trickle-down solar to work. It's about helping renters and multi-family residents instead of single family home owners (who have a larger rooftop/person ratio).

Please, please, please, don't feed the outrage machine.  Read the Proposed Decision yourself (the conclusions of law starts on page 175 and the order starts on page 179), or at least the CPUC NEM Fact Sheet


Wednesday, April 10, 2019

Windsday 2019

Happy Windsday!

It's been years since we've experienced a proper jet stream-induced Windsday.
Consider the jet stream, a fast-moving horizontal river of air at approximately the 300 millibar level (about 30,000 feet above sea level). Bernoulli's principle explains that, where the air is flowing fastest, the air pressure is lowest. It's a positive feedback loop because the jet stream sits over the regions of the lowest pressure and the pressure is lowest where the air is moving fastest. It's like a mountain pass that allows the air to blow through--only this pass can move and change course.

High pressure systems are associated with warm and sunny weather. Low pressure systems are associated with 'disturbed', cloudy and stormy weather.
Last night, I read several tweets from journalists remarking about the ripping Santa Anas. It didn't feel like a Santa Ana--too cold and not dry enough. I quickly took a look at the California Regional Weather Server Jet Stream Analysis webpage.

Universal time/UTC/Z is 7 hours ahead of PDT so this was 23PDT 9 APR 2019.  Note the peak of 136 knots right over LA in the jet stream analysis.
We've lived with the Ridiculously Resilient Ridge for so long, we forgot what it feels like when the jet stream dips south over us.

It seems like the satellite image overlay is no longer active at either CRWS or the Naval Research Lab links I provided earlier.  Research funding scarcity and the privatization of data from public satellites was just too much to overcome.

Wednesday, December 02, 2015

That was some windsday!

A couple of weeks ago, we had some wild winds up at the Mesa Lab.   The instruments up on the roof of the building recorded a peak gust of 94 mph!

Notice how the sustained winds (in red) were pretty similar for the last 3 events while the peak winds (in blue) varied much more widely?

The frequent high winds rattle and stress the windows.  The larger ones are prone to cracking and breaking.  My neighbor noticed the crack in his office window before the wind incident of November 18, 2015.

(The window in the mirror image office across the hall from this one cracked last spring.)

It isn't every day that you can see a paneless opening in your office building.

It took three guys on the inside and one guy on the outside to replace the window.

Some view!

Wednesday, November 11, 2015

Now that's a windsday!

The snow blew sideways outside my window for much of the afternoon.  When I left work tonight, I worried that I would be blown off the mesa!

Monday, December 07, 2009

Windsday


Came early this week.

I am flat on my back with a muscle strain, listening to the wind.  How often are the winds in southern California as strong as those in the northern plains states?

Puzzled?  Read the Windsday series.

Our raingauge blew over, but I guess we got a bit over 1", similar to neighboring rain gauges I found through weatherunderground.com.

Some links from the LA Rainfall series:

Monday, October 05, 2009

Maybe One Wildfire Post

I was getting tired of fire season (and it has only just begun), but this picture was so interesting, I wanted to share.  Here's yesterday's NASA Aqua satellite imagery of southern California.  Look at the smoke plume emanating from the Sheep Fire.  (Click to see the 500 meter resolution images.)


In the false color image, you can see the burn area and past burn areas that have not yet recovered.  Look at the sizes of the burn scars from the Station fire (immediately to the west of the current fire) and near Santa Barbara.  Malibu and Baja California also show evidence of recent fires.


You can always find more imagery at the MODIS Rapid Response System website. The La Jolla Subsets are of particular interest to Angelenos and San Diegans. Santa Barbara residents may be more interested in the Fresno subsets.  They provide imagery in 2 km, 500 m and 250 m resolution.

The California Regional Weather Server at SDSU shows handy jet stream analyses like this one, from around the time of the Terra imagery above.  We were lucky that the wind was blowing smoke away from population centers.


The jet stream is still overhead.  We will have several days of cold, windy and unsettled weather, perfect for the new mommy and me riding boots that Iris and I bought over the weekend.

Addendum:
The jet stream is a high altitude current of fast-moving air.  Surface winds do not necessarily coincide with the jet stream, but they are influenced by them.    Right now, the sum of the jet stream and our seasonal Santa Ana winds is producing very calm wind conditions near the fire.  That's the good news.

Wednesday, April 15, 2009

Another Windsday

Bad Dad actually didn't want to walk three blocks home from Rice Things because of the wind!

I lifted the graphic from the California Regional Weather Server at Cal State San Francisco. They have more pictures like this (including movies!) and more weather data for CA than you can shake a mouse at.

More windsdays:
Happy Windsday
Windy Not Windsday

Thursday, May 22, 2008

Wild Weather and Wild Fire in CA

The jet stream almost exactly traced the coastline today, not a typical pattern for us.

The Santa Cruz mountains wildfire injected a plume of smoke into the middle of the jet stream.

My sister says that there was no way I could have been feeling the effects of the smoke from the Santa Cruz fire by 8:30 AM when we IM'd. Jet stream speeds of 120-150 knots could travel between Santa Cruz and LA in 3 hours or so. The fire started around 5:30 AM. She's right. But what could it be?

Perhaps I was experiencing respiratory effects from the Santa Clarita fire closer to home? Santa Clarita is NE of me; the smoke from that fire is unlikely to travel this far west. It was such a small fire compared to the Santa Cruz one.

After discussion with my sister, I realized that the unusual wind pattern put me downwind of the Chevron refinery 5 miles NE of home.

It rained between 6 and 7 PM today and it sounds like the rain has started up again. Rain in late May in a non-El Nino year is rare. Could the soot from the fire have nucleated raindrops?

Links:

Thursday, February 07, 2008

A Different Kind of Bathtub Ring

The earth's atmosphere is often explained as a shallow pan of fluid atop the surface of the solid earth. It is a very large bathtub. So why should we be surprised to see a global-scale bathtub ring from space?

Read Dust Storms Overseas Carry Contaminants to U.S. There are huge clouds of dust traveling the rivers overhead. The dust carries heavy metals, toxins, insects, bacteria and viruses. Who needs jet travel to spread SARS when you have the jet stream?

I had thought it was a pacific northwest problem, but I learned that "authorities in Los Angeles estimate that on some days, one-quarter of the city's smog comes from China."

I downloaded the hemispherical view of the jet stream analysis from the California Regional Weather Service.

Check out NASA's MODIS picture of the day archive. A remarkable number of them are of severe dust events.

Look at my photos of the Fox Glacier. The guides told us that the reddish dust were deposited from the Australian outback during severe dust events.

Thursday, January 24, 2008

Real Rain (and Hail, too!) in Los Angeles

The rain gauge at Chez Bad Mom this morning, 24 January 2008. It reads ~ 2.3". (It is clickable if you want to read it yourself.) Unfortunately, I forgot to empty it out before this week's storms hit; I am not sure if there was residual moisture in the gauge from the rain 2 weeks ago. Things slip when you are fighting jet lag.

[Aside 1: If you got here by searching on Los Angeles Rainfall or LA Rainfall, you will find all sorts of interesting links to relevant rainfall statistics websites by clicking on the Meteorology tag link.]

[Aside 2: No, I do not work at the company barely visible in the corner of the photo. I picked up the freebie rain gauge at their booth at an American Meteorology Annual Meeting. The 2008 meeting is currently going on in New Orleans, but I didn't attend this time. If you can look at the program you can see that my work is being presented.]

Right after I took the picture of the rain gauge and emptied it, I set out to work. The rain was awfully loud. I looked down and saw little white ball bearings hailstones. Here's the proof. I know these hailstones are puny by Midwestern standards, but it is an extraordinary occurrence in coastal Los Angeles.


We are in for a few more days of rain. See how the jet-stream is sitting over us, steering the storms right into southern California? (Jet stream analysis courtesy of the California Regional Weather Server. Thanks, again, Dave!)

Now look at the 72 hour forecast. Over southern California, the scenario looks awfully similar, huh? It will be a wet three days.

Note that, by Sunday night, the winds jet stream will be from a more southerly direction than now. Because the lower-level air will likely also travel from the south, over warmer ocean water, we will probably get more (and warmer moisture). That is not good news for skiers or the snowpack that we depend upon for summer water supplies.

[Aside 3: The plots show Universal Time or UTC and LA local time is UTC - 8 hours.]

Did I mention that the rain gauge held another 0.25 inches when I came home from work today?

Wednesday, October 10, 2007

Surf

The surf was up last Friday. Remember how placid it looked in the photo in Pleasure?

Sure looks different in the video I took Friday, 5 October at lunch. Listen to the roar of the wind and watch the flapping of the palm fronds in the video.


Look at the jet stream analysis (courtesy of the California Regional Weather Server). Ripping winds aloft usually mean big winds below. Big winds bring big waves.


By the next morning, the water was considerably less choppy.

Friday, September 21, 2007

Late Arrival

It is actually raining now! I am posting the current radar as proof. Earlier, we saw lightning. I opened the windows so we can enjoy the sound of rain falling on the leaves of the tree outside our bedroom window. Ooh, I just heard thunder.

It is so tough to be a weather geek in LA.

Many people were making fun of Angelenos and meteorologists today. I can explain everything. There is a perfectly reasonable explanation why so many traffic accidents occur when it rains here. It is because it rains so seldom.

Road grime is greasy. It builds up on the roads unless rain washes it away. LA is a desert. When the first rain arrives after a long dry spell, and we have a lot of long dry spells, the roads become incredibly slick. Accidents can happen even to good drivers (not that I am saying we are uniformly good drivers here). People from wetter parts of the country don't properly appreciate the difficulty of living in a desert with so much traffic and, hence, road grime and so little rain.

About the other matter. People have been making fun of meteorologists all week because it seemed like the predicted rain would never come. First, it was supposed to arrive Wednesday. Nope, Wednesday was sunny. Then it was supposed to arrive on Thursday, anther bright sunshiny day. Why can't we get the day right?

It has to do with the difficulty of predicting the behavior of a cutoff low, an area of low pressure hemmed in by surrounding higher pressure areas and removed from the jet stream. For technical reasons that I don't completely understand but my coworkers do (it involves technical terms like isobaric and hydrostatic), cutoff lows don't have any place to go. So, they tend to stagnate over areas. When they do move, their motion is highly unpredictable, depending on slight pressure differences. (They can retrograde!) It is much harder to make landfall predictions for a cutoff low than for a big old hurricane with lots of momentum.

Friday, August 17, 2007

Rockin'


Gaia Girl and Monique named me a Rockin’ Girl Blogger. Thank you very much, but I don’t think of myself as rockin’. Mostly, I am (barely) holding it together.

Now let’s talk about the weather. I found a couple of newish sites that were not yet in my bookmarks that I want to share.

Remember when I had trouble seeing the jet stream analysis at low latitudes? Well, the Navy Research Laboratory in Monterey has put up a new page of satellite imagery with NOGAPS (numerical weather prediction) overlays. It is beautiful AND useful. You can navigate to it from their general satellite page click on “Images with NOGAPS Overlays” on the right, then scroll down near the bottom of the next page to “Jet_Stream” Atlantic.

The National Center for Environmental Prediction’s runs Ensemble Forecasts, a set of NWP runs with different initial conditions. The spaghetti plots are difficult to understand, even for meteorologists. However, check out their Tropical storm performance monitor page. Different storms are tracked in separate columns. The date and time that the models were initiated are on the left. For the latest Hurricane Dean predictions, click on the topmost 04L link.

Aren’t the “spaghetti plots” pretty? Unlike the plots I showed two days ago where each line was the forecast from a different model, the same model produced all these predicted storm track lines. The difference is in the initial conditions fed into the model. The initial conditions are produced by a method called “bred vectors”.

That brings me back to Rockin’ Girls again. Rather than name other bloggers, I want to honor some rocking women that made a difference in my life.

Firstly, there is Admiral Grace Hopper, a mathematician and the mother of modern programming languages. She invented the concept of compilers and was instrumental in developing the standards for COBOL and Fortran. It is hard to imagine numerical weather prediction without Fortran. No wonder so many streets and buildings are named after her in Monterey, home of Navy Postgraduate School, Navy Research Laboratory, and Fleet Numerical Meteorology and Oceanography Center.

A colleague, who served in the Navy during the era of the Tailhook scandal, told me that Fleet Numerical is the only duty you can draw in the Navy where women outnumber men. He was in heaven when he arrived. He loved the work, and the work atmosphere. The example set by Admiral Hopper has a great deal to do with the relatively large number of women in numerical weather prediction.

Secondly, I want to introduce Eugenia Kalnay, who tirelessly championed ensemble forecasting at the operational centers. This may be obvious to us today, but it wasn't an easy sell when computational power was more limited and we had to think long and hard about how we spent it. She was also instrumental in developing the mathematics for optimizing selection of the ensemble.

Lastly, I want to introduce Jenny Harrison, a mathematics professor at my alma mater, UC Berkeley. This very sad tale makes me squirm, but I think it is important to talk about it. I never took a class from her. In fact, in my entire 8 semesters at Berkeley, I never took a class taught by a female science or math professor.

Berkeley had only one tenured female professor when Jenny Harrison came up for tenure. She was denied. She was told that she was merely average and average is not good enough for Berkeley. She asked to see her tenure review file. She was stonewalled on the basis of privacy (for the tenure committee members). After much legal wrangling, her file was released to the public. It said that her production of research was average when compared to tenured Berkeley math professors. That is, she was par for the set that she wished to join.

Why, then, was she denied? It is not explicitly stated, but I think it had to do with her personality. Men and boys were really put off by her. I remember a male Freshman at my dorm who complained about her teaching technique. I asked him what he meant. He said that she never called on a male student as long as a female student was available. He would hold his hand up high and she would ignore him and pick female students time after time. Gee, he was complaining about treatment I endured every day in every class. Of course, nice girl that I was, I didn't tell him that. I merely dropped the subject.

Fast forward to the end of the semester and my male professor handed out the final exam and said, "This exam will separate the men from the boys." The other woman in the class and I looked at each other in panic. What did he mean by that remark? We were stressed out enough by the exam itself without being told that we were either invisible or not welcome there.

Fast forward another semester when another student told me that my math teaching assistant was rating the physical attractiveness of the female students in his section during office hours. He told me this because he thought I would be happy to have been rated highest. I was devastated by this and never went to office hours again.

In fact, I was ready to drop out of math altogether until a friend introduced me to Jenny Harrison in the lunch area outside the math building one day. He told her that I was good at math but thinking of discontinuing math studies. Would she talk to me? She motioned for us to sit down and eat lunch with her.

She asked me if I liked math. I told her yes. Then she asked why I wanted to stop studying math. I told her about the uncomfortable environment. She told me that, if I quit, then I had let them win. She told me to study what I wanted and not to listen to the others. (She might have had stronger words than that, but I can't recall her exact words.) I do recall her forcefulness and her total lack of deference towards men. I think it cost her dearly. She won the legal fight, but it took a heavy emotional toll.

So today, I want to honor the women who came before us. They proved that we are good enough and that we deserve a place at the table.

Links:

Tuesday, August 14, 2007

Vicarious Weather

[Post updated with more recent storm track graphic and proper credit to Weather Underground.]

I am a weather geek living in a place that has almost no weather to speak of. Luckily, I have friends in places that actually have weather. A friend sent me a link to the hurricane track below from Weather Underground's Tropical Weather site.

She asked if I thought it would make landfall or go out to sea. Hmm, I need no excuse to go pore over weather data and make proclamations that I am not qualified to make.*

Off I went to look at the jet stream plots from the California Regional Weather Server. Unfortunately, their plots stop short of the tropical region. I could make out at the edge that winds aloft were rather weak and moving toward the east. (See how the arrows are rather puny and point to the left? The longer the arrow, the stronger the winds aloft.)

Then I took a look at the surface winds. In this type of plot, the "wind barbs" have lines showing the directions that the winds came from. That means the winds are coming from the east near the surface.
That is favorable for hurricane formation. If the winds aloft and at the surface moved in different directions, a condition known as wind shear, the storm can be ripped apart. With little or no wind shear, the storm could really grow.

Warm water below also fuel monster storms. So I looked at the sea surface temperature, SST. That looks pretty warm to me. To put it in perspective, it helps to look at the SST anomaly, or the deviation from the climatological mean. Any way you look at it, the water is warm and conducive to formation of a large storm.
We have an office pool about hurricane storm tracks. As the only non-classically trained meteorologist, I use a naive method. I bet the storm will follow the warm water. So right away, you can see that two things can happen. If the storm blows into the hot water north of Puerto Rico, it will blow out to sea instead of hitting the mainland US. If the storm continues to the east, it can linger in the Caribbean over the very warm water and hit the mainland.

What do the real meteorologists do? They take into account momentum and Coriolis forces. Some pore over the surface pressure maps. Others look at the water vapor ahead of the storm. (Water vapor holds a great deal of latent heat energy which also fuels storms.) Better yet, we can feed all the information into a weather model and crank up the supercomputers. The National Hurricane Center does this, but
The National Hurricane Center (NHC) does not generate a graphic of the models it uses to produce its forecasts. We do this because our past experience indicates such plots have confused users and detracted from our final message, which is producing official tropical cyclone forecasts and advisories. Some users have also become too reliant in the individual forecast scenarios presented by the many model forecast lines, some of which have little or no chance of being correct. This is not the message the NHC wants to send. (Please read our Mission and Vision).
It is ok because the Navy is willing to show you their model hurricane track.

Actually, NHC runs an ensemble of many models. Some are more realistic than others so they don't plot them all out, lest they mislead the public (see above). The Environmental Modeling Center is willing to share their ensemble plots. MIT's hurricane group collected hurricane models from multiple weather forecast centers and plotted them all together.
Why am I showing you so many spaghetti plots? Don't take too much stock in a single forecast. In the words of a newspaper headline on my bulletin board, "Weather Tip: Get many forecasts; 1 may be right"

On a more serious note, the ensemble of forecasts help us understand the uncertainty of predicted hurricane tracks. NHC has an (outdated, but still a gem) web page showing model performance against actual storm tracks for several models and for an entire hurricane season. (nm = nautical miles) See how the models vary in accuracy. The geospatial uncertainty for all models increase with forecast time. In other words, the further in the future, the more difficult it is to accurately predict a hurricane track.

Table 3: Average Errors (nm) of the Early Track Models for 1996-97 Atlantic Tropical Cyclones

Forecast Interval (hr)
Model 12 24 36 48 72
CLIPER51103161220351
NHC904685129180285
BAMS61114168222336
BAMM4991133177268
BAMD4788132183293
LBAR4175111159284
GFDI426998128200
No. Cases346310279255207

And what is the point of all of this?
If you live in hurricane country, you need to prepare well in advance, when the uncertainty is still high. Remember the horrible traffic as people tried to evacuate ahead of Katrina?

If, like the couple in the Dream Home Diaries Blog, your home is on an island, then you need to evacuate even further in advance because of the possibility that bridges will be closed due to high winds or gridlock. Thus, many people whose homes have only a moderate to low probability of being directly hit by the storm should evacuate anyway. If they wait too long, they will have missed their opportunity. Now, where are we going to put all those evacuees?

If you want to think about something even scarier, look at the vast area that could be under water in the event of a storm surge. Suppose they had an 8 meter storm surge. How far from their dream home would they need to evacuate? The flood map generator is just way too much fun for a professional worrier like me. ;-)

* Disclaimer * I am not academically trained as a meteorologist. But the American Meteorological Society let me join because I
hold a baccalaureate or higher degree from an accredited institution of higher learning in some other science or a related field and be currently engaged in a professional activity in which his or her knowledge is applied to the advancement or application of the atmospheric or related sciences

Monday, February 05, 2007

It's Officially a Drought

The National Drought Mitigation Center has declared a moderate to severe drought over much of southern California. Click here to see the U.S. Drought Monitor map for the southwest.

Much ado has been made about how dry this El Nino winter has been. But, El Nino only loads the dice for a wetter than average year. Warm offshore water doesn't bring rain if the jet stream (a fast-moving current of air several miles above the earth's surface) doesn't cooperate.

The jet stream brings unsettled, stormy weather below it. (Think Bernoulli's principle; fast-moving air has lower pressure.) Often, in February, the jet stream splits into two with the southern branch residing over southern California. Some years, the jet stream splits a little bit earlier or later (or never). Anyway, that's why February is historically the wettest month in LA.

The California Regional Weather Server has an excellent jet stream page. I like to look at the eastern Pacific and western north America plots. Notice how, lately, the jet stream tends to just miss us, either to the north or to the south?

Compare this with the record setting rainy winter of 2005.

Is it really an El Nino?
Take a look at the National Weather Service's tropical Pacific sea surface temperature (SST) and anomaly animation. (The anomaly is the difference between the actual conditions and the climatological average.) Last fall, it looked like we were headed into an El Nino situation with the SSTs in the eastern Pacific warmer than average. But it doesn't look like that is true any longer. By January, the El Nino near the equator had all but disappeared. If anything, the SSTs off the southern California coast had become colder than average.

Slightly off-topic
I like the SST analysis and anomaly plots from the Navy's Fleet Numerical Meteorology and Oceanography Center better. Unfortunately, they are in the midst of a computer system upgrade and have no recent data available. However, take a look at the SSTs during Hurricane Katrina. Type "30 C to F" into Google if you think in Fahrenheit instead of Celsius. Can you spot the Gulf Stream?


Links
One of my coworkers has plotted LA rainfall statistics in a meaningful way. Go take a look.
Read more about Los Angeles Rainfall statistics (skewness!) in an earlier post. That's all folks.

Friday, December 29, 2006

It's all relative

This week has certainly been windy in our area. Mark and I were debating whether it was windier than "windsday" this past March?

First, I checked the jet stream and surface winds analyses at the California Regional Weather Server. Then I decided that was a misapplication of technology; I need only check the relative wind strengths at a few nearby weather stations.

From the pier in Santa Monica, a storm in January had stronger winds. In Manhattan Beach*, this week's peak speed of 28 mph was stronger than March's 25 mph. Redondo Beach sat on the fence--both storms had similar wind gust speeds of 30 mph.

Then I realized that I had fallen into another technology trap. Those wind gauges doesn't tell me the relative wind strengths at my house.

Because I don't have a wind gauge, I will have to use my eyes. Look at this tree across the street. It remained upright through the March 2006 storm only to list to the south this week after the storm. That's how the old meteorologists did it. They walked around with their eyes open and looked at the trees.

Read the entire Windsday series.

* There's a rumor in meteorology circles that the MB weather station is not installed at the regulation height, biasing their wind measurements relative to properly installed stations.  I have no first hand information about that.

Monday, March 27, 2006

Death Valley 2006

We returned to Death Valley during wildflower season because my mom was so entranced with our pictures from last year. Alas, 2006 is shaping up to be a normal year for DV wildflowers. We did watch the sunrise at Zabriskie point.

I took the obligatory photo of the sun hitting beacon rock.


But I was more taken with the shadows on the alluvial fan to the south.


Then we stopped to say hello to the pupfish in Salt Creek. They were friskier than the dire newspaper articles suggested they would be. We lured Iris to walk the entire boardwalk loop with the admonishment, "Hurry up and see the pupfish before they go extinct!"


Saturday was very windy. We saw dust devils galore. People drove with their headlights on due to the poor visibility and our poor car was sandblasted. Of course, Mark said it was just as windy during the Death Valley Double in 1996. I think his memory is faulty. Yes, it might have seemed just as windy while riding his bicycle for 200 miles that day in DV, but they would have called off the ride if it was that bad. Just the same, I promised to look up the archival wind data for that day and Saturday to give him relative upper level wind strength.

Here is the jet stream analysis for the region about the time that the ranger station at Furnace Creek measured gusts of 51 mph. The upper level winds looked like they were about 175 mph over DV on Saturday afternoon. (Be sure to convert from UTC to PST.)


keywords: travel, California, Death Valley, meteorology

Saturday, March 18, 2006

Windy Not Windsday

People like to ask me about the weather. Why, yes, I did notice it has been windy and stormy lately. Is it part of the big storm up north? It feels kind of warm--maybe it is a "pineapple express" storm?

Reply
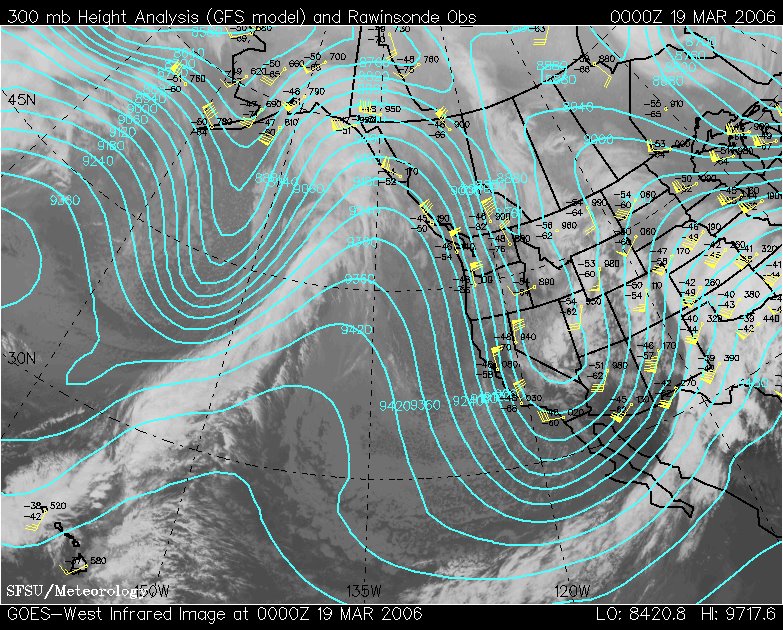
Check out the latest jet stream analysis at the California Regional Weather Server. We are in the region south of the Pacific Northwest storm system, but north of the "pineapple express".

[Pineapple express storms originate near Hawaii and bring the storms with the heaviest precipitation to southern CA. The colder ones originating in the Aleutian low do not typically bring much moisture this far south.]


A bit of weather trivia
The wind vectors in the first plot point in the direction of the wind flow. The wind barbs in the second plot point in the direction that the wind is coming from. When looking at a wind analysis, be sure you know whether you are looking at a wind vector or a wind barb. The difference is only 180 degrees.

The cyan blue lines are lines of constant pressure, isobars. See how the jet stream winds follow the contours of the isobars?


Here is another example of a wind barb plot (from the unisys weather server); this one is for winds at the surface at the same time.


Notice that the surface winds do not usually blow in the same direction as the jet stream winds.

Our rain gauge is empty.

Wednesday, February 22, 2006

Happy Windsday


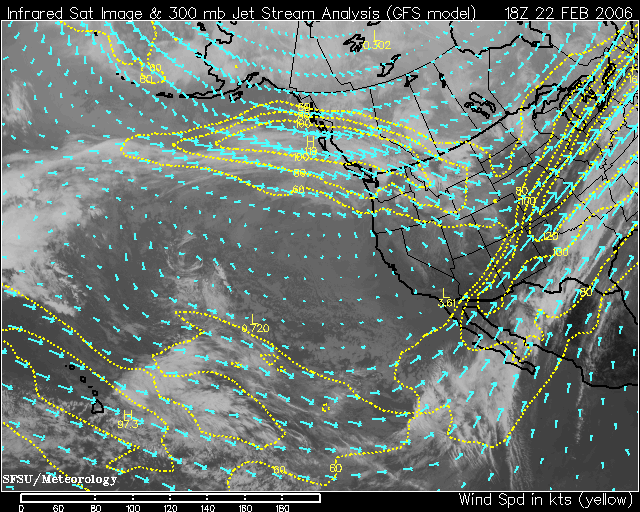
Iris wished me a happy windsday so I am posting the GOES West infrared image and jet stream analysis for today, Windsday, 22 February 2006. I lifted the graphic from the California Regional Weather Server at Cal State San Francisco. They have more pictures like this (including movies!) and more weather data for CA than you can shake a mouse at.

Saturday, November 26, 2005

Baby it's windy outside

Ok, that isn't really the way the song goes. But, if it is windy outside, the jet stream probably dipped south over LA.