Showing posts with label Water. Show all posts

Thursday, January 02, 2025

Wastewater Surveillance Sites

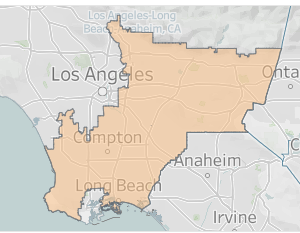
 My local wastewater treatment plant is one of the original CDC Sentinel sites where the CDC samples flu variants circulating in the population. I know that sewage-sheds are not perfect proxies for the general population. But, my wastewater (and that of 4.8 Million people in LA County) goes to the A K Warren Facility in Carson, CA. It's the largest treatment facility in LA County, the US, and among the largest in the world. 

The CDC sampled at a number of facilities around the country in different metropolitan areas, determined the circulating diseases discoverable from wastewater, and then formulated the flu vaccine supply accordingly. This is a backwards-looking process. What was circulating last summer may not be what is circulating now.  But, there is a long lead time to ordering vaccines and getting shots in arms. 

Anyway, we can test for a lot more things now. And, we have the capacity to test at more sites. I'm very nervous about what is at state now that Trump has lost the election and wants to install RFK Jr to lead the CDC. Most people won't know what we lose because they don't even know what the CDC does. This is just a small window in what this agency does.  

I just want to provide a few links to useful resources because Google Search has degraded so much, it's hard to find sites. Also, some sites have broken links--either moved elsewhere or lost their funding when the Covid Emergency declaration expired. 

This is what I could find today, Jan 2, 2025

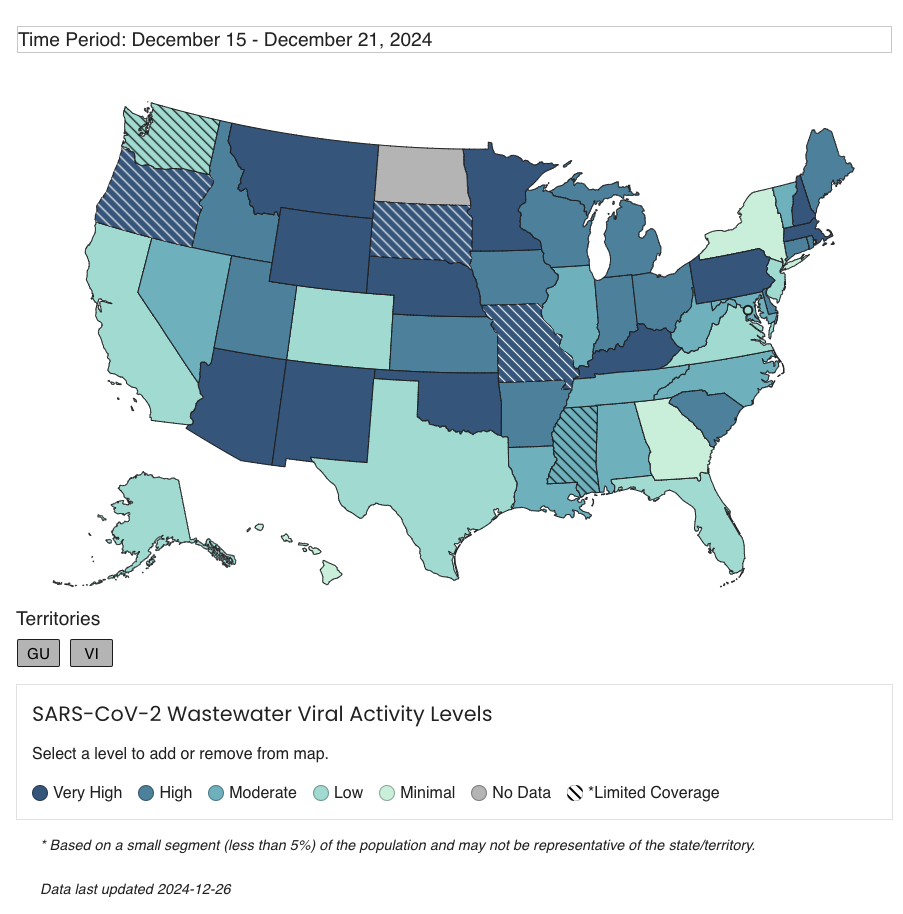
CDC National Wastewater Surveillance System (NWSS) main page has state-level data. 


Click on See the data at the left toolbar and you reach a page where you can select the pathogen and domain to create charts. For instance, here is the regional Covid-19 chart. Note that the CDC website has data until Dec 21. 


California's Department of Public Health has a newly redesigned website and I am still trying to find stuff. I used to visit the Tableau Cal SuWers weekly, but the old link doesn't work or redirect correctly.

New CalSuWers site (made with R Shiny) has data last updated Dec 26. CalSuWers reports to CDC and the national network, so it's showing data that is a bit more recent. 

Read the instructions/caveats. Then navigate to the Regional Data top level page.   Use the menus of the left to select regional or sewage-shed data. Note that this plant last updated data on Dec 31. 


Unfortunately, this data tool only reports Covid-19 data. There's lots more data I found on other sites. 

Members of  the California Water Environment Association collect a lot more data, including research products in partnership with scientists throughout California and the world. 

List of Participating CA Wastewater Surveillance participants

The best site visualization site I can find right now that collates data from around the US is from WastewaterSCAN, a Stanford-Emory led effort. 

Select the region on their national map, then zoom by region and select by sewage plant. 


Click View Chart and you can see Covid-19, RSV, Influenza A or B, Human metapneumovirus, Norovirus, Mpox, EVD68, Candida auris, Hepatitis A (for the Warren facility). The number and type of tests vary by location. The most recent data is from Dec 25. 


Based on positive detections for Hepatitis A in my subregion, I am glad that I started the 3-shot series that combines vaccines for both Hep A and Hep B. Covid-19, RSV, Inf A & B, and Norovirus are all circulating as well. 


Meanwhile, our whole family came down with a cold. We bought the Covid-19 + Inf A + Inf B home test at CVS and we just had a plain old cold. It really ruined our holiday plans. 

Mask up and stay healthy! 

A couple of additional sites:

Inside Medicine COVID-19 Metrics Dashboard by Benjamin Renton

H5N1 Dashboard by Daniel Summers


Friday, October 25, 2024

Open Space is Working Land

The framing of Eastern Sierra housing crunch: With all this open land, why are so many workers living in vans? made me scream internally in rage. 

In Mono County "more than 90 percent of the land is owned by conservation-minded government agencies: the U.S. Forest Service, the federal Bureau of Land Management and, most controversially, the Los Angeles Department of Water and Power." 

Public open land is usually not developed for a reason. Read the legal definition of Open Space. Most importantly, Open Space has value for ecosystem services (that may indirectly help humans). 
Open space for the preservation of natural resources including, but not limited to, areas required for the preservation of plant and animal life, including habitat for fish and wildlife species; areas required for ecologic and other scientific study purposes; rivers, streams, bays and estuaries; and coastal beaches, lakeshores, banks of rivers and streams, and watershed lands.
One of the reasons for acquiring US Forest Service lands is to protect watersheds for downstream users (farmers and urban users). If you don't see any buildings or roads on it, the land is working as intended. I don't want to get into a debate about whether it is appropriate to divert water from the Eastern Sierras for the City of Los Angeles. But, if this is the headwaters for a water supply (one of many) for 4 Million people, it is correct to protect the upper watershed from housing development & the roads necessary to service the housing. The USFS lands protect watersheds for other downstream users, including wildlife and farmers. 

Mono County is over 2 million acres, 94% of which is publicly-owned.  This leaves 120,000 acres of privately-owned land that could potentially be used for housing. About 7,500 people reside in the Mammoth Lakes region and another 35,000 visit annually. You can easily find enough space to house workers if you build densely enough in already-developed areas. The only thing preventing you is imagination and bad zoning. (You will also have to do some infrastructure work, but it will be much less than if you continued the sprawl development pattern.)

The population density of Mono County is 4 people per square mile. Even if you add in visitors (vacation home owners), the density is still < 20 ppl/sq mi. In contrast, my census tract in suburban Los Angeles County has 18,000/sq mi. If you use only the 6% of private land, that's still only ~500 ppl/sq mi. I know that some of the land is not suitable for housing, but there is still lots of room to build infill housing if the local government were to allow it. 


Not allowing denser housing in town, near the jobs, is causing the homelessness euphemistically called "Van Life". Small towns can build social workforce housing so that workers won't have to compete with vacation home buyers. Salida, CO is doing that. They are building UP--allowing mixed use housing above downtown commercial space. They purchased land downtown to build a 100% affordable workforce housing project. Why don't the Mono and Inyo county towns do something similar? Infill workforce housing of < 100 units is exempt from CEQA (Class 32). 

I was incredulous when I learned that the communities did not have public bathrooms and showers. It would not take that much space and $ to build public bathrooms and showers. Colorado mountain towns often have laundromats that sell showers. (So refreshing after a backpacking trip.) Why don't the CA towns build their own public showers or partner with a laundromat to add showers?

Don't whine about others so you can perpetuate sprawl. Make bathrooms and showers available in the short term. Upzone the small towns and keep everything compact, affordable and sustainable. 


Wednesday, August 30, 2023

When too much water leads to water scarcity

 Like clockwork, every time we have a big rainstorm, I read news stories and hear people talk about all the "wasted" water running out to sea or out of the arid area. I understand the frustration, but want to highlight some of the complexities. 

For instance, Southern California received quite a bit of rainfall ~10 days ago as the remnants of Hurricane Hilary swept through. We received 2.5" according to my backyard rain gauge. I'll write more about that in a later post (already started drafting it). 

But, I thought it would be interesting to show what happened near Palm Springs, where Interstate 10 was washed out after the area received half of their annual average rainfall in 6 hours. Interstate 10 was shut down for miles due to flooding and mud

One of the surprising things to water neophytes is that less water is captured in torrential rainfall events than in more normal, smaller and slower rain events. 

This is why water professionals are so worried about climate change. Climate models forecast, and our recent experience verifies, that SoCal will get about the same average annual rainfall as in the past--but it will come in fewer and burstier storms like we experienced in August and January/February 2023. 

In arid climates, it makes more sense to store the water underground to minimize evaporative losses. Palm Springs exists due to a large aquifer and faults that allow the groundwater to seep to the surface. After unsustainable groundwater pumping, the Coachella Valley developed percolation ponds to spread imported river water to refill the aquifers. In this way, the aquifer has stabilized. 


This land works remarkably hard precisely because of it's geology. It has the surface to aquifer connection that allows it to function as a percolation pond. But it's also a transportation corridor because it has the surface water needed by overland travelers. 

Can you see the percolation ponds, wind turbines, solar farm, Interstate 10, and the railroad tracks in this aerial photo? That's five uses, not counting housing and related services. 


You can also see wind turbines in this photo from another percolation pond just to the south of this one. 


The transportation corridor is here because of water, but it's also at risk because of water. You can see the Site of the Original Palm Springs RR Depot in this aerial photo, along with Whitewater Canyon, which feeds the Whitewater River that eventually drains into the Salton Sea. 


It's more dramatic in the terrain contour map. 


The people are here because the water is here. 
The water is here because the mountains are here to squeeze the water out of the sky. 
The mountains are here because the faults are here. 
The water reaches the surface because the faults are here. 

It's all interconnected, but I'm digressing again. 

This is about why we couldn't capture most of the water from bursty rainstorms into the aquifer. 

Turbidity and Water

You know how lake beds have very fine soil impermeable (or only slightly permeable) to water? This allows them to hold the water. Watch Who Fills Your Taps as Kathy Kunysz explains how, when water comes pouring off the mountains, the larger gravel falls out first, and then the finer silt settles into clay layers (aquitards). If you don't keep the finer particles out of your spreading basin/percolation pond, they clog up and cease to function. 


If you don't have time to watch this 75 minute video, you can view the slides


In order to preserve the percolation pond, they had to redirect the muddy runoff AWAY from them, so they didn't capture most of the runoff. This happened in January 2023 and again in August 2023. 

If the rain comes too fast, and the water contains too many fine particles, then you can't capture it in percolation ponds. More and more of our rainfall is going to come from these bursty storms. 

The good news is that they water was diverted around the percolation ponds and sent downstream to feed the shrinking Salton Sea. If we preserve and restore coastal wetlands, that silty water can replenish the marshes, build up the coastline, and help protect us from sea level rise and storm surges. The bursty flows can scour out the waterways, remodeling/refreshing wildlife habitat. 

It's all good. 

Waste is in the eye of the beholder. If you look at it in terms of what's valuable to humans, you aren't seeing the whole picture. 

But, it also means we have to work harder and and spend more money to capture the same amount or less water, due to climate change. The people who told you that we couldn't do anything to stave off climate change because it was too expensive played the American public for chumps and we fell for it. 

Wednesday, August 23, 2023

The ghost of wells past

Remember when I wrote that I wasn't that worried about PFAS chemicals in my drinking water? I'm still not worried about it. But several things stood out when I looked at the 2022 Hermosa Redondo Water Quality Report


I expected to see small (but safe) amounts of Uranium from the imported drinking water purchased from Metropolitan Water District (via West Basin Municipal Water District). That's a blend of Colorado River and Sacramento-San Joaquin Delta water. For myriad reasons, water from the 4-corners states in the Colorado River Basin contains Uranium and Radium. 

But, why does my local groundwater contain more Uranium than the water imported from the states where we used to mine Uranium, and make and test bombs? I posted that question on the social media platform formerly called Twitter and had my answer in minutes. 

I found a map of active water wells from LA County Dept of Public Works. Unfortunately, I couldn't figure out how to download the map and combine it with other data so you'll just see a screenshot. Look at the 3 aqua balloon pins near the right of the map, just west of Inglewood Blvd. 


Now look at the map of Oil Wells (Inside LA County) from City of Los Angeles GeoHub


See the old oil wells that used to operate in the vicinity of the active water wells? 

EPA: Radioactive Waste Material From Oil and Gas Drilling

Rocks in and around certain oil- and gas-bearing formations may contain natural radioactivity. Drilling through these rocks or bringing them to the surface can generate waste materials that contain radioactivity.
I'm drinking a blend of local groundwater and imported river water with an average of 2.3 pCi/L and 1 pCi/L of Uranium respectively. 

The federal EPA Maximum Contaminant Load (MCL) for Uranium in drinking water is 20 pCi/L (one trillionth of a Curie per Liter; a Curie is a measurement of radioactivity). However, there are measurable increases in negative health outcomes for water above the EPA MCL Goal (MCLG) of 0.43 pCi/L. 

This is concerning but not panic inducing (at least for me.) Reverse Osmosis (RO) reduces contaminants in water, including Uranium and PFAS chemicals. RO also reduces the calcium salts responsible for Water Hardness. Anything above 300 ppm (parts per million) is considered hard water. Imported river water is semi-hard, at ~200 ppm, but the groundwater here is 380 ppm. 

I would be happy to pay for RO treatment of household water. The small extra expense would reduce wear and tear on my home's plumbing and my housecleaning time. It's a worthwhile tradeoff. 


[The EIR for West Basin's abandoned plans to build a desalination plant estimated that the RO-treated ocean water would have saved customers an average of $300/year in reduced plumbing and appliance replacement expenses. Coastal NIMBYs enjoying 100% imported river water blocked the plant despite support from inland communities using very hard groundwater like mine.]

Today's LATimes features an excellent profile about Adel Hagekhalil, general manager of Metropolitan Water District of Southern California. He talks about the existing three pipelines that bring water from the Delta, Owens Valley and the Colorado River. He advocated for developing our "Fourth Pipeline" of local water sources. 

I fully support that vision; it's an achievable goal. But let's not kid ourselves that it will be easier or cheaper. There are tradeoffs for everything, as I learned from the Water and Infrastructure Group lecture series I co-organize. Understanding Drinking Water Quality taught me the limits of conservation. Groundwater 101 and Measure W taught me the difficulty of developing *new* groundwater supplies. San Diego's Pure Water and LA County Sanitation Districts taught me the challenges of water recycling. 

I'm willing to pay a little bit more to stop dewatering faraway places, to honor our treaties with Tribes, for higher quality water, and for more reliable and secure water supplies. We have the technology to do all these things, but financing it is going to be the biggest hurdle. Middle and higher income users will be fine. 

But, I ask you to join me in overturning Proposition 218, which constrains our ability to buffer lower income people from the impact of higher utility bills. We need to figure out a way to spread the costs equitably, which includes overturning Prop 218 and securing State and Federal funds to help low-income users. 

Saturday, August 19, 2023

PFOS/PFOA/PFAS

 I was going to title this post "Why I am not freaking out about PFOS/PFOA" but worried that it would be quoted out of context by people who don't read beyond headlines. The point is I am not worried about my personal exposure to PFOS/PFOA because I did a little research and am reassured that I live in an area where my water is safe. But that is not true for everyone. (PFOS & PFOA are a couple of flourinated compounds in the bigger class of PFAS.)

If you live in California, your water provider has to send you an annual Water Quality Report. It's no longer provided in hard copy with one of your monthly water bills. But the link to the report should be listed in one of your recent bills. For instance, read the California Water Service Rancho Dominguez District Hermosa-Redondo System Water Quality Report 2022

Cal Water is a regulated monopoly that tests for PFOS/PFOA and similar flourinated compounds even though they are not required to. From page 10 of my report for Hermosa & Redondo Beach:

In March 2023, EPA issued a proposed national primary drinking water regulation for certain PFAS. The proposed regulation calls for a maximum containment level for PFOS and PFOA of 4 ppt each. Four additional PFAS—PFNA, PFHxS, PFBS, and GenX— would have a combined hazard index limit of 1.0; the hazard index calculation would determine if the levels of these PFAS as a mixture pose a potential risk. 

Knowing that these were constituents of emerging concern, Cal Water proactively tested active sources in our systems for these PFAS years ago. Although not required, we believed it was the right thing to do. In any areas across the state where detections were above levels at which DDW recommends water suppliers take action (the response level), we took the affected sources out of service until treatment was or can be installed. 

None of our active water sources have levels of these six PFAS compounds over current California response levels.

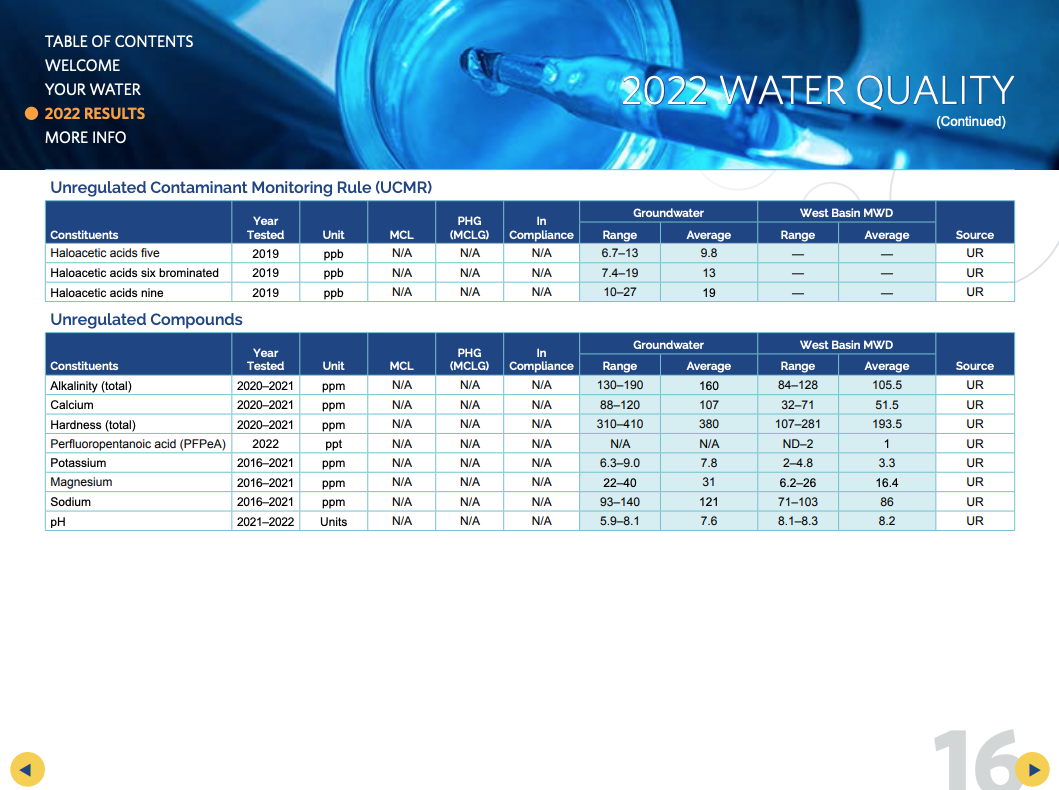
Then on page 16, I can see that my local groundwater has no detectable PFAS and the imported river water (supplied by Metropolitan Water District) has a range of 0-2 ppt (parts per trillion) of PFAS and an annual average of 1 ppt. While adverse health effects can occur with any amount of PFAS above 0, my exposure is very, very small since I drink a blend of groundwater and Metropolitan water. 


 If you live in Hermosa Beach or North Redondo Beach, your water comes from a few wells near Artesia Blvd like this one behind state senator Ben Allen's field office. 


The water is piped to blending tanks behind the new (and fantastic) bakery, Tommy and Atticus


From there, the water is pushed out in distribution pipes to 90278 and 90254. 

What does it mean to take a water source out of service and treat it? 

It means that water from each well is tested and, if it is too high, they stop using that well and serve you cleaner water from another source (uncontaminated well or imported water purchased from MetropolitanWD). 

CalWater found PFOS/PFOA at a well in Montebello (east of DTLA) and took the well off-line in February 2020, and began construction of a facility to remove the contaminants in December 2020. In January 2022, they held a ribbon cutting for the updated facility and returned the well back to service

The technology is simple and well-known. Read the EPA's explainer, Reducing PFAS in Drinking Water with Treatment Technologies

Well water is passed through a bed of Granular Activated Charcoal (GAC), which adsorbs a whole bunch of stuff I don't want to drink (some dangerous, some merely unpleasantly smelly). A regularly refreshed bed of GAC can remove PFOS/PFOA to below detectable levels (ND = none detected). 

But what do you do when the GAC becomes saturated with contaminants?  In the case of a Brita Filter, I toss the old one in the trash, run the pitcher components through the dishwasher to disinfect them, and install a new filter. 

At the water treatment plant, they use a polymer resin to perform anion exchange to pull the adsorbed chemicals off the charcoal. The resin can be incinerated at a high temperature to destroy the PFAS. The charcoal can be reused for years. The resin is expensive and also relies on having access to a high temperature incinerator (which we have in Long Beach with SERRF.) This treatment process adds about $50/AF (acre-foot) to the cost of water, enough for 5-10 people for a year. For a large water system, this is affordable. 

However, PFAS is a problem around the world, including places that can afford charcoal but not the resin. That's why I found so many papers about how to remove PFAS from charcoal using heat so that they can reuse the charcoal. 

Thermal Stability and Decomposition of Perfluoroalkyl Substances on Spent Granular Activated Carbon

Recent advances on PFAS degradation via thermal and nonthermal methods

Thermal destruction of PFAS during full-scale reactivation of PFAS-laden granular activated carbon

I'm happy that all of these papers are open access (doesn't require $$ purchase) because the authors paid for open access. This kind of knowledge should be available to everyone. 

Anyway, back to the LA Times newspaper articles that freaked so many people out  and lacked context. 

Risk of tap water exposure to toxic PFAS chemicals higher in Southern California cites a USGS study that sampled 700 public and private wells around the country. They modeled the characteristics of the sampled wells and estimated that 45% of US wells are contaminated with at least one PFAS chemical.  SoCal wells are more likely to be contaminated due to urbanization (industrial facilities, domestic wastewater) and past foam retardant use (fighting wildfires and at airports). 

Since there is no requirement to test for PFAS, your water supplier may not test for it. So I may not be panicked about PFAS because I have been reading my annual water quality report, but most people never bother to read it. Many people don't even know who their water supplier is, but that's a whole other story.

If you are among the 10 million people in Los Angeles County, the LA Board of Supervisors recently voted to require all water suppliers to test for PFAS chemicals. This won't change my water, but might change yours. I presume that, if they find PFAS, they will be required to remove it before putting it into the domestic water supply. 

If you live in SoCal, your water supplier buys imported river water through Metropolitan Water District either directly, or from a subregional water wholesaler like West Basin MWD at a cost of $1,400-$1,800/AF. Well water costs about half as much as purchased imported river water, if your water supplier owns permits to pump groundwater. Building a GAC treatment facility at $50/AF is worthwhile because well-water is still a bargain compared to imported river water and we have a convenient and safe way to dispose of the PFAS removed from the water. 

I co-organize a monthly series for the League of Women Voters called WIG, the Water and Infrastructure Group. Upcoming discussion topics/speakers, recordings of past meetings/talks and other educational info can be found on the LWV Beach Cities Natural Resources Page


Hopefully, this will inoculate you against sensationalist newspaper headlines like Brita water filter company accused of false advertising. Have you ever installed a Brita filter wrong so that the water runs right through the gaps on the side of the filter? Do you always change your filter as often as the label on it?  I'm fallible. I'm using the Brita filter just to remove unpleasant odors. I expect it to reduce contaminants, but not to remove them altogether. I am running a home kitchen, not a water treatment facility. But I do expect my water company to supply safe water to my home. 

Read your annual water quality report. There are some smaller water systems that can't afford to fancy water treatment systems and are too remote to hook up to cleaner water supplies. Then there are big water systems like LADWP that politically can't raise water rates so they put off maintenance and upgrades. Look at how bad the LADWP water scores relative to other LA County water systems!  (Data and visualization from the CalEnviroScreen 4.0 Indicator Map of Drinking Water Contaminants.)


If I lived in the City of LA, I would be writing my council members and to the press every week. This is just so embarrassingly bad. (Fortunately, CA drinking water is very clean on a national scale, so you can be in the worst tenth (like LADWP at 90th percentile for CA) and still pass all federal EPA standards. But, for a large water system in an urban area, this kind of water system neglect is just inexcusable. 

Come to WIG on second Thursdays of each month at 7 pm on Zoom. Learn more about water and all sorts of other things that make our area run smoothly. Ask questions and get answers. 

Friday, December 23, 2022

Destroying the NIMBY Sewage Capacity Talking Point: Another Zombie Myth

Meta:

I was coached to give an executive summary so people know where I am going. 

Executive Summary

  • Sewage Capacity is not a reason to deny infill housing in established areas of Los Angeles County. 
  • It's cheaper to service sewage from infill housing than for sprawl housing because you are using capacity that already exists and is currently underutilized. 
  • Infill housing reduces or eliminates the cost of declining water flows, reducing costs to existing residents.  
  • Infill housing spreads the fixed costs of infrastructure among more customers, reducing costs to existing residents

And was also told to add more color pictures, like this One Water Cycle graphic by Brown and Caldwell, 2017. 

Where I normally start my ramblings:

After I signed that petition, Change.org offered me another one to consider. 

Their algorithms offered me Oppose the mass build apartment complex on Little Britain Rd (Rt 207)


It was such a classic display of NIMBY Kettle Logic about horrible traffic and parking woes, which they themselves contribute towards. This area is simultaneously such a historic area that it should not be desecrated with more traffic, while it is already so traffic-choked, that it cannot accommodate one more car.

But, since I had just been thinking about the societal impacts of chemistry and engineering, I homed in on the arguments about sewage. 

  • A massive build like the one being proposed will dramatically change the character of our neighborhood.
  • It will also have a significant impact on traffic in the surrounding area.
  • It will further tax our already heavily burdened water and sewage systems, and potentially have damaging environmental impacts to the Quassaick Creek and its wildlife.
The build puts additional strain on the current water supply and added pressure to the city sewage system’s downstream capacity.
Residents in the town of Newburgh are currently nearing our maximum agreed sewage usage with the city.
...
In 2004 the town updated their intermunicipal sewer agreement with the city to increase the amount of sewage the town sends to the city treatment plant at 2,000,000 gals/day with the ability to send an additional 2,000,000gals/day providing the town pay to enlarge the current city facility. This previously cost taxpayers $1,250,000 to construct the necessary facilities. According to the November 3 town planning board minutes, the town is currently sending 2,000,000 gals/day already and at their first allotment. They have 2,000,000 more gallons owed to them, but much of that has already been allocated to other projects.
As stated in their draft scope, the proposed apartment complex would produce an estimated 28,380 gals of liquid waste per day. And according to the 2004 intermunicipal contract "when the town’s average flow exceeds 3.4 million gallons per day as evidenced by the last 90-day average flow" a second expansion will need to be constructed by and paid for by the town residents, unless we insist the cost be passed on to the builders of these new projects.

The US Census office estimates that Newburgh, NY has a 2021 population of 28,834. 

If 28,834 people send 2,000,000 gals/day of sewage to the treatment plant, that's 69.4 gallons per capita per day (gpcd). How many times are they flushing every day?!?! Or do they have many industrial facilities? Why are they using so much water?!?!

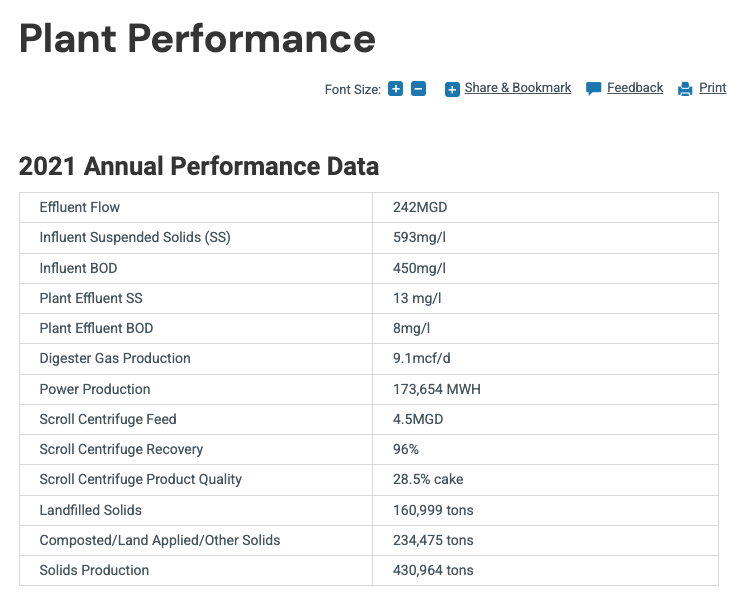
In contrast, 4.8 million Los Angeles County residents and a lot of businesses & industrial facilities sent 242 MGD of sewage (in 2021) to the Joint Water Pollution Control Plant (JWPCP), 50.4 gpcd. 

If Newburgh residents were as water-thrifty as Angelenos, they could house 10,000 more people and have cheaper sewage service as well because they would be spreading fixed costs among more customers. 

JWPCP has a design capacity of 400 MDG, we've added ~1 million people to the service area in the last 20 years, and we are still using only 60% of the capacity. We can add millions more residents without needing any more sewage treatment capacity. 


JWPCP is a huge plant that serves almost half the people in the most populous county and one of the largest manufacturing centers in the US. 


If Newburgh residents were really concerned about not overrunning their sewage capacity, they should look at water saving household appliances, low-flow toilets and low-flow shower heads.  But, perhaps they are just not interested in providing homes for people. 

They do seem interested in providing homes for cars. One of their objections to this apartment complex is that it will only provide 515 parking spots for 259 homes. 

Enough poking fun at Newburgh NIMBYs. We have plenty of NIMBYs at home in Los Angeles County to poke fun of. 

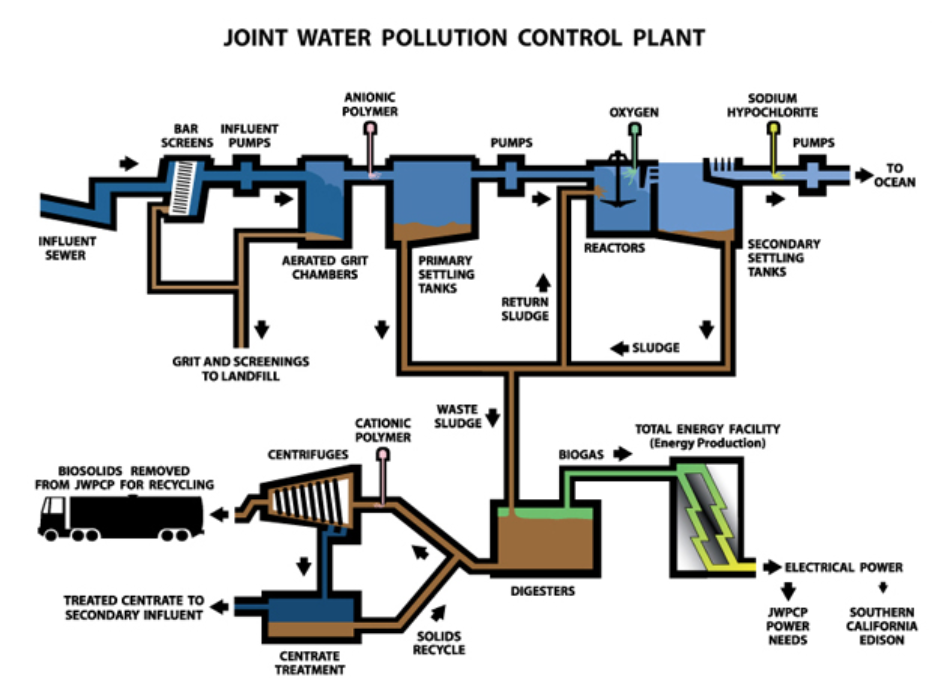
Gratuitous diagram of JWPCP, a social network tying together 4.8 M Angelenos


Consider the problem of declining water flows. This is a serious and expensive problem for established areas that are not building housing fast enough to offset improvements in water efficiency.  Californians in existing developed areas are using about 2% less water per year. If that is not offset by infill, this causes problems for both drinking water and sewage systems. 

California Urban Water Agencies surveyed their members and wrote a white paper on Adapting to Change: UtilitySystems and Declining Flows. Go to Section 6 (page 22), Impacts of Declining Flows on Wastewater Treatment Plant Operations. 40% of urban systems reported effluent quality problems. 

Lower flow means longer residence times in the sewage pipes, which exacerbate production of gases. That's both an odor and a corrosion problem. It also decreases the amount of hydraulic pressure, which works with gravity to move sewage towards the treatment plant. 

In fact, the less hydraulic pressure you have, the more energy you need to apply (e.g. sewage lifting stations) to push the effluent along. We have so much excess capacity in our existing sewage mains, it's costing us more energy to pump it to the treatment facilities.  

You also need to spend more unclogging pipes. We sometimes have to put fresh water into the sewage mains to reduce the residence times, clear clogs, and provide hydraulic pressure. 

We'll save the problem of declining flows on drinking water systems for another day. Spoiler, it's cheaper and safer for everyone if we concentrate new residents in existing areas rather than build new sprawl. 

Bonus Sewer Content:


* C&EN News = Chemical and Engineering News is the monthly general interest magazine for members of the American Chemical Society. Bad Dad and I both hold BSs in Chemistry and he also has a PhD in Chemistry (while I hold a PhD in Chemical Physics). Although our work is far from what most people consider chemistry, we still enjoy learning about happenings in the Chemistry world and the policy implications and societal impacts of Chemistry. Editorial leadership of C&EN News eliminated coverage of science policy and societal impacts. Sign the petition if you disagree

Wednesday, July 27, 2022

Neighborhood Defenders Wrong Again

Neighborhood Defenders bring up aesthetics, the environment and property values as reasons to oppose things.  There are quite a few in my city (and likely yours, too). Sometimes, it seems like nothing must ever change or else we will incur their wrath.  I've been begging for bike lanes for 25 years, to no avail. Bike lanes must never take away on-street parking (mostly FREE PARKING) so they don't get built. Instead, we'll just keep making blood sacrifices of our children on the streets

Anyway, I digress. This is a blog post about electricity and pollution. But I have to digress a little bit longer first. 

Since 2019, I have been a director on the boards of both League of Women Voters of the Beach Cities and of Los Angeles County. Due to my science background, I was assigned the Natural Resources Portfolio.

I've been passionate about water and the environment since I took Field Biology in high school. So I also joined the LWVC Water Committee. I was a little bit too outspoken at the Water Committee meetings because I ended up being assigned to write nearly half the Overview of California Water articles, including the one on the Water-Energy Nexus.

This led the LWVC chair of Natural Resources to ask me to serve as her deputy in the area of Energy/Electricity.  Thus, I found myself the Energy Subcommittee team leader. I promptly ordered and read a bunch of books about energy and clean energy in particular. It's a fascinating topic. I never imagined that I would know the names and boundaries of the regional balancing authorities of The Grid, or that I would have opinions on their governance.  But, I do now.  ;-)

Back to electricity. 

There's been a spate of articles lately about the fate of a handful of power plants along the California coast that use ocean water for cooling. OTC (Once Through Cooling) plants have to suck in large volumes of ocean or river water, which can suck in small sea/aquatic life. That is totally no bueno.

At one time, we had quite a few of them. They sit on prime ocean-front land so their real value is often more due to real estate than power production. OTOH, they also have infrastructure, such as existing transmission lines, that would be difficult to assemble today. 

How a beachfront gas plant explains California’s energy problems lays out some of the issues. 

So I started researching the fate of the OTC plants that are no longer using ocean water for cooling. It turns out that I didn't have to look far. In 2013-2014, a similar power plant just a few miles to the north, the El Segundo Energy Center, was repowered* from Boiler-type OTC to a dry-cooled Combined Cycle Gas Turbines (CCGT). 

* Repowering means updating an older power plant with newer equipment that is more efficient and pollutes less. Switching from a gas boiler system to CCGT yields 50-70% more energy per amount of gas burned or per molecule of CO2 produced. They can be powered up in 20-30 minutes compared to many hours for older boiler plants.  

Newer Reciprocating Internal Combustion Engines (RICE) can be powered up in 2 minutes, meaning they can react quickly to things like the marine layer moving in and decreasing local roof-top solar power output. RICE are air-cooled, yielding substantial water savings of millions of gallons per day. 

You know how much I love data. I discovered the EPA Clean Air Markets Program Data Portal (aka Cap and Trade). I looked up the characteristics and 2021 data for five area power plants, including the repowered one in El Segundo and AES Redondo Beach. 

The comparison is stark! On every pollution metric, AES RB is much, much worse than ESEC--about 2-3.5x as much pollution per unit of power, over the course of a year, and it operates 4x as many hours.

I summed up the data from Jan 1, 2021 to Dec 31, 2021 to get an idea of how much power and pollution each plant puts out in a year.  

Each Facility/Power Plant has more than one generator. They turn on the amount they need to meet the anticipated electricity demand/load. No one wants to burn more fuel than they need to because that's just burning money.  

El Segundo has 2 generators, Redondo Beach has 3. Operating time is summed up over generators. If all 3 are running for one hour, that's 3 hours of operating time. 

Gross load is how much power they are making. 

Despite providing comparable amounts of power over the course of a year, the older AES RB plant puts out 2x the SO2 and CO2 and 3.5x the NOx than the AES plant. It also operates over more hours. (Click on the table to enlarge it.)


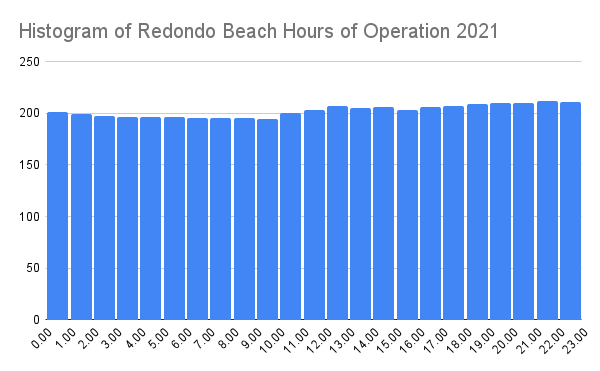
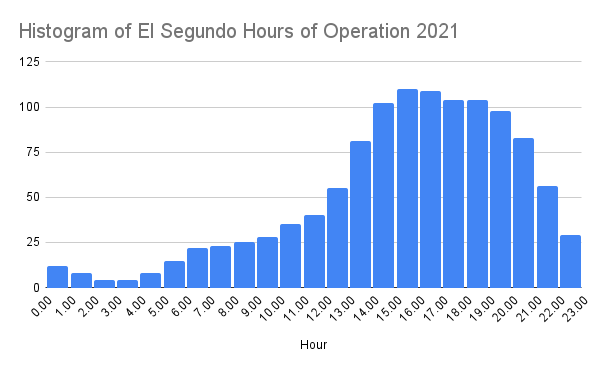
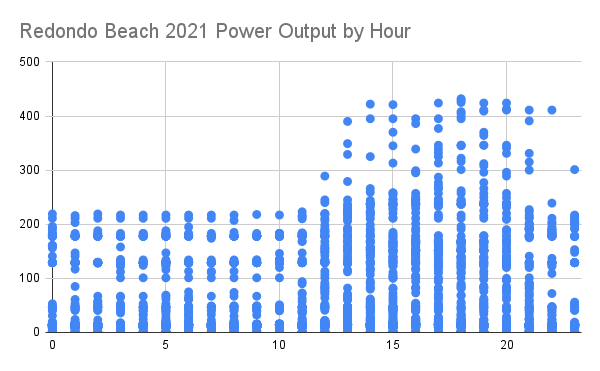
I made histograms for hours of the day that each plant ran.  Redondo Beach, which has the older boilers, has to run pretty much continuously to keep warm so that they can deliver electricity during the peak demand hours on hot summer evenings. Incredibly wasteful and polluting. 

El Segundo EC can ramp up and ramp down each day that it runs. Notice the vertical axes on AES RB are 2x higher. ESEC has 2 generators, running an average of 50 days a year, mainly during the late afternoon and evening hours. It shuts down at other hours because it can.  Saves money, saves CO2/SO2/NOx. It's just better all around. 

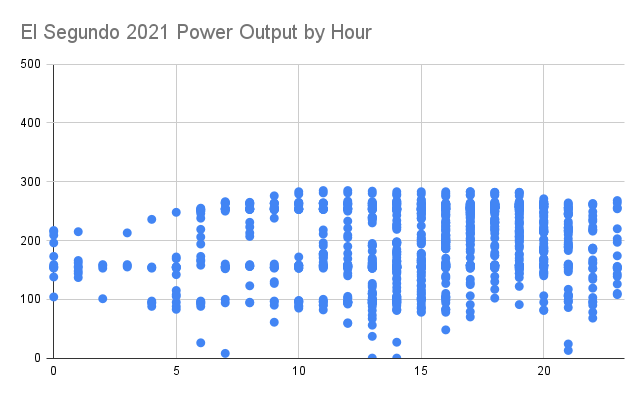
I made a scatterplot of power output by each hour of operation. Redondo Beach operates a lot of hours with low power output. (This is summed up over all generators. Sometimes, 2-3 generators are working at the same time.)


El Segundo rarely operates both generators at the same time. It also runs some warm up hours with little power output, but uses a lot less gas to do it at those times (if you look at the full data). 


Nameplate capacity is how much power a plant can generate, if it ran at full tilt. ESEC has a nameplate capacity of 560 MW with both generators operating. They ran one for part of 538 hours and the other for 626 hours.  There are 8760 hours/year. If it ran at full capacity the entire year, it would generate 4,905,600 MWh of energy. It generated 227,487 MWh in 2021, so it ran at .046 capacity factor in 2021. ESEC is an example of a "peaker" plant, that runs only when the grid demand is high.

AES RB is another peaker plant. Nameplate capacity is 496 MW so annual capacity is 4,344,960 MWh. It generated 251,192 MWh for .058 capacity factor. 

There are activists who want to block all fossil fuel investments. That's seductive because why would people spend money on something that they are going to idle most of the time? If we have it, we will use it. Right?

Induced demand has been shown to apply to car traffic. When you add a lane (like we did to the 405 freeway), then more people drive until the congestion is just as bad or even worse than before. If there is parking at a destination, people tend to drive. If there isn't, they tend to find another way to get there (e.g. transit for DTLA or bikes for the beach).

The converse is also true. When you make driving a hassle, people do it less. If people don't have cars, they make fewer trips. If they are thinking of driving somewhere, and that place doesn't have parking, they may forgo the trip rather than deal with the hassle. 

So, if you have a car, how often do you use it? The answer is ~5% of the time, about the same percentage of time as a peaker power plant!

Does induced demand work for natural gas power plants? Do operators have the self control to build new, highly efficient and clean ones, and then let them sit idle most of the time? ESEC spent $ rebuilding the power plant, but they run it profitably by only running it during the hours when power buyers are paying the highest prices. They also installed advanced emissions controls. Under cap and trade rules, they can sell emissions credits to other operators. 

AES Alamitos and Huntington Beach are much bigger plants and serve "baseload" instead of running only at peak demand times. AES proposed another peaker plant in Redondo Beach. The question becomes, do you think that AES will adhere to the plan they submitted? 

CAISO (California Independent System Operator) runs the CA Grid and has the authority to tell power plants when to operate, when to curtail/go offline. Do you think that CAISO, the Coastal Commission and the CPUC (CA Public Utilities Commission) would allow AES RB to deviate from their plan/permits? Would they all be in on the same conspiracy? I trust not, but I know that many of the voices that carried the day did not feel the same.

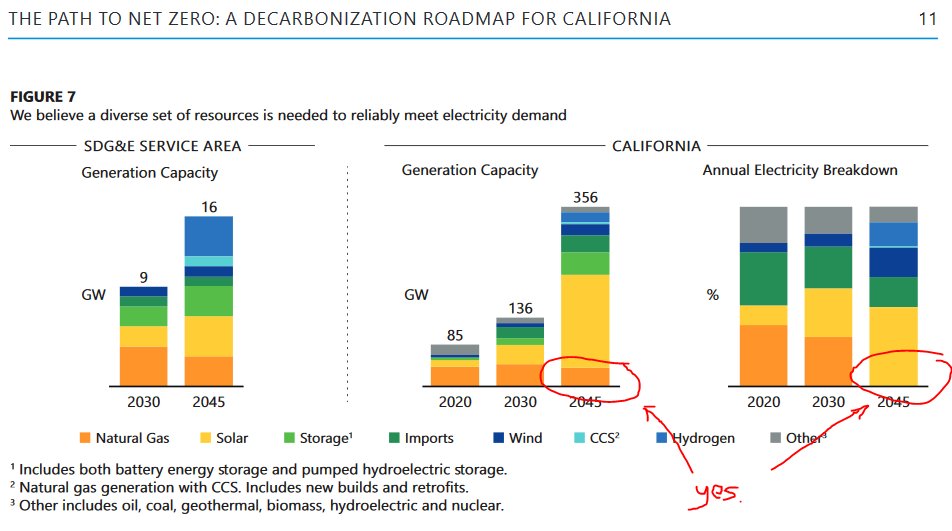
Here's something in a report from San Diego Gas & Electric. See how the generation capacity of gas power plants remains high, but the amount of electricity produced from them ramps down over time? That's due to California's Renewable Energy Portfolio Standards (RE PS). Power producers are required to serve more Renewable Energy over time. Even if they are tempted to run their gas plants more to recoup their investment, they really can't. 


In the future, with high integration of renewable energy sources, all gas plants will operate as peaker plants. If they can't be nimble enough, they will be retired. It's the most rational and economic choice. It's also the only way they will meet California's RE PS which is the law of the land. 

However, if they don't make the investment in modern facilities that can ramp up and down in minutes, the old technology requires them to run many more hours than needed, burning more gas and generating more pollution along the way. 

These old plants are so, so bad. They aren't responsive enough to serve the needs of today's grid with high renewables content. They are wasteful of money and fuels.  They generate high amounts of pollution per unit of energy. They require water in a water-scarce region. The OTC plants are even worse because of their ocean water intakes. 

So why wasn't AES Redondo Beach repowered? AES tried. But there was so much opposition from Redondo Beach leaders, they gave up. RB Patch covered it pretty thoroughly and doesn't have a paywall. 
AES officials say the new plant will run more efficiently, have a smaller footprint and provide flexibility for the grid when energy from renewable resources isn't available. 
Opponents, on the other hand, argue that the plant will continue to decrease property values and blight the waterfront, despite a $300 million revitalization effort. Additionally, they point to AES' application and say a new plant will run more often than the current one, and thus produce five to 15 times more particulate pollution.
Anyway, for almost a decade, Redondans have suffered 2-3.5x more pollution than we would have if AES RB had been repowered to the same scale and technology as ESEC. We lived with more noise as the proposed upgrade would have been enclosed to contain sound and ran much fewer hours/days. We also  continued sucking marine life into the water intakes. 

All for what? To say we won? To say that we stopped AES? To cost AES money? 

It certainly didn't help the marine life or reduce CO2/SO2/NOx emissions. 

It didn't have to be this way. 

(I'll write about Grayson another day as it's past my bedtime.)

Monday, June 20, 2022

Rhetorical Tricks: Water Edition

 Sometimes, I read something that makes me so mad, I dash off a quick email to a friend who gets it. This time, I sent it off to the entire LWVC googlegroup and got some 'attagirl' affirmations back. So, let's share this take down. 

First, read These five people could make or break the Colorado River. Do you see what is wrong with this quote by one of the five people, Imperial Irrigation District (IID) commissioner J. B. Hamby? 

Hamby also pointed to the huge amounts of water that are still wasted, in his view, in cities such as Los Angeles. "It’s very easy to point at the alfalfa field, but what about drying out the lawns and useless grass?"

 The Colorado River (CR) is subject to all sorts of unrealistic math, well-documented elsewhere. We have these benchmark Colorado River allocations based upon 16.5 Million Acre Feet (MAC). Mexico gets 1.5 MAF, and the Upper and Lower Basin states get 7.5 MAF each. 

California gets the lion's share. In the benchmark scenario, farmers, mostly the IID, get 3.85 MAF out of California's 4.4 MAF. The remaining 0.55 MAF goes to the Metropolitan Water District (MWD), who sells it wholesale to 19 Million urban users based on a system of rights allocated decades ago.  It's roughly a 70/30 split between farmers and urban users before water rights transfers. (Cities buy about 0.5 MAF of CR water allocations from farmers.)

In practice, the CR does not have that much water and IID gets around 2.5-2.6 MAF and the cities get about half that, and then purchase more from farmers. 

IID commissioner Hamby pointed to LA lawns in a rhetorical trick called misdirection. It's often employed by magicians so you don't look at what they are really doing. 

Let's do the math! 

If we take him literally, let's run the numbers for the City of Los Angeles' Department of Water and Power, LA DWP. 

IID receives 2.5-2.6 MAF from the CO River. LADWP uses 0.5 MAF/year from all sources and serves 4 M people. An acre-foot serves 8 Angelenos for an entire year. (An acre foot serves 20 apartment dwellers in new, efficient homes!) 

About half is imported river water purchased from Metropolitan. 0.25 MAF The exact mix of SWP and COR water each year varies based on availability, but figure half on avg. 0.125 MAF 

City of LA residents are pretty water thrifty. About 1/3 might be outdoor use (perhaps 1/4). Not all of the outdoor irrigation in LA is lawns. Trees and shrubs are necessary to improve urban livability. 

Even if it were all lawns, we're down to (at maximum) 0.125 MAF/3 or 0.04 MAF compared to 2.5-2.6 MAF for the farmers of the IID. 

Anyway, finger pointing is a standard rhetorical trick to hijack the discussion. As always, verify. Does not pass the sniff test. 

Hamby said some other whoppers, which I won't go into here until I finish some other work with real deadlines. 

Tuesday, March 22, 2022

World Water Day 2022: Groundwater

We've circled the sun one more time to another World Water Day. This year, the theme is Groundwater. 

I co-organize a monthly (Zoom) series for the League of Women Voters of Los Angeles County that grew out of a one-time water walking tour I led in the Beach Cities. We record and post all the Water and Infrastructure Group (WIG) lectures along with the slides. Occasionally, I add articles about what we learned or add further information on each month's subject. 


Mr. Matthew Hacker is a registered geologist in California and is currently a Senior Resource Specialist at the Metropolitan Water District of Southern California. He has more than 27 years of experience in water resources planning and local resource development in the areas of groundwater, stormwater, and water recycling. Currently, he is striving to create a more resilient water future for Southern California through innovative new projects such as Metropolitan’s groundbreaking Regional Recycled Water Program. 
His prepared talk is under an hour, half the video is Q and A. 

One fascinating thing I learned is that Metropolitan stores imported river water in the vast LA coastal aquifer. That water we pump out, treat, and deliver to our homes, may have originated in Northern California or Colorado. 

You can learn more about that by watching the Who Fills Your Taps? Video or reading the Who Fills Your Taps? Slide Deck. This is a marathon one that is better ingested in two bites. WIG co-organizer, Kathy Kunysz, is a scientist & planner who has had a long & varied career in water. She knows so much, it's an honor and an education to co-host this series with her. 

Tuesday, January 04, 2022

New Construction Subsidizes Old

I was reading city council minutes and my head was going to explode with all the coded things that some council members were saying. In one discussion, Council Member NN wanted to impose Quimby Fees on the theory that newcomers have not been paying taxes into the community and should have to buy their way into the parks and other amenities of this city. That is, they didn't pay for the park purchases so they shouldn't get enjoyment until they pay their debt to existing homeowners. 

This is so nonsensical, because, he then talked about using the Quimby Fees to buy new parks or to maintain existing parks. That sure sounds like he wants new construction to subsidize old homes, not the other way around. Hmm. Coincidentally, he wants nearly all the new housing (and Quimby Fee payers) next to the freeway in the extreme NE corner of the city while using their Quimby money to purchase parks in the coastal southern area of the city that he represents. 

BTW, the southern end of our city has been identified as a Racially Concentrated Area of Affluence. In a county that is 26% non-Hispanic white, he represents census tracts that are currently over 80% non-Hispanic white (and formerly whites-only on HOLC "red line" maps.)


Back to this idea that new construction doesn't pay their fair share for infrastructure, let's take a look at this screenshot from the California Property Tax Viewer

Take a look at the mixed use building with 48 homes, 8 affordable (hence, lower green property tax flags). There is also a garage and several businesses, generating more property and sales taxes since 2011.  200' by 120' = 24,000 sf. One condo unit is paying $7,200/yr in property taxes. 

Look at the single family home (SFH) behind it on a 50' by 150' = 7,500 sf lot.  It pays only $1,300 in property taxes each year or about 18% as much as one of the 48 condos. It was built in 1953 so it's been paying property taxes for 67 years.

Let's do a back of the envelope calculation and just use ratios.  One ten year old condo has already paid as much in property taxes as the older house has in 55 years.  Plus, our city charges Quimby Fees of $25,000 per net new home and a bunch of other fees totaling about $29,000.  That adds up to another 22 years of taxes from the old house. 

And that thing about sewer lines?  Complete nonsense.  Our water and sewer mains run down the street and maintenance costs go by the frontage.  That old house sits between a 6-plex on one side and a duplex on the other, each on the same 50' wide lot.  

Our sewers are run by the LA County Department of Sanitation and we're charged per hookup.  The infill townhomes are paying 2-6 times as much to maintain the sewers as the old SFH. The mixed use development has about 50 hookups on 200' so they are paying 12.5x as much for our shared infrastructure.  

The water and infrastructure myth is even more pernicious in light of water conservation (which is a good thing!) Read Adapting to Change: Utility Systems and Declining Flows. As we conserve water, the residence times in the water pipes increase, sometimes too long to be safe.  Infill housing, if it adds more people, can help keep the water residence times safe.  

If you don't add enough infill housing, you end up in San Diego's fix.  In just a few years, the cost of expensive potable water (imported from the Colorado River) they had to flush to keep their domestic water safe has increased from $200,000 to $2,000,000/year. 

Speaking of flushing, water-saving appliances and toilets mean that sewage outflow is lower volume and thicker than in the past.  That requires more energy to pump it back to the sewage treatment plant.  If managed well, infill housing can offset declining flows, save energy and reduce clogging.

Infill housing helps in two ways.  It gives you more customers to share the cost of maintaining infrastructure. And it also offsets declining flows for both inbound potable water and sewage.

That SFH is the deadbeat in the picture.  Long live infill!

Monday, March 29, 2021

Plastic

I vent sometimes on Twitter. Earlier this month, I ran a Twitter poll and learned how hard it is to write an unambiguous multiple choice question.


Is plastic petroleum?

Of the 164 votes, 

  • 72.6% chose "Yes, duh"
  • 3% chose "No"
  • 4.3% chose "Don't know"
  • 20.1% chose "Not enough info to answer"
It's a good thing that I don't have to come up with a grading rubric for this question because you can make a valid argument that any of the choices are correct. 

I started to write an explanation for the answer, but it became quite a long thread.  Since it took so much research and time, it deserves to be put up on the blog.

Until 2 years ago, I didn’t know that materials scientists consider plastic a property instead of a material. You can make plastic from all sorts of polymers that are soft when warm and rigid when cooled. Eg potato starch plastic. 2/ 

Most plastics used in the world are made from fossil hydrocarbons, typically ethane. It used to be made mainly from petroleum distillates but is now often made from fossil gas aka natural gas. 3/ 

Worldwide, plastics use is increasing alarmingly. We should question whether we really need to consume so much. But, in the US, our car dependence is a much, much bigger problem. Landfilled plastics are sequestered. Gas tank hydrocarbons get burned and add CO2 to the atmosphere 4/ 

4/ Quote Tweeted this AirQ thread about how CO2 is lower on weekends because people drive less.


I’m not a big plastic user and live in a community that supports reduce, reuse, recycling. Angelenos produce much less garbage than US avg. Many areas, including mine, haul away yard and kitchen waste for industrial composting. Our recyclables are collected, sorted and recycled 5/ 

The rest of our trash is incinerated at SERRF on Terminal Island, Long Beach. It generates electricity for SERRF and feeds the grid. The ports of LA/LB use a lot of electricity 24/7 so this is synergistic. My city diverts 74% of waste (typical for LA County) and burns the remaining 26% 6/ 

(Our regional solid waste stream is also smaller than the US avg due to state/local government policy choices. Our family also made lifestyle adjustments to reduce it even further. The main driver is that government policies support solid waste reduction.)

I’m still using a roll of Saran Wrap purchased 10 years ago. I used Parafilm in lab when I needed it. I have zero guilt about using plastic when I need it. Right now, my trash is full of takeout containers from local restaurants that need our support during the pandemic 7/ 

Try to reduce single-use plastics in your day to day life as much as you can. Carry that refillable water bottle daily, but keep a case of water bottles in your earthquake kit. The American Chemical Society devoted a special issue to plastics recycling 8/ 

In short, mechanical plastics recycling chops up the long-chain polymers and weakens plastic. So, the current methods of plastics recycling, where new and old plastics are mixed together, is not closed loop or sustainable. Eventually, the plastic will be too weak to do its job of holding stuff. You don't want a container that breaks unpredictably.
THE DYSFUNCTION OF PLASTICS RECYCLING Plastics recycling, as it exists today, is a mess. In 2015, the US recycled only 9.1% of the 31 million t of plastics that consumers threw out, according to the Environmental Protection Agency. The vast majority ended up in either landfills or incinerators. In contrast, two-thirds of paper, a third of metals, and a quarter of glass were recycled that year. In the European Union, about 14.8% of the roughly 27 million t of plastic waste was recycled in 2016, according to the European Commission.
But, there's active research into using enzymes to break down plastic back to its pre-polymerized raw feedstock shape. About 40% of it will remain, but it can be turned into low-sulfur diesel fuel--not a bad fuel for long distance trucking or ocean-going cargo ships which operate away from urban areas. 

One of my husband’s former classmates at MIT is working on enzymatic fuel production from plastics and agricultural waste. I am optimistic about the technology, though it is still too expensive. 9/ 

Driving an ICE car is single use petroleum. Using plastic, even if it is incinerated after 1 use, gets 2 uses out of the material. If it is landfilled, it is at least sequestered vs burned and released into the atmosphere 10/

Gasoline accounts for 45% of US petroleum use while all chemical feedstocks (paint, solvents, cleaners, pharmaceuticals, plastics) account for 1.5% https://eia.gov/energyexplained/oil-and-petroleum-products/use-of-oil.php 11/


In summary, that smarty pants state senator is operating on old information. Plastics are made from a variety of sources & petroleum is one of the top 2. Plastics in waterways is a problem, but tire particles are the overwhelmingly major source 12/ 

[oops, I skipped 13/]

EVs, because of their weight, increases tire wear, exacerbating water and air pollution https://greencarreports.com/news/1127424_study-particulate-emissions-from-tire-wear-is-higher-than-from-tailpipes 14/ 

I wrote a detailed blog post about this 15/ Leaf blowers, street sweeping, car tires, fish and you

“Non-exhaust emissions...are currently believed to constitute the majority of primary particulate matter from road transport: 60% of PM2.5 and 73% of PM10.” https://tiretechnologyinternational.com/news/regulations/pollution-from-tire-wear-1000-times-worse-than-exhaust-emissions.html 16/

Under-inflated tires are a huge contributor to tire particles. Remember the Ford Explorer rollover scandal? SUVs are top heavy. To reduce rollover risk, they use special tires that don’t burst when inflated much lower than passenger car tires 17/ 

SUVs and pickups need larger tires, often at lower pressures, so they don’t roll over. Want to know why our regional PM 2.5 just keeps increasing? The answer is almost always cars, especially SUVs. Electric SUVs are greenwash. Electric bikes/trikes in every garage instead 18/fin

I'm not the only one who sees EV-only approaches without remaking our streets to help us move out of cars as greenwash. 

Tackling the climate and air pollution crises requires curbing all motorised transport, particularly private cars, as quickly as possible. Focusing solely on electric vehicles is slowing down the race to zero emissions. 
Only getting out of cars will solve the urban particulate air pollution, road congestion and parking/land use problems. I said URBAN. Rural areas have different problems and different solutions. But, since California is the most urbanized of all US states and Los Angeles is among the most urbanized of all CA and US counties, this is what we need to do right here, right now, where I live. 

10 Million people live in Los Angeles County, 5.6x as many people as Idaho. So I don't want to hear any critiques along the lines of this will not work in Boise or on my Montana ranch. The Netherlands has a bike culture with just 511 people per square kilometer vs 905 for Los Angeles County. 

Sure, NL is flat and LA is surrounded by steep mountains. But that also means we live more densely because most of us live in the flatter broad valleys and coastal plains. Ebikes flatten the hills anyway.  It sure does rain a lot more in NL, though.

Followup 10/1/21 
The US Department of Energy, who runs the National Renewable Energy Laboratory, started a new program to fund research in chemical recycling of plastics.