Neighborhood Defenders bring up aesthetics, the environment and property values as reasons to oppose things. There are quite a few in my city (and likely yours, too). Sometimes, it seems like nothing must ever change or else we will incur their wrath. I've been begging for bike lanes for 25 years, to no avail. Bike lanes must never take away on-street parking (mostly FREE PARKING) so they don't get built. Instead, we'll just keep making blood sacrifices of our children on the streets.
Anyway, I digress. This is a blog post about electricity and pollution. But I have to digress a little bit longer first.
Since 2019, I have been a director on the boards of both League of Women Voters of the Beach Cities and of Los Angeles County. Due to my science background, I was assigned the Natural Resources Portfolio.
I've been passionate about water and the environment since I took Field Biology in high school. So I also joined the LWVC Water Committee. I was a little bit too outspoken at the Water Committee meetings because I ended up being assigned to write nearly half the Overview of California Water articles, including the one on the Water-Energy Nexus.
This led the LWVC chair of Natural Resources to ask me to serve as her deputy in the area of Energy/Electricity. Thus, I found myself the Energy Subcommittee team leader. I promptly ordered and read a bunch of books about energy and clean energy in particular. It's a fascinating topic. I never imagined that I would know the names and boundaries of the regional balancing authorities of The Grid, or that I would have opinions on their governance. But, I do now. ;-)
Back to electricity.
There's been a spate of articles lately about the fate of a handful of power plants along the California coast that use ocean water for cooling. OTC (Once Through Cooling) plants have to suck in large volumes of ocean or river water, which can suck in small sea/aquatic life. That is totally no bueno.
At one time, we had quite a few of them. They sit on prime ocean-front land so their real value is often more due to real estate than power production. OTOH, they also have infrastructure, such as existing transmission lines, that would be difficult to assemble today.
How a beachfront gas plant explains California’s energy problems lays out some of the issues.
So I started researching the fate of the OTC plants that are no longer using ocean water for cooling. It turns out that I didn't have to look far. In 2013-2014, a similar power plant just a few miles to the north, the
El Segundo Energy Center, was repowered* from Boiler-type OTC to a dry-cooled
Combined Cycle Gas Turbines (CCGT).
* Repowering means updating an older power plant with newer equipment that is more efficient and pollutes less. Switching from a gas boiler system to CCGT yields 50-70% more energy per amount of gas burned or per molecule of CO2 produced. They can be powered up in 20-30 minutes compared to many hours for older boiler plants.
Newer
Reciprocating Internal Combustion Engines (RICE) can be powered up in 2 minutes, meaning they can react quickly to things like the marine layer moving in and decreasing local roof-top solar power output. RICE are air-cooled, yielding substantial water savings of millions of gallons per day.
You know how much I love data. I discovered the
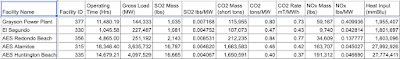
EPA Clean Air Markets Program Data Portal (aka Cap and Trade). I looked up the characteristics and 2021 data for five area power plants, including the repowered one in El Segundo and AES Redondo Beach.
The comparison is stark! On every pollution metric, AES RB is much, much worse than ESEC--about 2-3.5x as much pollution per unit of power, over the course of a year, and it operates 4x as many hours.
I summed up the data from Jan 1, 2021 to Dec 31, 2021 to get an idea of how much power and pollution each plant puts out in a year.
Each Facility/Power Plant has more than one generator. They turn on the amount they need to meet the anticipated electricity demand/load. No one wants to burn more fuel than they need to because that's just burning money.
El Segundo has 2 generators, Redondo Beach has 3. Operating time is summed up over generators. If all 3 are running for one hour, that's 3 hours of operating time.
Gross load is how much power they are making.
Despite providing comparable amounts of power over the course of a year, the older AES RB plant puts out 2x the SO2 and CO2 and 3.5x the NOx than the AES plant. It also operates over more hours. (Click on the table to enlarge it.)
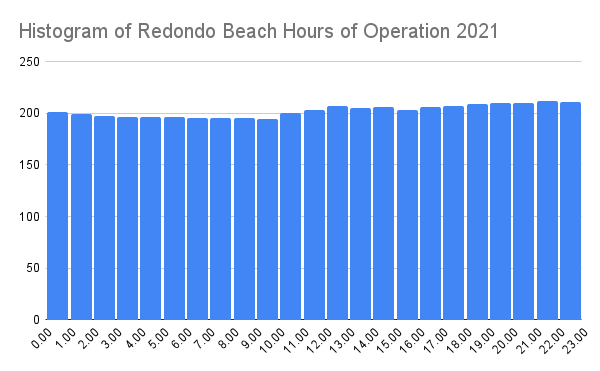
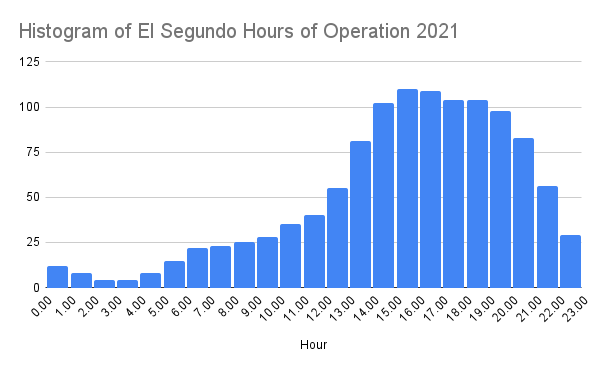
I made histograms for hours of the day that each plant ran. Redondo Beach, which has the older boilers, has to run pretty much continuously to keep warm so that they can deliver electricity during the peak demand hours on hot summer evenings. Incredibly wasteful and polluting.
El Segundo EC can ramp up and ramp down each day that it runs. Notice the vertical axes on AES RB are 2x higher. ESEC has 2 generators, running an average of 50 days a year, mainly during the late afternoon and evening hours. It shuts down at other hours because it can. Saves money, saves CO2/SO2/NOx. It's just better all around.
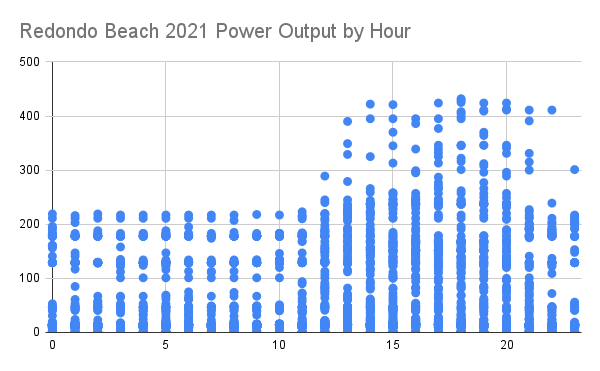
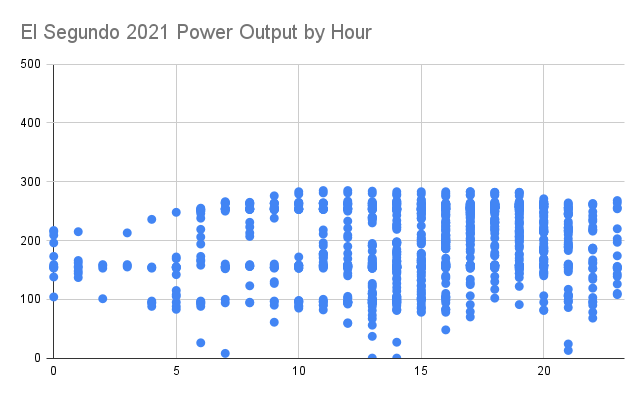
I made a scatterplot of power output by each hour of operation. Redondo Beach operates a lot of hours with low power output. (This is summed up over all generators. Sometimes, 2-3 generators are working at the same time.)
El Segundo rarely operates both generators at the same time. It also runs some warm up hours with little power output, but uses a lot less gas to do it at those times (if you look at the full data).
Nameplate capacity is how much power a plant can generate, if it ran at full tilt. ESEC has a nameplate capacity of 560 MW with both generators operating. They ran one for part of 538 hours and the other for 626 hours. There are 8760 hours/year. If it ran at full capacity the entire year, it would generate 4,905,600 MWh of energy. It generated 227,487 MWh in 2021, so it ran at .046 capacity factor in 2021. ESEC is an example of a "peaker" plant, that runs only when the grid demand is high.
AES RB is another peaker plant. Nameplate capacity is 496 MW so annual capacity is 4,344,960 MWh. It generated 251,192 MWh for .058 capacity factor.
There are activists who want to block all fossil fuel investments. That's seductive because why would people spend money on something that they are going to idle most of the time? If we have it, we will use it. Right?
Induced demand has been shown to apply to car traffic. When you add a lane (like we did to the 405 freeway), then more people drive until the congestion is just as bad or even worse than before. If there is parking at a destination, people tend to drive. If there isn't, they tend to find another way to get there (e.g. transit for DTLA or bikes for the beach).
The converse is also true. When you make driving a hassle, people do it less. If people don't have cars, they make fewer trips. If they are thinking of driving somewhere, and that place doesn't have parking, they may forgo the trip rather than deal with the hassle.
So, if you have a car, how often do you use it? The answer is ~5% of the time, about the same percentage of time as a peaker power plant!
Does induced demand work for natural gas power plants? Do operators have the self control to build new, highly efficient and clean ones, and then let them sit idle most of the time? ESEC spent $ rebuilding the power plant, but they run it profitably by only running it during the hours when power buyers are paying the highest prices. They also installed advanced emissions controls. Under cap and trade rules, they can sell emissions credits to other operators.
AES Alamitos and Huntington Beach are much bigger plants and serve "baseload" instead of running only at peak demand times. AES proposed another peaker plant in Redondo Beach. The question becomes, do you think that AES will adhere to the plan they submitted?
CAISO (California Independent System Operator) runs the CA Grid and has the authority to tell power plants when to operate, when to curtail/go offline. Do you think that CAISO, the Coastal Commission and the CPUC (CA Public Utilities Commission) would allow AES RB to deviate from their plan/permits? Would they all be in on the same conspiracy? I trust not, but I know that many of the voices that carried the day did not feel the same.
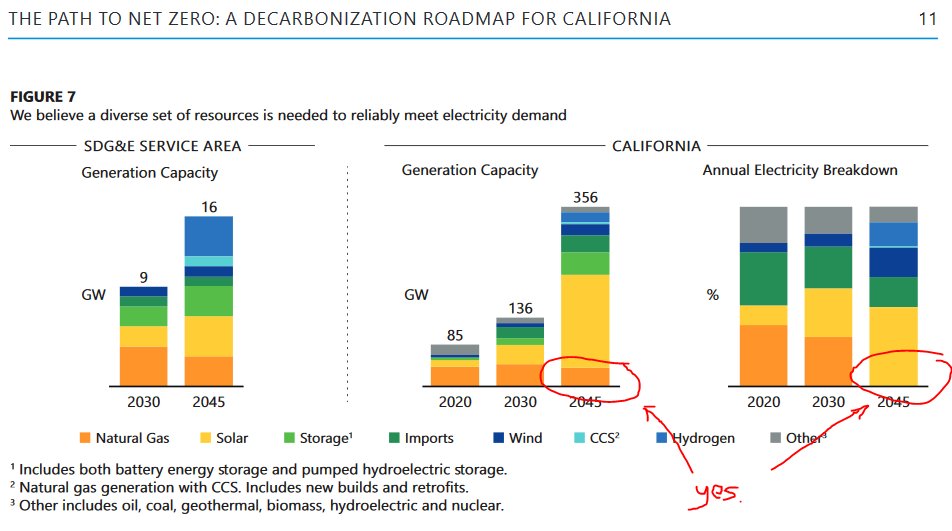
Here's something in a report from San Diego Gas & Electric. See how the generation capacity of gas power plants remains high, but the amount of electricity produced from them ramps down over time? That's due to California's Renewable Energy Portfolio Standards (RE PS). Power producers are required to serve more Renewable Energy over time. Even if they are tempted to run their gas plants more to recoup their investment, they really can't.
In the future, with high integration of renewable energy sources, all gas plants will operate as peaker plants. If they can't be nimble enough, they will be retired. It's the most rational and economic choice. It's also the only way they will meet California's RE PS which is the law of the land.
However, if they don't make the investment in modern facilities that can ramp up and down in minutes, the old technology requires them to run many more hours than needed, burning more gas and generating more pollution along the way.
These old plants are so, so bad. They aren't responsive enough to serve the needs of today's grid with high renewables content. They are wasteful of money and fuels. They generate high amounts of pollution per unit of energy. They require water in a water-scarce region. The OTC plants are even worse because of their ocean water intakes.
So why wasn't AES Redondo Beach repowered? AES tried. But there was so much opposition from Redondo Beach leaders, they gave up.
RB Patch covered it pretty thoroughly and doesn't have a paywall.
AES officials say the new plant will run more efficiently, have a smaller footprint and provide flexibility for the grid when energy from renewable resources isn't available.
Opponents, on the other hand, argue that the plant will continue to decrease property values and blight the waterfront, despite a $300 million revitalization effort. Additionally, they point to AES' application and say a new plant will run more often than the current one, and thus produce five to 15 times more particulate pollution.
Anyway, for almost a decade, Redondans have suffered 2-3.5x more pollution than we would have if AES RB had been repowered to the same scale and technology as ESEC. We lived with more noise as the proposed upgrade would have been enclosed to contain sound and ran much fewer hours/days. We also continued sucking marine life into the water intakes.
All for what? To say we won? To say that we stopped AES? To cost AES money?
It certainly didn't help the marine life or reduce CO2/SO2/NOx emissions.
It didn't have to be this way.
(I'll write about Grayson another day as it's past my bedtime.)