Showing posts with label Safety. Show all posts

Saturday, April 12, 2025

Motonormativity 2

I wrote an LA Voter newsletter (for members of League of Women Voters in Los Angeles County) article about Motonormativity and the way that local, state and federal governments reinforce it with their laws and actions. 

Professor Ian Walker wrote in the 2023 paper, Motonormativity: how social norms hide a major public health hazard, “Decisions about motor transport, by individuals and policy-makers, show unconscious biases due to cultural assumptions about the role of private cars - a phenomenon we term motonormativity.” 

His results were replicated in in the US by Professor Tara Goddard in the 2024 paper, Windshield Bias, Car Brain, Motornormativity: Different Names, Same Obscured Public Health Hazard. 

Past WIG speaker and public health researcher Isabella Chu, MPH, also spoke about the hidden public health hazard that is the top killer of US children. Indirectly, through air pollution and involuntary inactivity by making active transportation (walking, cycling) dangerous, cars may be the top killer of people in the developed world of all ages. 

Transportation, mainly private automobile use, is the largest contributor of CO2 emissions in Los Angeles County and the largest source of PM2.5 pollution (except in the occasional years when particulates from wildfire smoke affects populated areas of LACO.) 

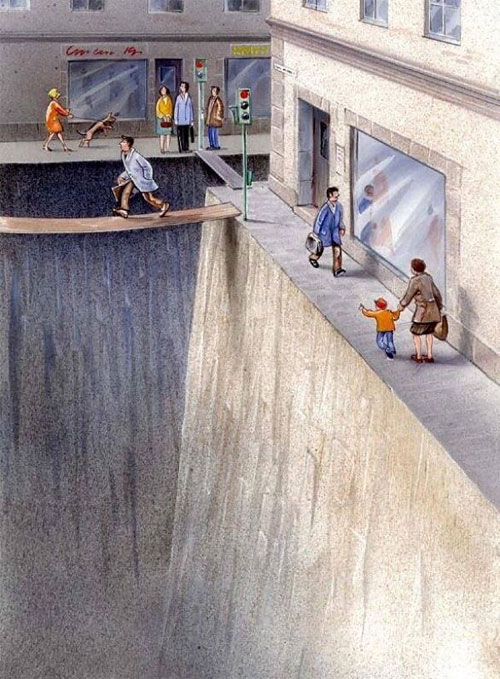
Yet, all this is invisible to most people and especially law and policy makers. In California, it is legal to kill with a car as long as you were not intoxicated, were not speeding, and stayed at the scene of the death. This applies even if a driver kills a cyclist in a crosswalk. 

ILO wrote a letter to Metro’s Board of Directors for omitting protected bike lanes on the Vermont Ave BRT (Bus Rapid Transit) project plans. The City of LA’s Mobility Plan 2035 (adopted in 2014) promised to address identified shortcomings by 2035 by implementing the plan as each section of the roadways had work done. The Mobility Plan showed Vermont Ave would receive both a protected bike lane and a bus priority lane. 

Vermont Ave is infamous as more people die on Vermont Ave due to traffic violence than in the entire state of Vermont every year. (This does not include deaths due to pollution and other indirect deaths.) The LA Times explained the situation in Lawsuit filed against L.A. over lack of bike lanes, claiming Measure HLA violations. 

Local actions are even more important as we can no longer count on the Feds to help us. Under the Reagan Administration, Federal transportation dollars were allocated in a rigid formula of 80% to highways and 20% to transit. 

The Secretary of the Department of Transportation is Reality TV and Fox Business personality, Sean Duffy. He made headlines recently when he rode the NYC subway with NYC mayor Eric Adams and subsequently told Laura Ingraham on Fox News that "even big men don't want to ride the subway." 


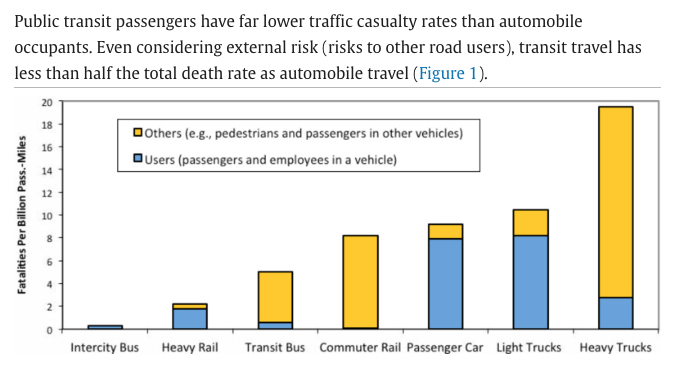
“Most transit trips include active transport (walking and/or cycling) links, and transit users tend to walk and bike more in total than motorists (Lachapelle et al. 2011). These modes have relatively high per-mile casualty rates, although this risk is largely offset by reduced risks to other travelers and improved public fitness and health, so per capita crashes tend to decline and overall health and longevity increase with more active travel in a community (Rojas-Rueda et al. 2011).” 
Transit is so safe that a 1% increase in transit mode share would result in a 2.75% reduction in road deaths. 


State lawmakers show similar characteristics of motonormativity. Until September 6, 2023, Californians could purchase EVs (electric cars) secure in the knowledge that they would receive guaranteed rebates of up to $7,500 for each EV, and that these would stack on top of Federal rebates of $7,500. The income cap was $200,000 for joint filers. California passed out over $1 Billion in EV rebates. 

Contrast that with the California eBike incentive, which has an income cap of $61,320 for a family of 2, and which exhausted the entire $10 Million allocated to eBikes within minutes. eBikes received only 1% as much money as EVs, despite global research showing that dual-mode households drove 19% less than before they obtained an eBike. 

 “Transportation is a climate and feminist issue. CA DMV data shows that women will spend twice as many years aged out of driving as men. Yet, our cities have not built infrastructure for people who don’t drive. 
… Car dependency is not just ruinously expensive, but it’s destroying the planet, and preventing nondrivers from fully participating in society. Women, as primary caregivers, are paying the time tax of chauffeuring people around. Protected bike lanes are mobility lanes, suitable for children on bicycles and seniors on mobility scooters alike.   
Local government decisions have kept us isolated and stressed.”

Wednesday, October 18, 2023

The allies we have

I took down a tweet that was getting a lot of traction for reasons I want to explain here. This whole phenomenon and the complex politics around it, deserves more than microblogging. 

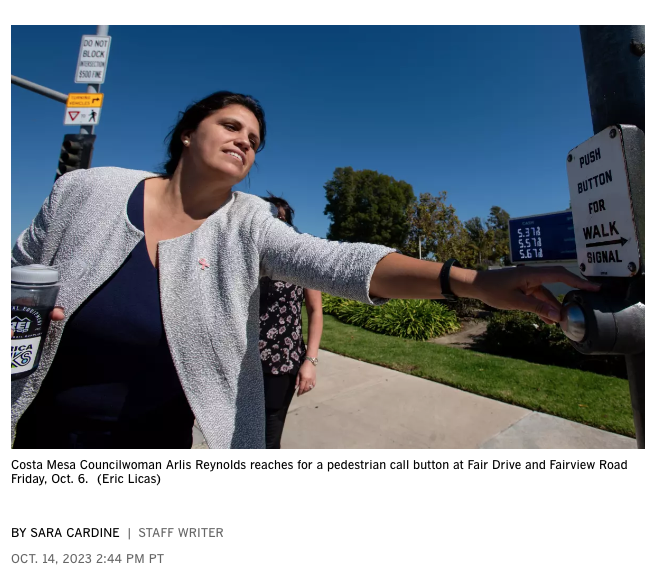
It all started when I linked to this article in the LA Times/Daily Pilot about local elected officials participating in the "Week Without Driving" challenge. Costa Mesa Councilwoman Arlis Reynold said, "I haven't been on a bus in, like, 30 years." 

On the fifth day of Reynolds’ week without driving, the councilwoman was joined by Mayor John Stephens, Thomas and transportation services manager Jennifer Rosales.
[snip]
Stephens, who’s lived in Costa Mesa for 30 years but cannot recall ever taking the bus, said he was stunned to learn how many denizens rely on the local transit system.
I tweeted at how awful it was that elected officials who vote on transit issues don't use it. 

That resonated with a lot of people, and got much attention, retweets. However, I also received comments that it hurts the cause to criticize elected officials who have been allies for safer streets and who agreed to do this experiment and invited the press along to write an article about it. 

They further pointed out that these particular officials don't vote on transit; decisions are made by the Orange County Transit Authority (whose board is made up of elected officials from cities or the county board of supervisors). 

These are valid points and I took down my critical tweet. 

However, I just want to point out that city officials are responsible for the lack of amenities at bus stops, e.g benches, shelters, trash cans, bike racks, way-finding. Bus stops are notoriously hostile places sitting right next to traffic on the busiest and most polluted stroads (street+road). 

Waiting for a bus is literally bad for your health due to air and noise pollution and exposure to car violence.  Drivers have rammed through bus stop benches on both Artesia and Aviation Boulevards near me with enough force to break concrete benches and even pushing one bench (with a woman sitting on it) through the glass windows of the store behind it. 

Cities will use eminent domain and spend $$$,$$$ to buy land to widen intersections for new turn lanes, but they won't do the same to buy a few square feet to move bus stop benches further from the street edge. They don't install plexiglass sound barriers to block wind and dampen noise. They won't install air filters like they do in Korea to protect bus riders from tire and asphalt particulates. 

In conclusion, I'm glad that these particular allies spent a week understanding the challenges of those traveling without cars.  I wish it was mandatory for all elected officials and candidates.  Actually, I wish it was required for everyone, including drivers. 

I am deeply saddened that people are so scared to lose the few allies that they have in Orange County, that they don't feel free to note that officials should have been riding the bus, walking and biking around their cities regularly all along. 

Read the whole article, Costa Mesa councilwoman walks the walk during ‘Week Without Driving’ challenge. In case you can't get past the paywall, the closing is good. 
“I was surprised that [buses] were pretty well packed with people,” he [Stephens] said Tuesday. “We don’t usually walk through the neighborhood like this when we don’t have campaign literature in our hands — whenever you do something like this you become more aware.”

Reynolds, who officially concluded her week without driving last Sunday, is already thinking of improvements for transit riders, first by evaluating all the city’s bus stops to ensure they meet the same standards and adding vital shade and seating where they are currently lacking. And that’s just the beginning.

“I’m interested in looking at broader routes. What I haven’t done is zoom out and see the whole network,” she said in a debriefing Tuesday. “I think there’s an assumption transit can never work in Orange County, but, actually, it could.

“I’m two days past the campaign, and I’m walking still.”
Earlier this year, I read Human Transit: How Clearer Thinking about Public Transit Can Enrich Our Communities and Our Lives by Jarrett Walker. I borrowed an electronic version from the public library and highly recommend it. Jarrett Walker's Human Transit Blog is also good for learning more. 


Wednesday, May 10, 2023

Guidance for the Metro Active Transportation Corridor: Redondo Beach Blvd Survey from a Local

Urgent Action Alert 

Deadline Extended to May 30, 2023 May 15, 2023 so read on and fill out the survey now 

I need you to fill out a public input survey about a vital active transportation project for Redondo Beach and surrounding cities in the South Bay region of Los Angeles County. This is our chance to reverse some of the damage wrought by past auto-centric road design in North Redondo Beach and allow those who can ride a bike to make school and shopping trips with confidence that they can make it home alive and in one piece. 

There's also a Story Map about the Redondo Beach Blvd Active Transportation Corridor Project with more information. 

Short version if you are in a hurry:

The current street allocation with car parking on both sides and massive SUVs speeding down our streets is not safe or welcoming for cyclists. The proof is in the declining bicycle mode share. 

When filling out the survey, select the options that give a protected bike lane every time. Scroll down past the background info to see my recommendations and why. 

Paint is not protection. Never select an option with a paint-only bike lane in the door zone. If someone opens a door, a cyclist in the door zone will be knocked off their bike and suffer grievous injuries. If they swerve to avoid the door, or are knocked into the traffic lane, they could be killed. No one wants to be killed or have their child killed while riding to school. 

Two-way cycle tracks are a good option, particularly near schools. When kids are arriving or leaving school, there will be a lot of traffic congestion on all modes. But cars are particularly dangerous. The less car traffic they cross while leaving the congested area, the safer they will be. Keep them on the school side of the street, with wide lanes so that there is passing room in the bikeway (keep the kids out of the car traffic lane). 

Plastic poles are not physical protection, but likely the best we can get as a first step.  Plastic poles can be replaced with bollards or concrete barriers later if we allow enough buffer space to install the plastic poles in the first place. Do not let the perfect get in the way of actions we can do right now. 

You can skip the background (but I hope you read it when you have more time).  

Background: The Connection with Schools

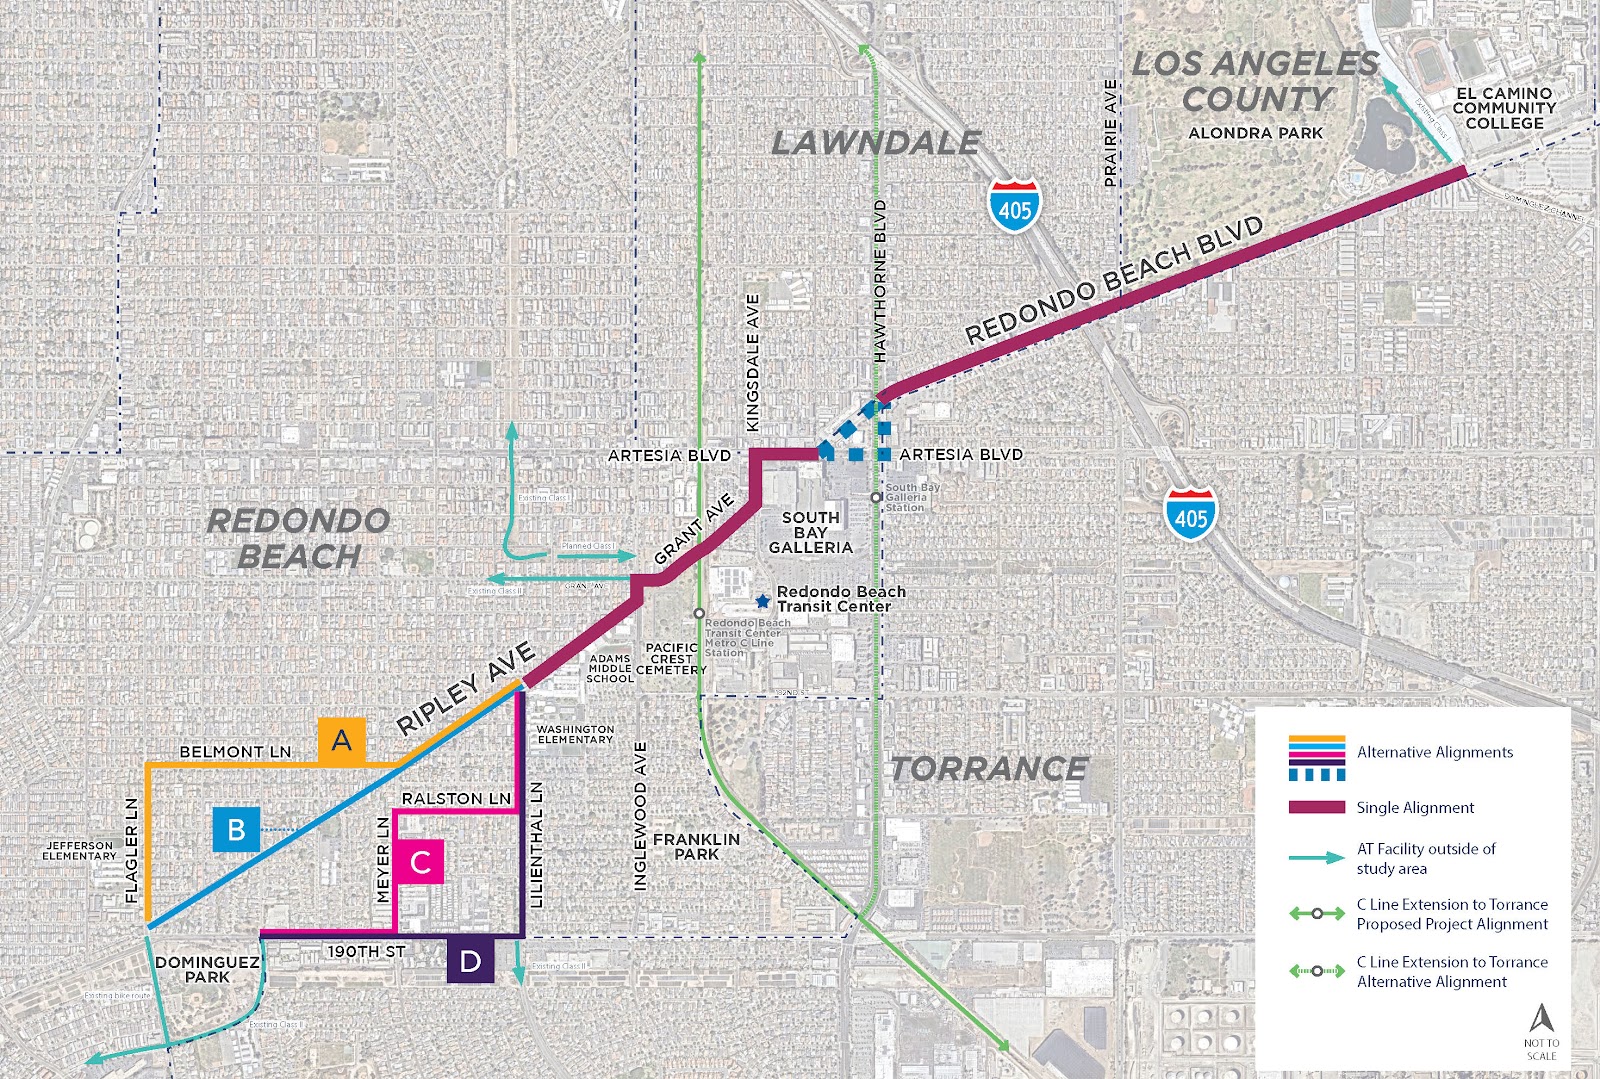
The project area below was originally going to be along the old freight route from Redondo King Harbor to the inland rail routes, but Ripley was found to be too steep (several areas with 15% grades) to be feasible for safe cycling. 


A Redondo Beach traffic study determined that 30% of the city's AM/PM peak traffic is the child school run. This travel corridor includes

  • Adams Middle School: 1066 students: 6-8 grades
  • Washington Elementary School: 801 students, K-5
  • Jefferson Elementary School: 509 students, K-5
That's almost 2400 K-12 students arriving and departing each day on this corridor. 

But that's not all, because all students in Redondo Beach Unified School District (RBUSD) attend Redondo Union High School (RUHS) in South Redondo Beach*. Jefferson ES students also attend Parras Middle School south of RUHS. 

Assuming 350/grade at Adams MS and 90/grade at Jefferson ES, 

350*4 + 90*7 = 2030 students cross 190th Street to attend school and return home each day. 

About half of all RBUSD students traverse this corridor every school day.

But that's not all; El Camino College (ECC, 22,000 students, many from the Beach Cities) is on the eastern end of this travel corridor. Some RUHS and MCHS students do concurrent enrollment and take classes at ECC while they are in HS. Due to many factors, including cost and lack of housing at UC campuses, a large number of students are enrolling in grades 13/14 at ECC before transferring to a 4-year college/university. 

When filling out the survey, think about what you would send your kid to school on. Think about what you would be comfortable riding on as you accompany your younger child to school or run your errands. I ride this area 1-2x/week to run errands in North RB or West Torrance. I want better infrastructure for my safety, too. 

Watch this video of the horrifying existing conditions as ridden by two fit MAMILs (Middle-Aged Men in Lycra). Would you ride these steep hills? Next to fast-moving busy traffic?


Here's another video of the area where Kyle, an area father, rides his kids to preschool. 


My opinionated guide for the survey choices and why they matter: 

Every cross-section shown is facing either Eastbound or Northbound.

Q1: For the westernmost portion of the corridor, which alignment(s) do you prefer? 


I picked D because that would give us a 2-way cycle track on Lilienthal and the longest length of protected bike lanes on 190th. 190th St is also the only way to avoid steep hills. 

The problem with B: The first video shows just how steep Ripley is. Notice that the lead cyclist on a light road bike has trouble getting up the hill (and the trailing cyclist with the camera is on an eBike). Going up a 15-16% grade is difficult, but going down them is downright dangerous. Do not send kids on this route. 

A and C are better, but still steep in some sections. Also, if those are the official routes, there will not be likely any road changes except Sharrows, which are shown to be more dangerous than not doing anything. 

Only Option D along 190th St will yield any road space allocation for cyclists. 

What is a Sharrow? 

Why are Sharrows so dangerous? 

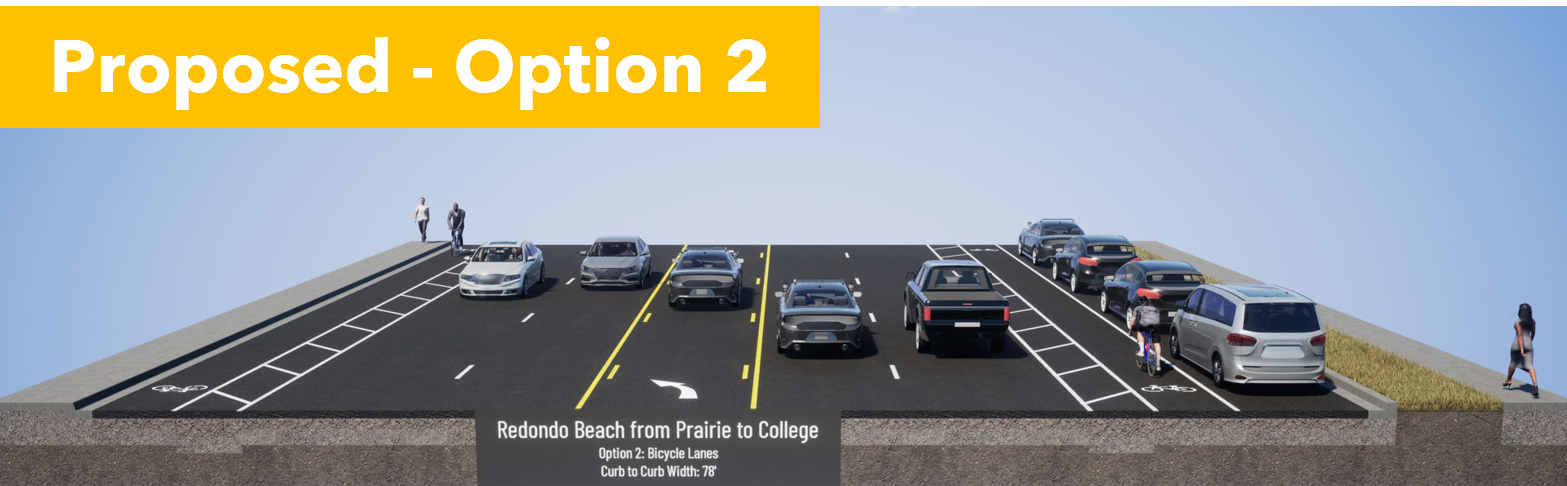
Q2: The proposed street section for 190th St (Alignments C and D) is shown here. How satisfied are you with this proposal?


I picked Very Dissatisfied: These cross-sections are looking towards the east, with Torrance on the Right Hand Side (RHS) and Redondo Beach on the LHS. Cars are coming down the hill from Flagler and often speeding 50 eastbound mph. People drive with the sun in their eyes during the morning and evening commutes. Do you feel safe with just paint and plastic poles designed to bend when run over by vehicles?

I recognize that people living in the apartments in Torrance on the right need overflow parking, but let's swap the bike lane and parking lane. Install a parking-protected bike lane like this one in Long Beach on the Torrance side with breaks to preserve sight lines at each driveway or street crossing. 


On the RB side, I'd like to see real bollards or a curb. Imagine something like these without the parking lane. Images courtesy of National Association of City Transportation Officials (NACTO). 


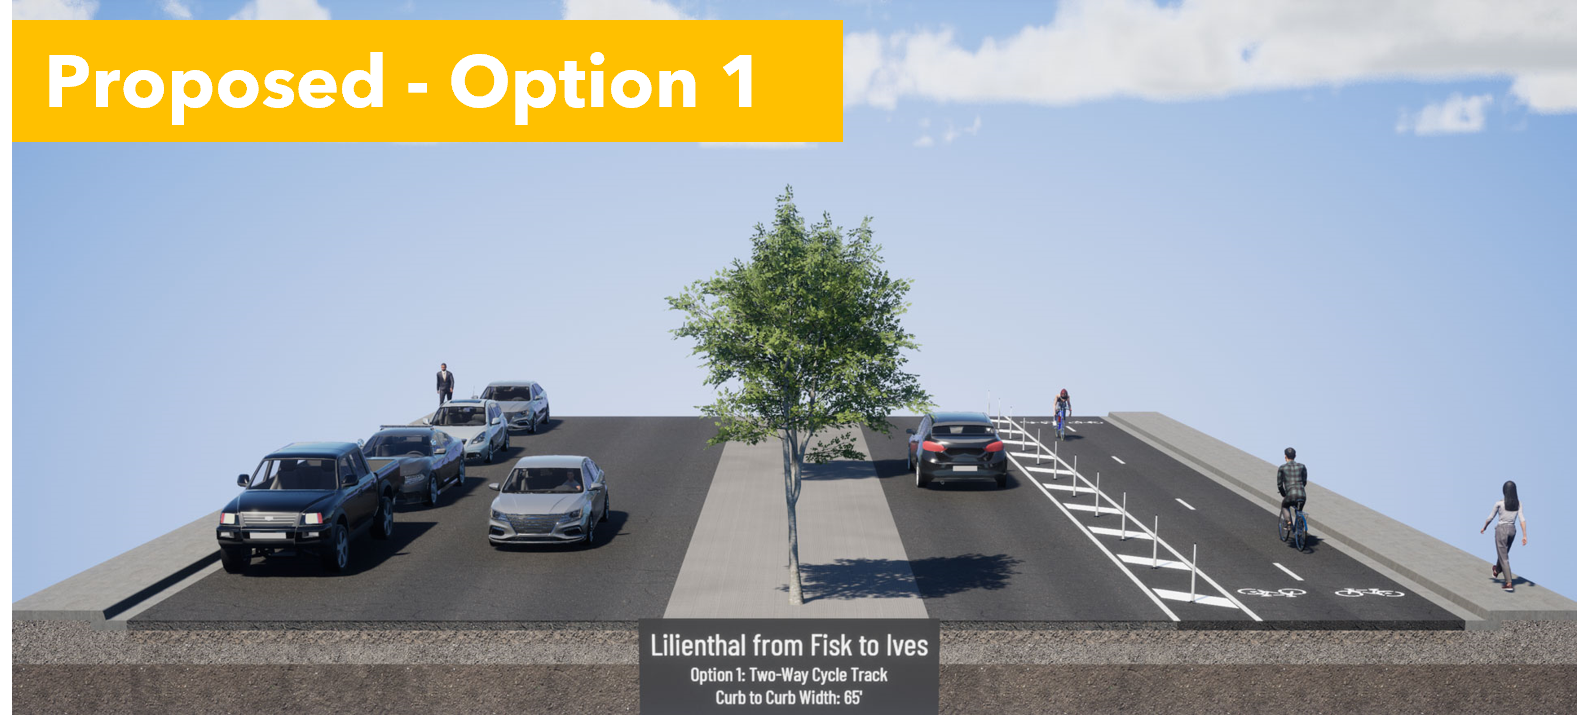
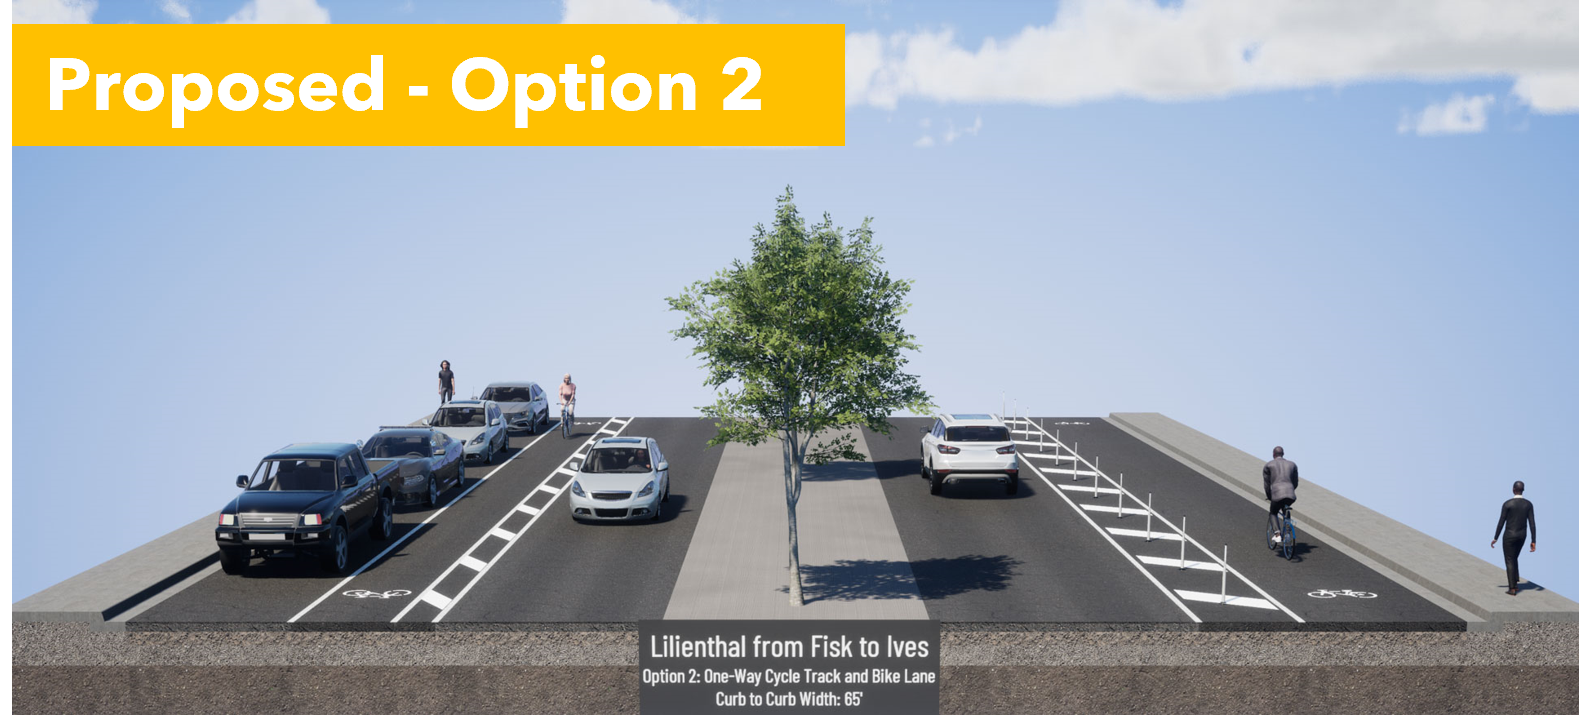
Q3: Select Option 1, the 2-way cycle track on the east side, next to Washington ES. 


Option 1 provides separation from cars, and is wide enough for passing, and allows parents to ride side by side with a child gaining confidence in their bike skills. In 2-way cycle tracks, people riding opposing car traffic are facing approaching cars, so they can see and react to dangerous drivers. It would be better to have solid protection here, but Option 1 gives us room to retrofit with more solid barriers later. 


Option 2 puts kids in the door zone on one side and makes them cross the street to get to school. It's a dangerous situation. 


Q4: Select Option 1, the 2-way cycle track on the east side, next to Washington ES.  


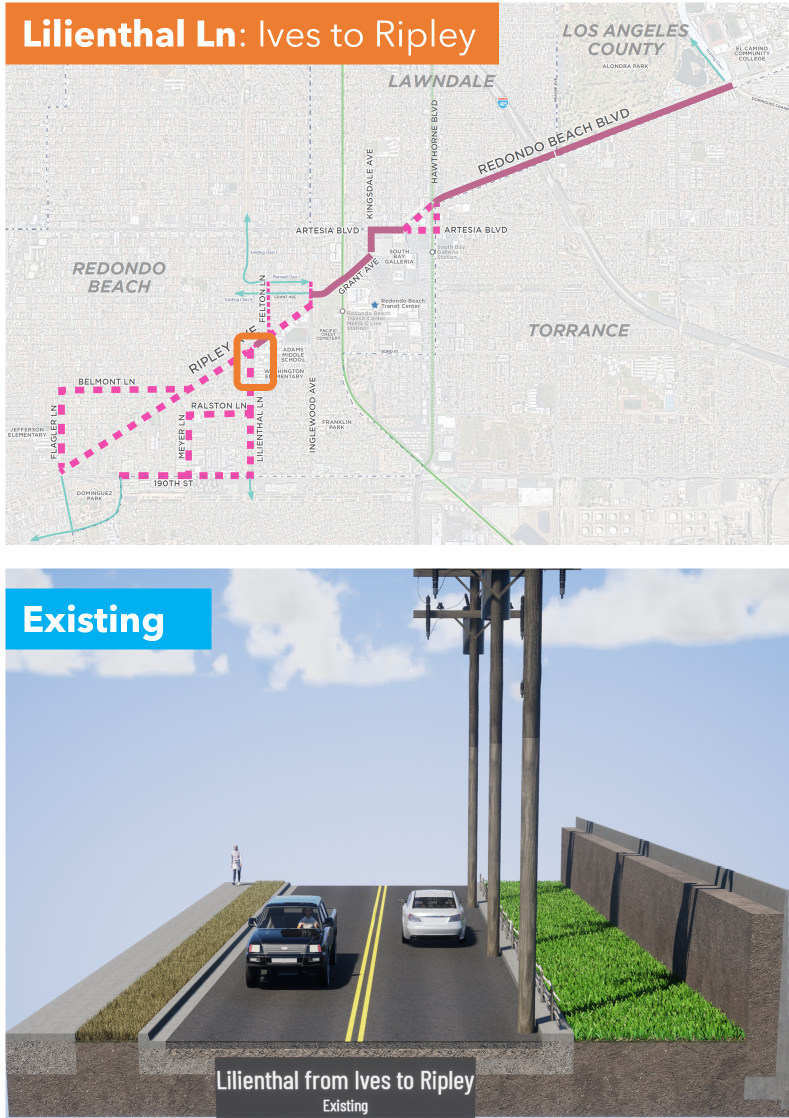
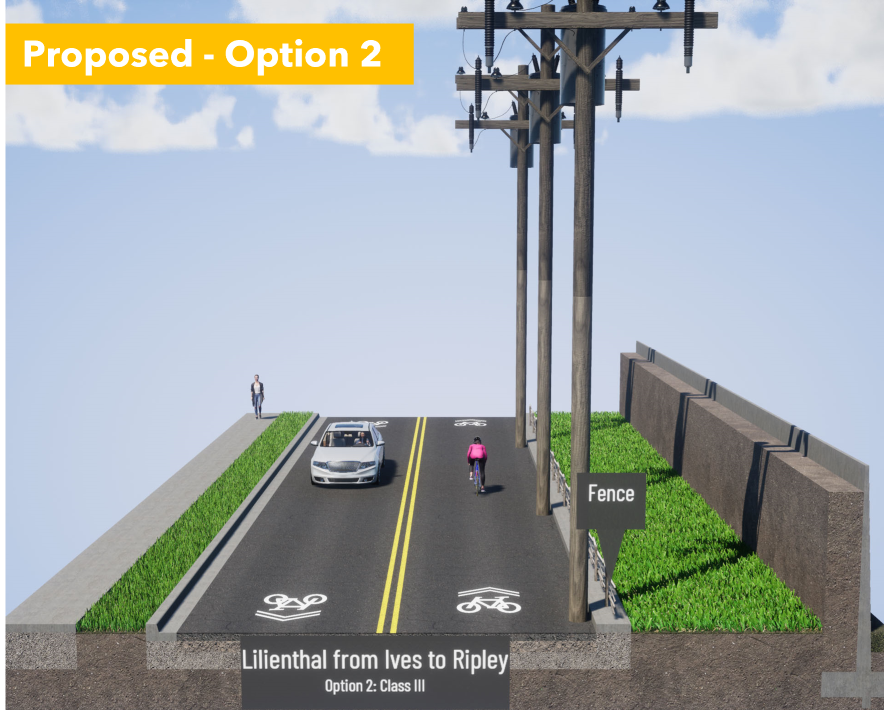
Don't be distracted by the stock visualization image with a tall solid wall. There is currently short solid wall on the parking lot side and a wood and rope fence on the road side. 


Option 1 gives a clear place for kids to ride that is physically separated from cars. The 2-way cycle track would replace the wide grassy area.


Option 2 is sharrows in a place where drivers are more focused on making a turn at Ripley than cyclists approaching from behind them. 

Motorists trying to make a right turn will pull over to the right, trapping cyclists behind them. Small children on bikes and tall, boxy hoods on todays trucks and SUVs mean that parents may not be aware of cyclists in front of them. This has led to an epidemic of frontover crashes where drivers run over people in front of them because they can't see them over their hoods. Or, they look at their screens and forget that there are children in front of them. 

Option 2, sharrows, is a safety disaster. 


Q5 on Ripley: Pick Option 1, the 2-way cycle track on the Adams MS side


Option 1 keeps the kids on the school side as long as possible. It also preserves the car unloading curb space that people are currently using. 


Option 2 puts kids in the door zone, at precisely the time that kids being driven to school are unloading. This is a safety disaster. 


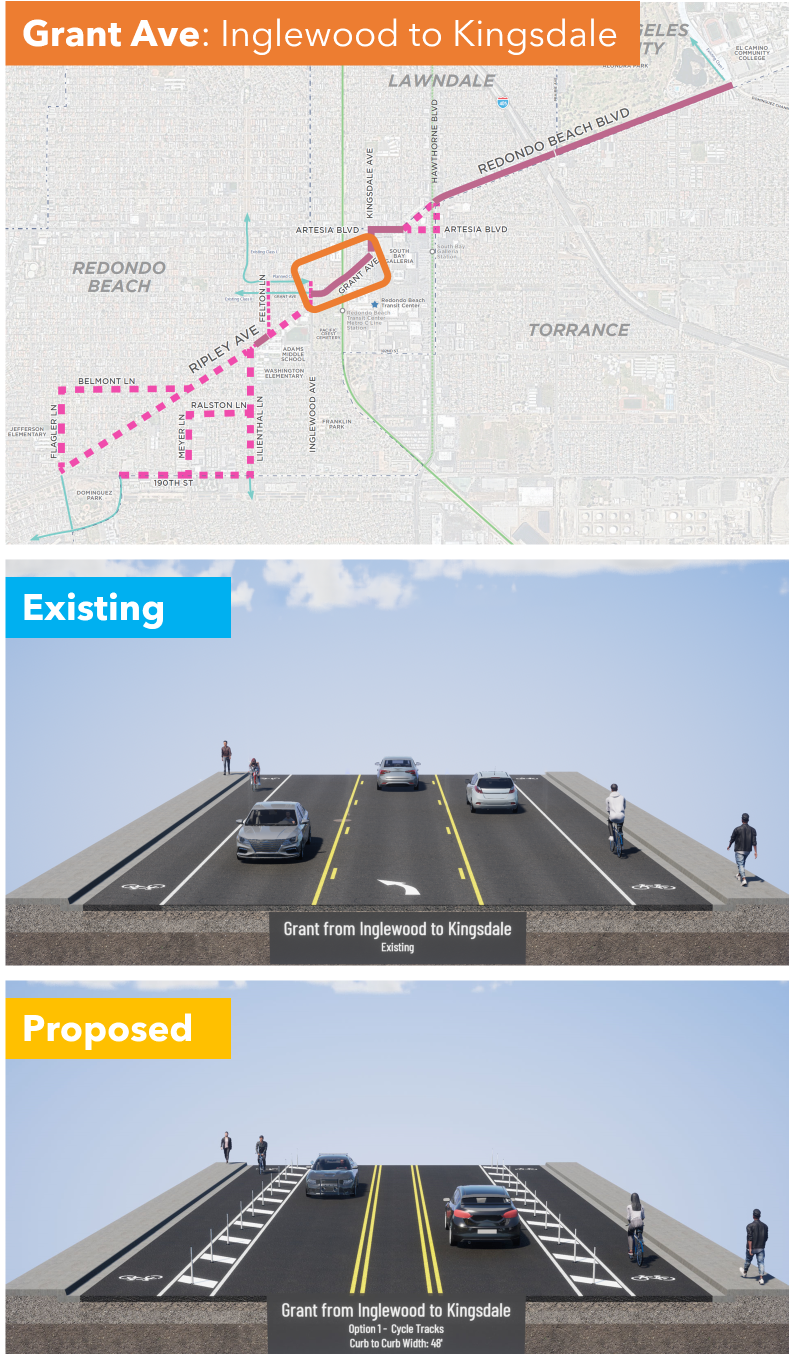
Q6: Grant Ave from Inglewood to Kingsdale; I am very dissatisfied but I selected other and explained why we need solid protection instead of plastic bendy poles


They are proposing paint, a buffered (space separation) and plastic bendy poles. 

This is better than existing conditions, but not safe. Cars pick up speed heading downhill and frequently misjudge the curve, so they end up sideswiping cyclists in the bike lane. We really need a concrete barrier on the downhill (right hand) side. 

I ride by bike to shop at the Galleria and this is the scariest part. I saw a guy almost get killed here. If we want more people to bike through this area, which connects to shopping, the South Bay Transit Center, and the 300 new homes under construction, then we deserve solid protection in this dangerous area. 

I gotta break for lunch but I'm going to hit Publish on this so you can get started. I'll finish after lunch. 

...

I'm back. Stay with me because we are on the home stretch, but the most dangerous one that crosses the 405 Freeway and has the most high-speed traffic. 

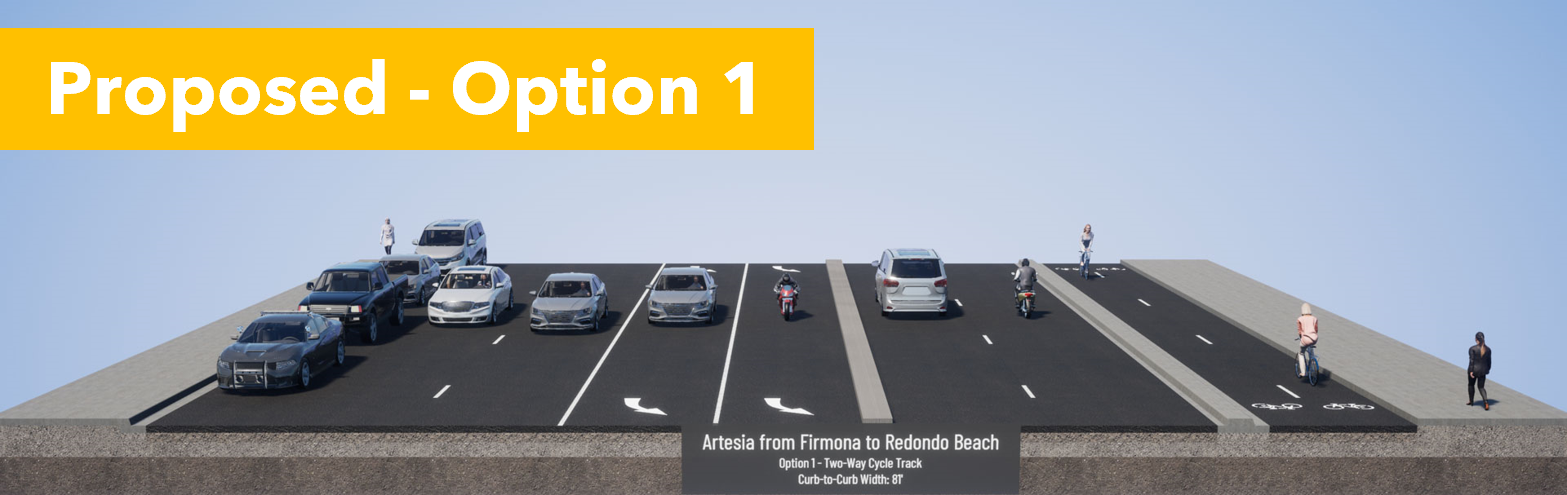
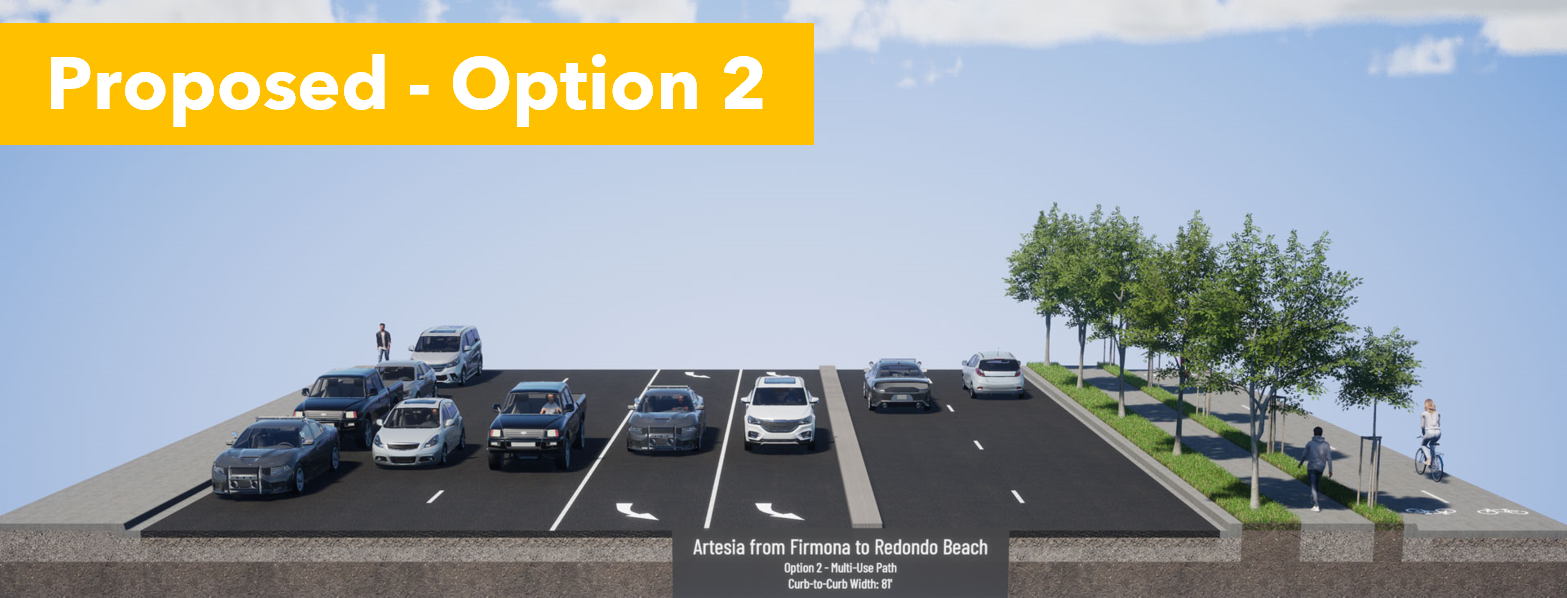
Q7: Artesia Blvd from Kingsdale Ave to Redondo Beach Blvd pick Option 2.  

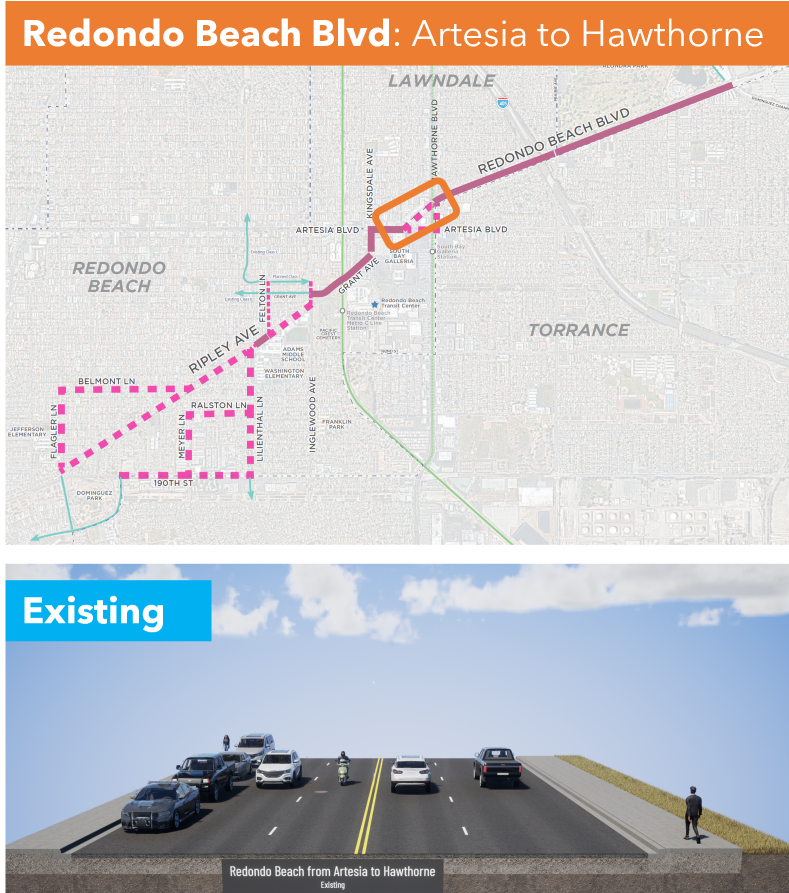
Existing conditions are awful and you see very few cyclists brave enough to ride here. If they do, they are often on the sidewalk, conflicting with pedestrians. 

Option 1 puts cyclists next to vehicle lanes, but protected with a concrete curb. Pedestrians and cyclists would intuitively understand where they are supposed to be, as faster bike traffic is at the street level. However, this would interfere with bus stops. 


Option 2 puts pedestrians next to the vehicle lanes, but also next to the bus stop. Trees would provide shade. There could be some confusion with pedestrians wandering on the bike path, but that can be solved with good signage.


Our community has experience with pedestrian and bikeways next to each other in the North Redondo Beach Bikeway (NRBB). While there is some spillover, people have already learned where pedestrians and rollers have priority on the NRBB. Option 2 will work best for us and we already know how to use it. 

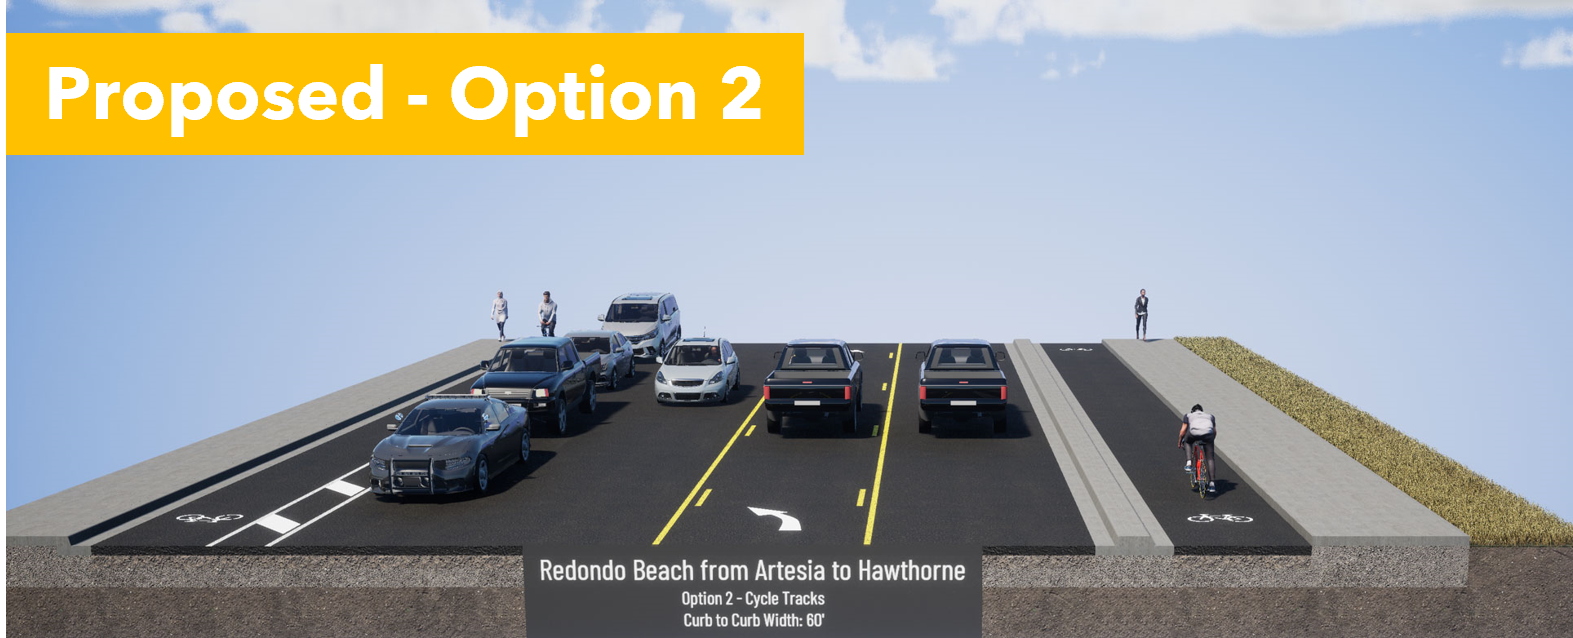
Q8: Redondo Beach Blvd from Artesia Blvd to Hawthorne Blvd. Is a tossup but both Options are so much better than the status quo.


Option 1 pits cyclists against pedestrians, but provides 2-way access to Walgreens and Starbucks. It's not terrible as long as cyclists slow down when passing pedestrians and motorists exiting the parking lots look both ways. 


Option 2 provides a clear separation between motorists, cyclists and pedestrians. Cyclists are curb-protected on the eastbound RB side, and parking-protected on the westbound Lawndale side. However, coming westbound from Walgreens/Starbucks, people will likely bike on the sidewalk until they meet the 2-way cycle track. 


Although you lose a traffic lane, it's not the cyclists' fault. One can just as easily blame the space allocated to free car storage (on-street parking) and a turn lane. Motorists are losing a travel lane to other motorists, not cyclists. Don't forget that. 

Option 1, the 2-way cycle track, provides a better alternative not suggested by Metro for the next section. 

Q9: Redondo Beach Blvd from Hawthorne Blvd to Prairie Ave. I am Very Dissatisfied & propose a better solution. 


Although the status quo is very bad, we shouldn't rush into the proposed door zone bike lane next to high-speed traffic heading to the freeway onramps. It is extremely dangerous. This will greatly reduce the number of people brave enough to ride to Alondra Park and El Camino College. 

If there is enough room for on-street parking, then there is enough room for a parking-protected bike lane. That may require narrowing the car lanes a bit, but that would also inhibit speeding, making that stretch safer and quieter for all road users. 

The freeway onramp is on the north side of RB Blvd. A 2-way cycle track on the south side of RB Blvd would keep cyclists away from the crazy line of cars trying to merge onto the 405 on-ramp. Suggest that in Q11. 

Q10: Redondo Beach Blvd from Prairie Ave to Dominguez Channel. Pick Option 1, the 2-way cycle track on the North side, next to the park and El Camino College. 


Option 1 puts cyclists next to the park and ECC. Although it is shown with plastic bendy straws, it can easily be fitted with bollards or a concrete curb for better protection when cycling to and from evening classes at ECC. 


Option 2 puts cyclists in the door zone, where they can be knocked into fast-moving traffic and killed. Drunk or malicious drivers can also harm cyclists easily with only "paint as protection". 


Q11: Additional Comments: This is where we ask for a protected 2-way cycle track on on the south side of RB Blvd between Hawthorne and Prairie. 

What do you need to be comfortable bicycling this corridor? Tell them!

Keep in mind that younger Beach Cities kids will probably only ride the western side of this corridor, west of Inglewood or Kingsdale. But older teens and young adults may need to ride to ECC or to retail jobs between Kingsdale and Crenshaw. 

There are a lot of children and seniors in Lawndale and Torrance who would benefit from these bike facilities, whether they are riding a bike, trike or mobility scooter. 

We should make this corridor welcoming for ages 8-80. 

Think about who needs to travel through this corridor and at what times. What kind of cycling facilities do they need to get there comfortably and safely?  What about seniors in mobility scooters or electric wheelchairs? Would you like to see food delivery robots in the bike lane or more food delivery by privately-owned cars?

With better bike facilities, I may choose to bike to stores further east than I currently feel safe. Every trip I make by eBike instead of car, I am "sparing the air", not taking up road space in front of you, and not competing with you for parking. 

Another thing that excites me about this project is that it connects us to the Dominguez Channel. In a separate project, LA County Public Works will be extending the bike path along the channel southwards. It currently goes north to 120th St, past Amazon, Space-X, Lowe's and to the Metro Green/C Line. A southbound channel bike path would connect to the Harbor Gateway Transit Center, with very fast connections to the Silver/J Line to USC/Expo Park (15 min) and Downtown LA (20 min). Harbor Gateway TS is already linked up to CSU Dominguez Hills. This is a large step forward for a transportation transformation for the South Bay. 

Bike lanes benefit you even if you don't ride a bike, but your neighbors do. 

Bike lanes will save you time currently spent chauffeuring your kids short distances. 

Bike lanes will benefit your kids because students who get exercise before school do better. 

Bike lanes will benefit you when you age out of driving. 

Bike lanes may allow your family to shed one car, saving you over a million dollars per lifetime. 

Finally, I want to close with this terrific video of a #BikeBus led by Coach Sam Balto in Portland. 

https://twitter.com/CoachBalto/status/1656353963489501190?s=20

This bike corridor will touch the lives of half the students in RBUSD and can be transformative for the way our community gets around. If half of our households can shed just one car, we would be richer, our street parking and traffic congestion problems will evaporate, our air and water will be cleaner, and we will have done our part to slow climate change. Oh, we'll be fitter and happier, too. 

* A very few students living in North RB attend Mira Costa HS in Manhattan Beach, but only if MBUSD will take them. 

Friday, March 03, 2023

True Cost to Own

This post was inspired by a Twitter exchange with a Culver City resident who was able to shed one of her family's two cars due to the Move Culver City Project to reallocate space from cars to transit (bus lanes), active transportation (walking/biking) and micro-mobility (scooters, wheelchairs). 


Culver City's city council balance changed from 3/2 in support of this street space reallocation to 3/2 opposed. The new city council wants to reverse the street space allocation and give 100% of the public space to cars again despite the city's own data that transit and bike use grew explosively while car use declined.  Read the Move Culver City Mid-Pilot Report.  


I think reversing Move Culver City is a big mistake for many reasons, but I will just get into the financial angle in this post. 

Car ownership is so normalized in US society that I think we stop paying attention to how much it's really costing us. When AAA published their annual report "How Much Does it Really Cost to Own a New Car 2022", it surprised many people. [2023 Update is even grimmer, $12,182/year]


There were the usual arguments that not everyone buys a new car. But, this assumes the average new car sells for $33,301 when Kelley Blue Book reports that the average car price set a new record in December 2022 at $48,681. Car and Driver reports that Los Angeles drivers pay $681/year more for car insurance than the national average.  

$10,728 is an underestimate for the cost to own a car in Los Angeles. That price also does not include the cost of a parking spot, which you are paying for whether it's a line item in your budget or not.  Everyone seems to complain about parking, even though Los Angeles has more homes for cars than for people. 

If households with multiple cars can shed one car, they can save $10,728/year. 

Median Culver City household income in $97,540 with a marginal tax rate (CA+Fed) of 33.3%. 

Owning a car costs $16,084/year pre-tax. 

If that money were put in a tax-deferred retirement savings account every year for 30 years, that household can accumulate just under $1 Million! 

I assumed that the money was saved in a Vanguard Growth and Income Mutual Fund (VGIAX) earning about 6.54% over the last 20 years or 10.78% over the last 10 years. 

The Bureau of Labor Statistics CPI inflation calculator says inflation ran 2.65% over the last 20 years. 

Using a conservative 4% above inflation estimate for VGIAX, the Bankrate Compound Interest Calculator shows that the household that was able to shed a car winds up with $916,300 after 30 years in their retirement savings account. Yes, you do pay taxes as you withdraw that money, but that's a huge chunk of money nevertheless. 


In Summary, if Move Culver City allows families to shed one car, then that is a $1M gift to the families in Culver City. 

Reversing/removing the street improvements--making buses too slow to use and bicycling too dangerous to attempt--forces families into cars again. If they have to own a second car again, then Culver City families lose $1 M. 

Elected officials should think long and hard about whether they want to force car dependency and costs onto their residents. It's not good for residents, it's not good for the planet, it's not good for the city. Finally, I don't think it's good for the elected officials' ability to get re-elected. 


Wednesday, July 27, 2022

Neighborhood Defenders Wrong Again

Neighborhood Defenders bring up aesthetics, the environment and property values as reasons to oppose things.  There are quite a few in my city (and likely yours, too). Sometimes, it seems like nothing must ever change or else we will incur their wrath.  I've been begging for bike lanes for 25 years, to no avail. Bike lanes must never take away on-street parking (mostly FREE PARKING) so they don't get built. Instead, we'll just keep making blood sacrifices of our children on the streets. 

Anyway, I digress. This is a blog post about electricity and pollution. But I have to digress a little bit longer first. 

Since 2019, I have been a director on the boards of both League of Women Voters of the Beach Cities and of Los Angeles County. Due to my science background, I was assigned the Natural Resources Portfolio.

I've been passionate about water and the environment since I took Field Biology in high school. So I also joined the LWVC Water Committee. I was a little bit too outspoken at the Water Committee meetings because I ended up being assigned to write nearly half the Overview of California Water articles, including the one on the Water-Energy Nexus.

This led the LWVC chair of Natural Resources to ask me to serve as her deputy in the area of Energy/Electricity.  Thus, I found myself the Energy Subcommittee team leader. I promptly ordered and read a bunch of books about energy and clean energy in particular. It's a fascinating topic. I never imagined that I would know the names and boundaries of the regional balancing authorities of The Grid, or that I would have opinions on their governance.  But, I do now.  ;-)

Back to electricity. 

There's been a spate of articles lately about the fate of a handful of power plants along the California coast that use ocean water for cooling. OTC (Once Through Cooling) plants have to suck in large volumes of ocean or river water, which can suck in small sea/aquatic life. That is totally no bueno.

At one time, we had quite a few of them. They sit on prime ocean-front land so their real value is often more due to real estate than power production. OTOH, they also have infrastructure, such as existing transmission lines, that would be difficult to assemble today. 

How a beachfront gas plant explains California’s energy problems lays out some of the issues. 

So I started researching the fate of the OTC plants that are no longer using ocean water for cooling. It turns out that I didn't have to look far. In 2013-2014, a similar power plant just a few miles to the north, the El Segundo Energy Center, was repowered* from Boiler-type OTC to a dry-cooled Combined Cycle Gas Turbines (CCGT). 

* Repowering means updating an older power plant with newer equipment that is more efficient and pollutes less. Switching from a gas boiler system to CCGT yields 50-70% more energy per amount of gas burned or per molecule of CO2 produced. They can be powered up in 20-30 minutes compared to many hours for older boiler plants.  

Newer Reciprocating Internal Combustion Engines (RICE) can be powered up in 2 minutes, meaning they can react quickly to things like the marine layer moving in and decreasing local roof-top solar power output. RICE are air-cooled, yielding substantial water savings of millions of gallons per day. 

You know how much I love data. I discovered the EPA Clean Air Markets Program Data Portal (aka Cap and Trade). I looked up the characteristics and 2021 data for five area power plants, including the repowered one in El Segundo and AES Redondo Beach. 

The comparison is stark! On every pollution metric, AES RB is much, much worse than ESEC--about 2-3.5x as much pollution per unit of power, over the course of a year, and it operates 4x as many hours.

I summed up the data from Jan 1, 2021 to Dec 31, 2021 to get an idea of how much power and pollution each plant puts out in a year.  

Each Facility/Power Plant has more than one generator. They turn on the amount they need to meet the anticipated electricity demand/load. No one wants to burn more fuel than they need to because that's just burning money.  

El Segundo has 2 generators, Redondo Beach has 3. Operating time is summed up over generators. If all 3 are running for one hour, that's 3 hours of operating time. 

Gross load is how much power they are making. 

Despite providing comparable amounts of power over the course of a year, the older AES RB plant puts out 2x the SO2 and CO2 and 3.5x the NOx than the AES plant. It also operates over more hours. (Click on the table to enlarge it.)


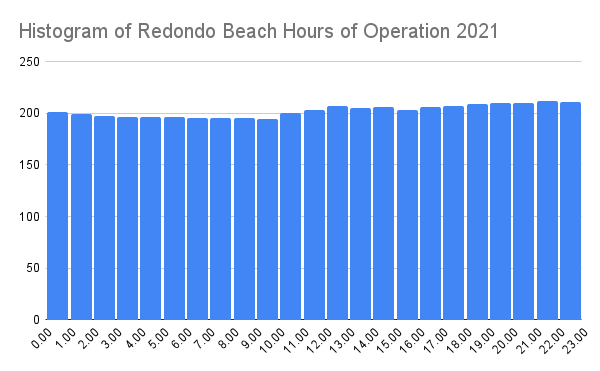
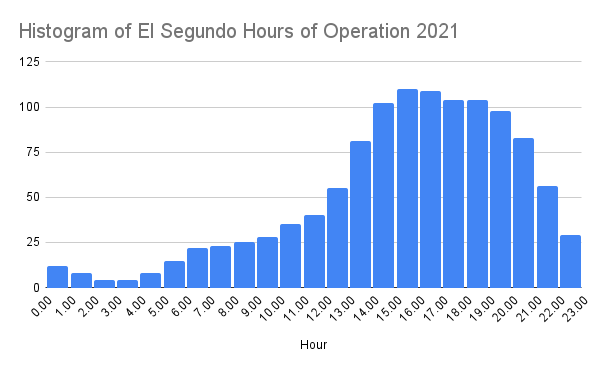
I made histograms for hours of the day that each plant ran.  Redondo Beach, which has the older boilers, has to run pretty much continuously to keep warm so that they can deliver electricity during the peak demand hours on hot summer evenings. Incredibly wasteful and polluting. 

El Segundo EC can ramp up and ramp down each day that it runs. Notice the vertical axes on AES RB are 2x higher. ESEC has 2 generators, running an average of 50 days a year, mainly during the late afternoon and evening hours. It shuts down at other hours because it can.  Saves money, saves CO2/SO2/NOx. It's just better all around. 

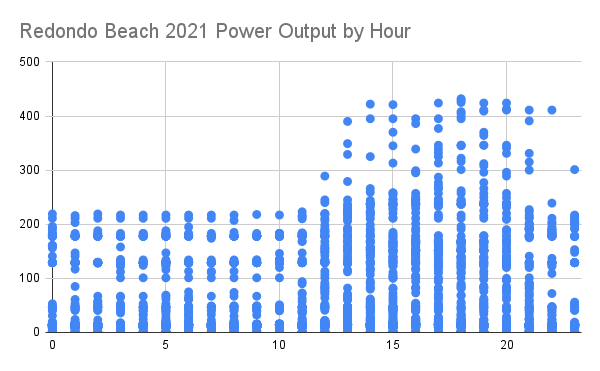
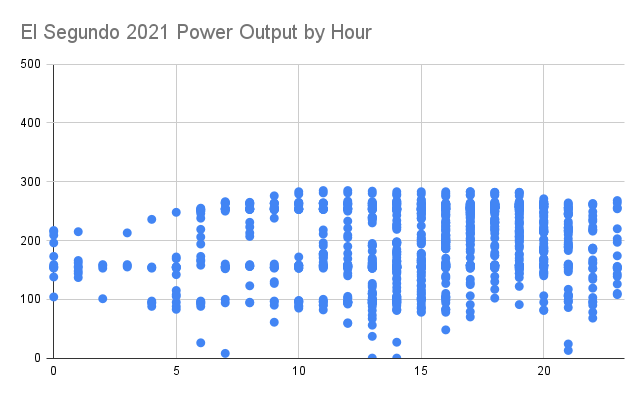
I made a scatterplot of power output by each hour of operation. Redondo Beach operates a lot of hours with low power output. (This is summed up over all generators. Sometimes, 2-3 generators are working at the same time.)


El Segundo rarely operates both generators at the same time. It also runs some warm up hours with little power output, but uses a lot less gas to do it at those times (if you look at the full data). 


Nameplate capacity is how much power a plant can generate, if it ran at full tilt. ESEC has a nameplate capacity of 560 MW with both generators operating. They ran one for part of 538 hours and the other for 626 hours.  There are 8760 hours/year. If it ran at full capacity the entire year, it would generate 4,905,600 MWh of energy. It generated 227,487 MWh in 2021, so it ran at .046 capacity factor in 2021. ESEC is an example of a "peaker" plant, that runs only when the grid demand is high.

AES RB is another peaker plant. Nameplate capacity is 496 MW so annual capacity is 4,344,960 MWh. It generated 251,192 MWh for .058 capacity factor. 

There are activists who want to block all fossil fuel investments. That's seductive because why would people spend money on something that they are going to idle most of the time? If we have it, we will use it. Right?

Induced demand has been shown to apply to car traffic. When you add a lane (like we did to the 405 freeway), then more people drive until the congestion is just as bad or even worse than before. If there is parking at a destination, people tend to drive. If there isn't, they tend to find another way to get there (e.g. transit for DTLA or bikes for the beach).

The converse is also true. When you make driving a hassle, people do it less. If people don't have cars, they make fewer trips. If they are thinking of driving somewhere, and that place doesn't have parking, they may forgo the trip rather than deal with the hassle. 

So, if you have a car, how often do you use it? The answer is ~5% of the time, about the same percentage of time as a peaker power plant!

Does induced demand work for natural gas power plants? Do operators have the self control to build new, highly efficient and clean ones, and then let them sit idle most of the time? ESEC spent $ rebuilding the power plant, but they run it profitably by only running it during the hours when power buyers are paying the highest prices. They also installed advanced emissions controls. Under cap and trade rules, they can sell emissions credits to other operators. 

AES Alamitos and Huntington Beach are much bigger plants and serve "baseload" instead of running only at peak demand times. AES proposed another peaker plant in Redondo Beach. The question becomes, do you think that AES will adhere to the plan they submitted? 

CAISO (California Independent System Operator) runs the CA Grid and has the authority to tell power plants when to operate, when to curtail/go offline. Do you think that CAISO, the Coastal Commission and the CPUC (CA Public Utilities Commission) would allow AES RB to deviate from their plan/permits? Would they all be in on the same conspiracy? I trust not, but I know that many of the voices that carried the day did not feel the same.

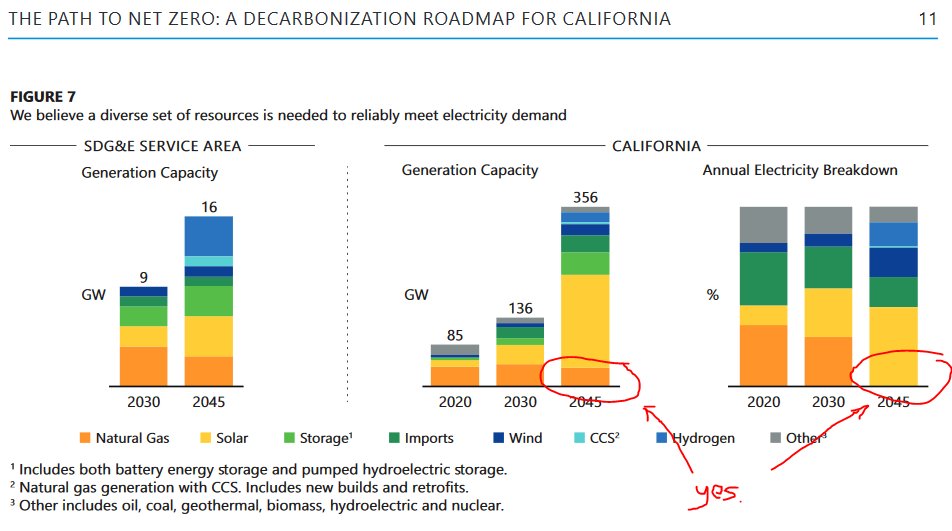
Here's something in a report from San Diego Gas & Electric. See how the generation capacity of gas power plants remains high, but the amount of electricity produced from them ramps down over time? That's due to California's Renewable Energy Portfolio Standards (RE PS). Power producers are required to serve more Renewable Energy over time. Even if they are tempted to run their gas plants more to recoup their investment, they really can't. 


In the future, with high integration of renewable energy sources, all gas plants will operate as peaker plants. If they can't be nimble enough, they will be retired. It's the most rational and economic choice. It's also the only way they will meet California's RE PS which is the law of the land. 

However, if they don't make the investment in modern facilities that can ramp up and down in minutes, the old technology requires them to run many more hours than needed, burning more gas and generating more pollution along the way. 

These old plants are so, so bad. They aren't responsive enough to serve the needs of today's grid with high renewables content. They are wasteful of money and fuels.  They generate high amounts of pollution per unit of energy. They require water in a water-scarce region. The OTC plants are even worse because of their ocean water intakes. 

So why wasn't AES Redondo Beach repowered? AES tried. But there was so much opposition from Redondo Beach leaders, they gave up. RB Patch covered it pretty thoroughly and doesn't have a paywall. 
AES officials say the new plant will run more efficiently, have a smaller footprint and provide flexibility for the grid when energy from renewable resources isn't available. 
Opponents, on the other hand, argue that the plant will continue to decrease property values and blight the waterfront, despite a $300 million revitalization effort. Additionally, they point to AES' application and say a new plant will run more often than the current one, and thus produce five to 15 times more particulate pollution.
Anyway, for almost a decade, Redondans have suffered 2-3.5x more pollution than we would have if AES RB had been repowered to the same scale and technology as ESEC. We lived with more noise as the proposed upgrade would have been enclosed to contain sound and ran much fewer hours/days. We also  continued sucking marine life into the water intakes. 

All for what? To say we won? To say that we stopped AES? To cost AES money? 

It certainly didn't help the marine life or reduce CO2/SO2/NOx emissions. 

It didn't have to be this way. 

(I'll write about Grayson another day as it's past my bedtime.)

Monday, July 18, 2022

So your city has declared a climate emergency

 We are experiencing record heat in both North America and Europe, during a La Nina year (when the planet surface tends to be cooler than average).  The only way to stop this long-term runaway heating is to quit emitting so much CO2 and other planet-warming gases. Yet, our elected leaders, even in deep blue states, are not doing the necessary work.

I am so tired of fighting for substantive changes that I wrote about in Data Driven Climate Action. We know that 44% of LA County's GHG emissions comes from the transportation sector. If you add fossil fuel refining, it's over 50%. Over 2/3 of transportation emissions comes from private light-duty vehicles (cars, trucks, SUVs, minivans).  Much of those miles are "junk miles" in the sense that they are short trips that could be done without a car if the built environment were not so auto-centric. 

I have been a bicycling advocate since graduate school in the 1990s, when I was studying gas-phase chemical physics. We knew it was cars back then, and it's still true today. 

Global Atmospheric CO2 was 360 ppm (parts per million) when I volunteered for my first Boulder BikeWeek. 

CO2 was 367 ppm when I volunteered for my first El Segundo Bike to Work Day Challenge in 1998. 

CO2 was 369 ppm when I went to my first Beach Cities Bicycle Network Community Outreach meeting in 1999.  Community outreach took forever. My 21 year old daughter wasn't even conceived yet, which was why I had time to attend the meeting. 

CO2 was 392 ppm in 2011 when the South Bay Bicycle Master Plan was adopted. Cities pledged that they would add the bike lanes when they repaved or did work on any of the streets in the network. Over time, the network would be completed. A few cities did the bare minimum, striping in door zone bike lanes or stenciling sharrows when they repaved streets. Others, just ignored the plan. 


CO2 is 428 ppm in mid-2022.  Here are the existing bike lanes in the Beach Cities. Transportation planners are still expecting people to drive to the beach and ride along the Strand as recreation, not as every day transportation.


Here's the innovation in 2022. Those promised bike lanes will become a Local Travel Network, LTN, suitable for use by all sorts of low-carbon vehicles such as electric golf carts, eBikes, eScooters, motorized wheelchairs, skateboards, etc. They plan to start delivering this network in 2024. Notice how much less ambitious it is than the 2011 plan. It will not include anything other than sharrows and a few beg buttons at existing traffic signals. Unlike the 2011 plan, there will be no new traffic signals to allow cyclists to cross busy arterial streets. 

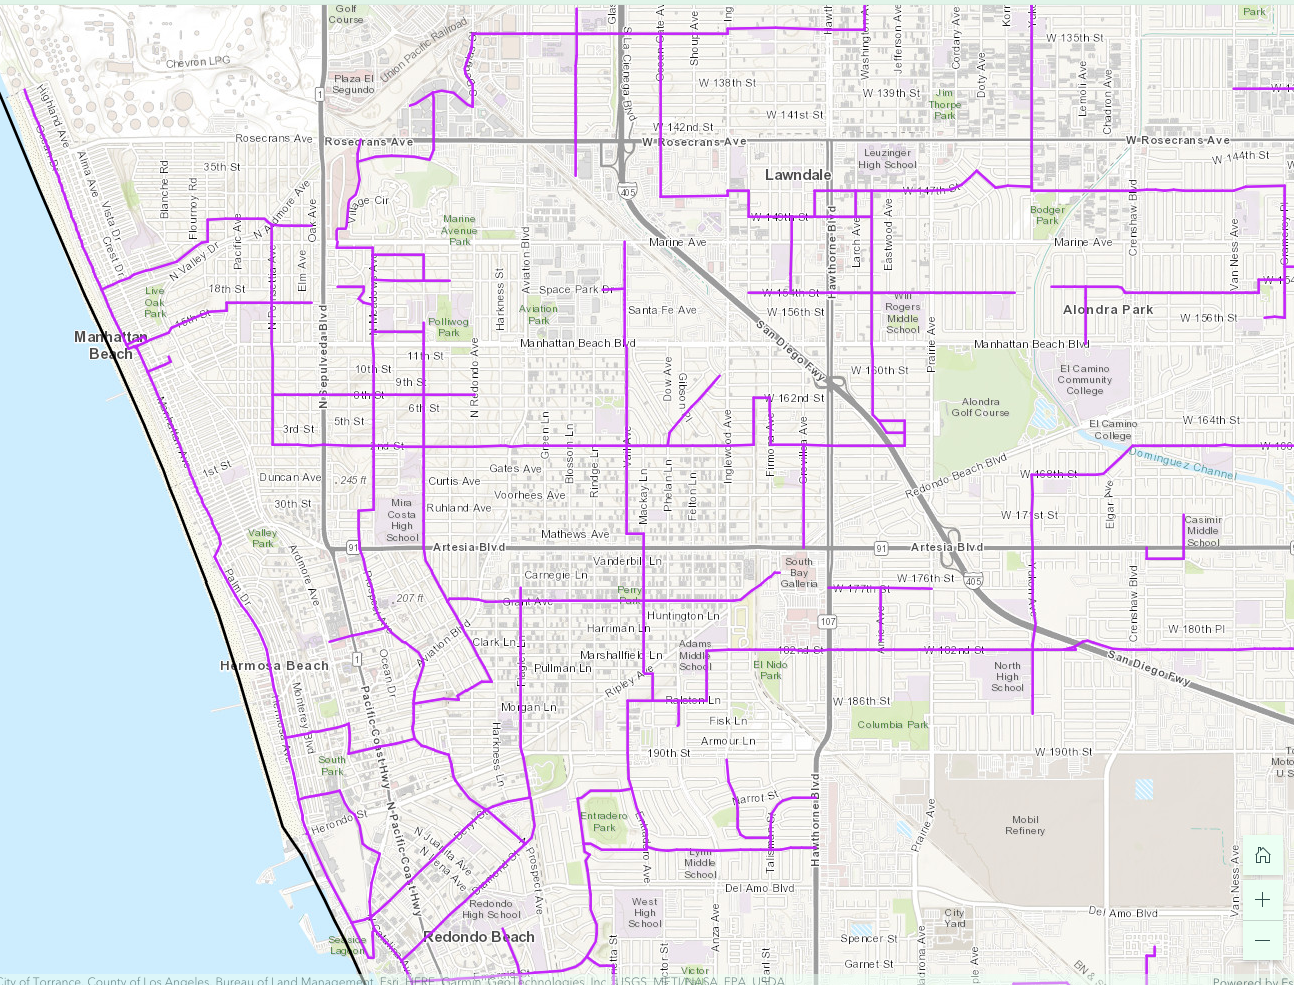
These purple lines are streets/roads where speed limits are 35 mph or less and are not truck routes. But notice how few of them cross the 405 Freeway or any of the high-traffic arterial roads/state highways. 

Not only are the legal crossings few and far between, necessitating long detours, but some of those purple streets are one-way. Going in the reverse direction will require an even longer detour. I can't make anything this ludicrous up. 

Consider the case of a student in North Redondo Beach who attends Mira Costa High School on an inter-district transfer. (The bus from North RB to RUHS in South RB is jammed and leaves kids stranded at the bus stop. To avoid this, some families beg for an inter-district transfer to the closer MCHS.)
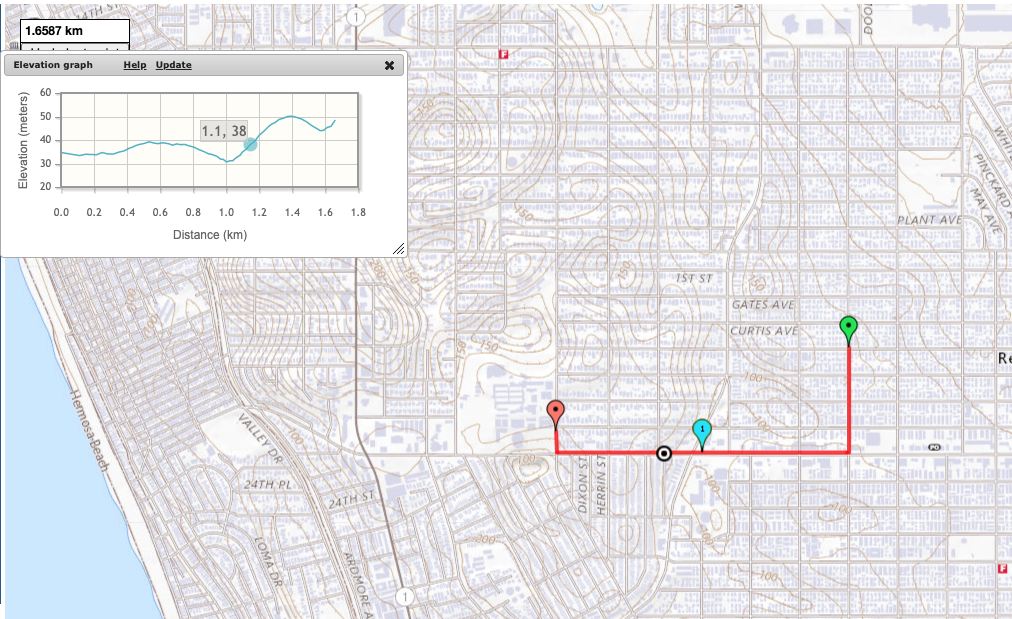
If they had delivered on a bike lane along Artesia Blvd when they repaved it, students could take a direct route with a maximum grade of 5%. Not super pleasant, but doable if you had a protected bike lane.  Of course there is no bike lane of any kind because that would have removed free on-street parking.  Which is more important than our kids' lives and planetary health. 

Direct route: 1.6587 km, max 5% grade

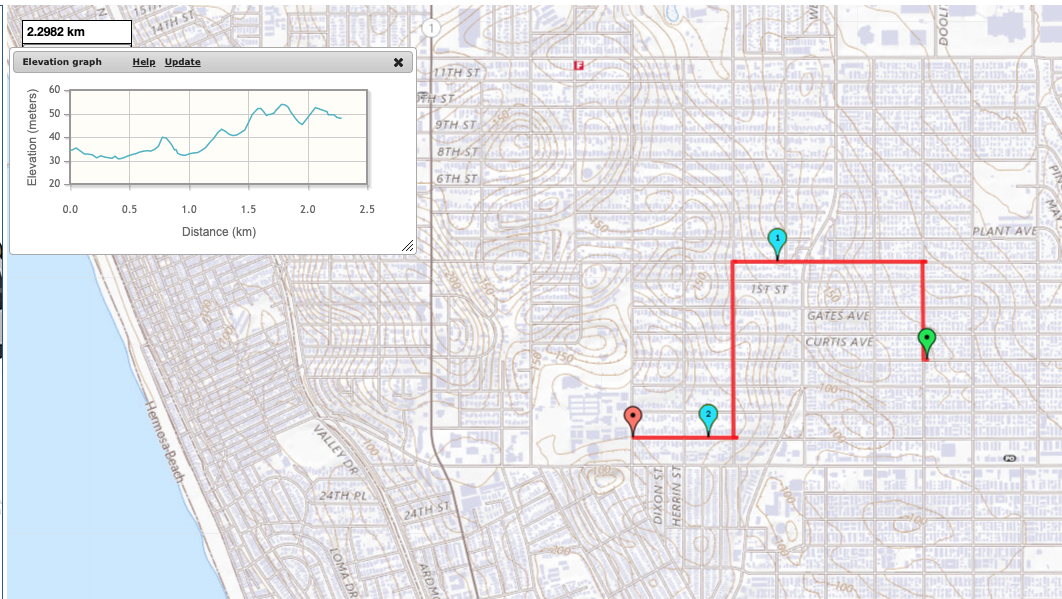
Instead, students must take a roundabout way to an existing traffic light at Robinson/2nd St. 

Westbound detour: 2.2982 km, killer 15% grade short hill

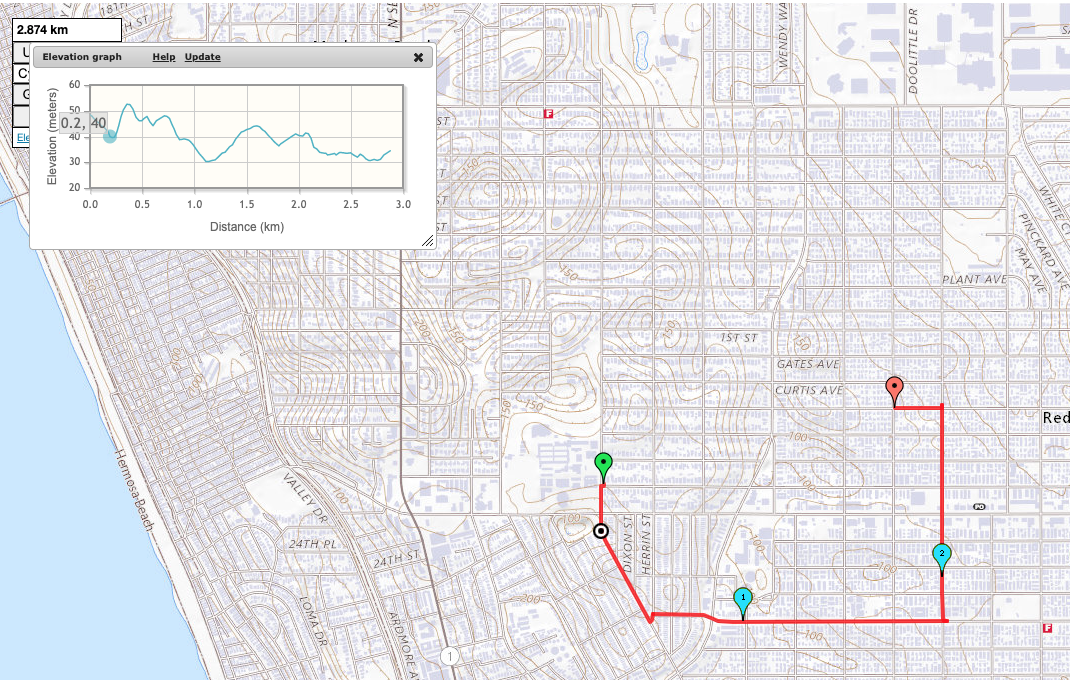
But Robinson is a 1-way street going westbound, and so is Plant, the only other street connected to the east side of that traffic signal. To get home, our student has to take a different detour that crosses Artesia Blvd (CA 91) twice and Aviation at an angled intersection. 
2.874 km, wheelie territory 15+% grade sustained climb

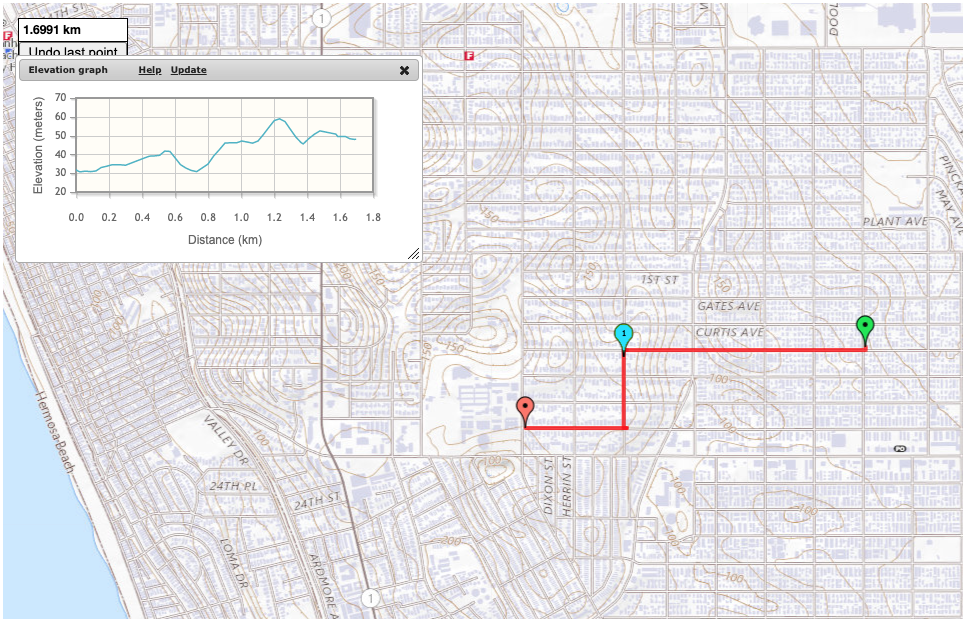
If they had built the 2011 Bicycle Master Plan, with a new traffic signal at Voorhees, our student would have had a reversible direct route. There's a 13% grade climb for half a block. But it's doable with an eBike or a very low gear or if they dismount and walk that section. 

1.6991 km, max 13% grade

(I used mappedometer.com in metric to make calculating grades easier. )

In what world do we expect people in an automobile to take a detour that adds 75% more length to their trip and steepens climbs from 5% to 15% grade? That's just abusive. 

It's late, so I won't dissect why kids are riding eBikes in all sorts of unsafe ways. Spoiler, it's because the streets are hostile and don't allow them to take more direct and safer routes. 

This LTN will not make any difference when completed. 

2024 will look a lot like 2022. Only CO2 will be higher still.  And we'll have more dead kids*. 

* "the crash may have been a result of misaligned crosswalks due to the single diagonal cut handicap ramp, rather than two separate ramps aligned with the crosswalk." 
I have written before about the danger of single diagonal curb cuts.

Thursday, March 31, 2022

Diagonal Single Curb Cuts: I don't care if you live or die

I was walking home from the library and thinking about all the ways that my city doesn't prioritize people trying to make trips without cars.  

Behold, the Single Curb Cut, set at 45 Degrees (on the diagonal) with respect to the crosswalks. It's hard to see underneath the car blocking the crosswalk.


Here's the view after the car made a right turn right in front of me as I approached the crossing. If I were in a wheelchair, or using a walker or shopping (granny) cart to get to the grocery store on the other side of the crosswalk, I would have to step out of the marked crosswalk, make a 45 degree turn to the left, cross in the sidewalk, then pull out into traffic again to go up the other diagonal ramp. 


Notice the dark stain at the foot of the ramp? That's the damp spot left after the recent rain because the Diagonal ramp cut is a gravitational well at the intersection of two crowned roads. People who roll things will always be directed into a puddle with these kinds of curb cuts. 


Imagine yourself in a wheelchair, trying to roll to the grocery store. You have to turn, roll yourself diagonally into the street, slowing yourself down so you don't roll off the sidewalk into speeding traffic.  After you stop yourself, you need to make a sharp turn to get into the crosswalk, then roll outside the crosswalk to approach the diagonal curb cut. 

Turning slows you down, so you could be at a near dead stop. To get back onto the sidewalk, you have to push uphill starting from a dead stop in a low point. Now imagine yourself coming home from the grocery store, laden with food.  Do that in reverse with the extra weight. 

At this intersection, there isn't even a marked crosswalk in the other direction; why direct the ramp towards the middle of the arterial intersection? Omission of a marked crosswalk and a traffic signal across this 35 mph arterial road (40,000 vehicles/day) means you want to suppress people from walking across the arterial at this intersection.  You've already decided to pay for only a single curb cut. So why not align it with the marked crosswalk?