I wrote an LA Voter newsletter (for members of League of Women Voters in Los Angeles County) article about Motonormativity and the way that local, state and federal governments reinforce it with their laws and actions.
Past WIG speaker and public health researcher Isabella Chu, MPH, also spoke about the hidden public health hazard that is the top killer of US children. Indirectly, through air pollution and involuntary inactivity by making active transportation (walking, cycling) dangerous, cars may be the top killer of people in the developed world of all ages.
Transportation, mainly private automobile use, is the largest contributor of CO2 emissions in Los Angeles County and the largest source of PM2.5 pollution (except in the occasional years when particulates from wildfire smoke affects populated areas of LACO.)
Yet, all this is invisible to most people and especially law and policy makers. In California, it is legal to kill with a car as long as you were not intoxicated, were not speeding, and stayed at the scene of the death. This applies even if a driver kills a cyclist in a crosswalk.
ILO wrote a letter to Metro’s Board of Directors for omitting protected bike lanes on the Vermont Ave BRT (Bus Rapid Transit) project plans. The City of LA’s Mobility Plan 2035 (adopted in 2014) promised to address identified shortcomings by 2035 by implementing the plan as each section of the roadways had work done. The Mobility Plan showed Vermont Ave would receive both a protected bike lane and a bus priority lane.
Local actions are even more important as we can no longer count on the Feds to help us. Under the Reagan Administration, Federal transportation dollars were allocated in a rigid formula of 80% to highways and 20% to transit.
The Secretary of the Department of Transportation is Reality TV and Fox Business personality, Sean Duffy. He made headlines recently when he rode the NYC subway with NYC mayor Eric Adams and subsequently told Laura Ingraham on Fox News that "even big men don't want to ride the subway."
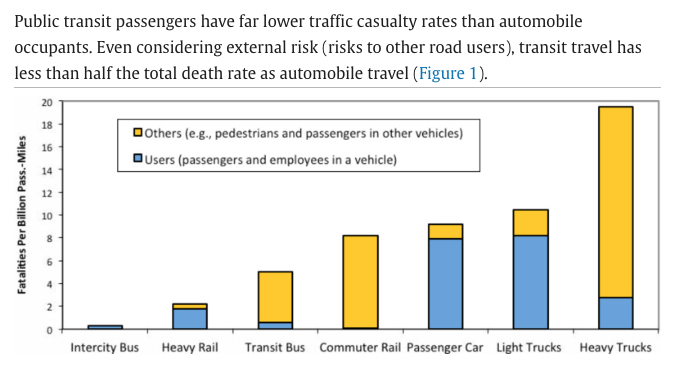
“Most transit trips include active transport (walking and/or cycling) links, and transit users tend to walk and bike more in total than motorists (Lachapelle et al. 2011). These modes have relatively high per-mile casualty rates, although this risk is largely offset by reduced risks to other travelers and improved public fitness and health, so per capita crashes tend to decline and overall health and longevity increase with more active travel in a community (Rojas-Rueda et al. 2011).”
Transit is so safe that a 1% increase in transit mode share would result in a 2.75% reduction in road deaths.
State lawmakers show similar characteristics of motonormativity. Until September 6, 2023, Californians could purchase EVs (electric cars) secure in the knowledge that they would receive guaranteed rebates of up to $7,500 for each EV, and that these would stack on top of Federal rebates of $7,500. The income cap was $200,000 for joint filers. California passed out over $1 Billion in EV rebates.
Contrast that with the California eBike incentive, which has an income cap of $61,320 for a family of 2, and which exhausted the entire $10 Million allocated to eBikes within minutes. eBikes received only 1% as much money as EVs, despite global research showing that dual-mode households drove 19% less than before they obtained an eBike.
“Transportation is a climate and feminist issue. CA DMV data shows that women will spend twice as many years aged out of driving as men. Yet, our cities have not built infrastructure for people who don’t drive.
…
Car dependency is not just ruinously expensive, but it’s destroying the planet, and preventing nondrivers from fully participating in society. Women, as primary caregivers, are paying the time tax of chauffeuring people around. Protected bike lanes are mobility lanes, suitable for children on bicycles and seniors on mobility scooters alike.
Local government decisions have kept us isolated and stressed.”
I have written many times previously about Parking Angst in the Los Angeles region.
But, I want to write a quick post about why we should permit new homes without parking.
Why do we vacation in places without parking and then deny ourselves the pleasure of living in a car-light place in everyday life? People who live in places that look like this (photo from Livable Communities Initiative) do use cars and get deliveries in trucks. It's just that they park on an alley or a remote lot/garage and deliveries take place when foot traffic is low.
I hear often from people that this won't work in LA because our area was built around cars. So let me tell you about two people I met who live in LA and don't own cars.
Person #1 without a car:
I met him several times while he dropped off or picked up his grandmother at League of Women Voters events. As I got to know them better, I learned that the grandmother is 100 years old and has no children nearby. He is her only relative nearby; he lives in an apartment 1/2 a mile away and rides a bike over to her house.
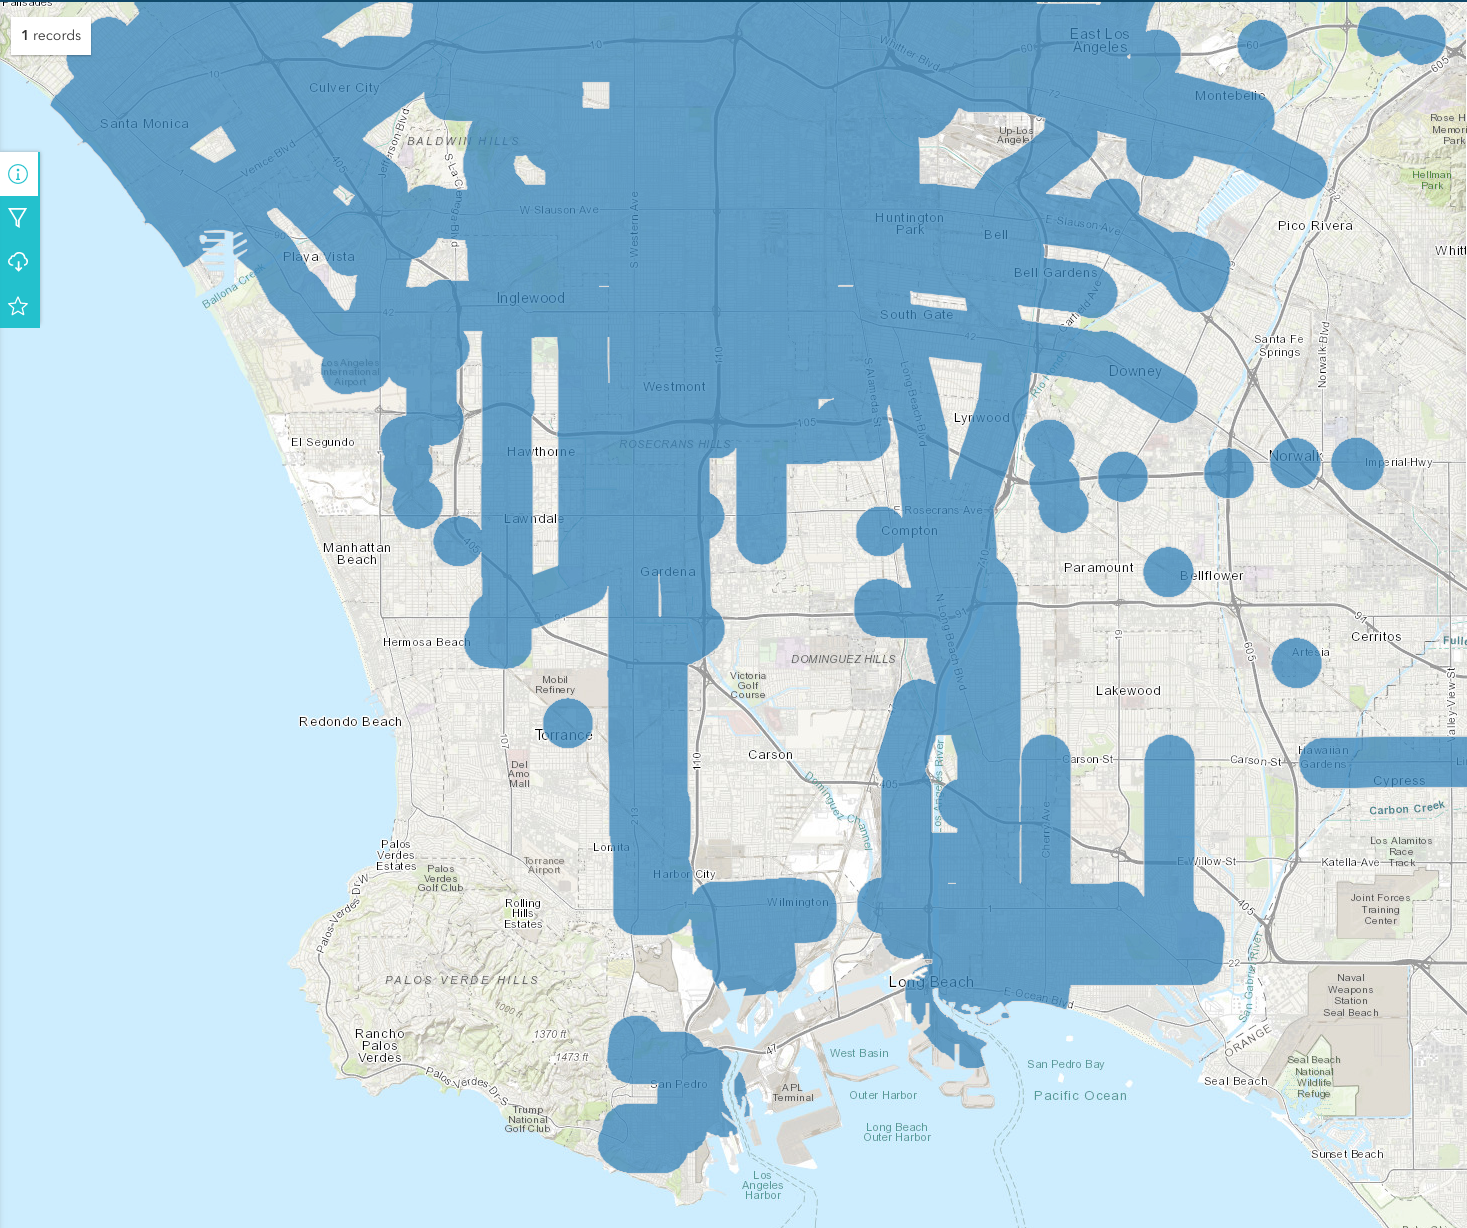
He drives her car to take her on errands (they can do their grocery shopping together) and appointments. He rides a bike or takes the bus otherwise. He lives on a major Metro LA bus line that runs every 10 minutes, which in planner speak is a High Quality Transit Area (HQTA). Click on the link for an interactive map of HQTAs in SoCal.
A car parking spot in this area--close to jobs, transit, and the beach--is very expensive because of the high cost of land. You trade off building housing for people or housing for cars. The grandson chose to live without a car, saving the cost of car ownership and parking. It's a win for him, a win for her (because she has someone close to look after her), and for the community (he works in the arts, which has been struggling in high rent areas).
Allowing cheaper housing without parking is clearly a win-win-win in this case.
Person #2 without a car:
I only met her briefly in Koreatown, but she made quite an impression on me. I was walking from a meeting at Wilshire Center to the Metro B/D station at Vermont and Wilshire. She passed me slowly on her e-scooter while wearing scrubs and a backpack. I caught up to her as we waited to cross Vermont and Wilshire to reach the subway station. We chatted. Then she folded up her scooter and ran into the station, disappearing into the crowd.
She lived in an apartment in Koreatown where parking is a la carte. Her landlord wanted $300/mo (2019 prices) for a parking stall in a garage and she wondered how much she needed a car vs a nice apartment in a newer building.
[Do the math on the $100,000 cost per stall for a multi-level parking garage, then double it for underground parking. $300/mo is not an unreasonable price to recoup the cost of building that parking.]
She was wearing scrubs so I assumed she worked in healthcare. She said that she was charged for parking at home and at work. In contrast, her workplace paid for transit passes. She added car payments, insurance, gas, parking, maintenance. She could save so much money, she could rent a car two weekends per month.
She sold her car and bought her own e-scooter to get back and forth to the train station quickly. I asked her how often she rented a car. She said that, she met a boyfriend who has a car. They take weekend getaway trips in his car. On Sundays, they run their errands together and he drops her off at her house with her groceries. She budgeted for rental cars, but didn't need them. She saves the money instead.
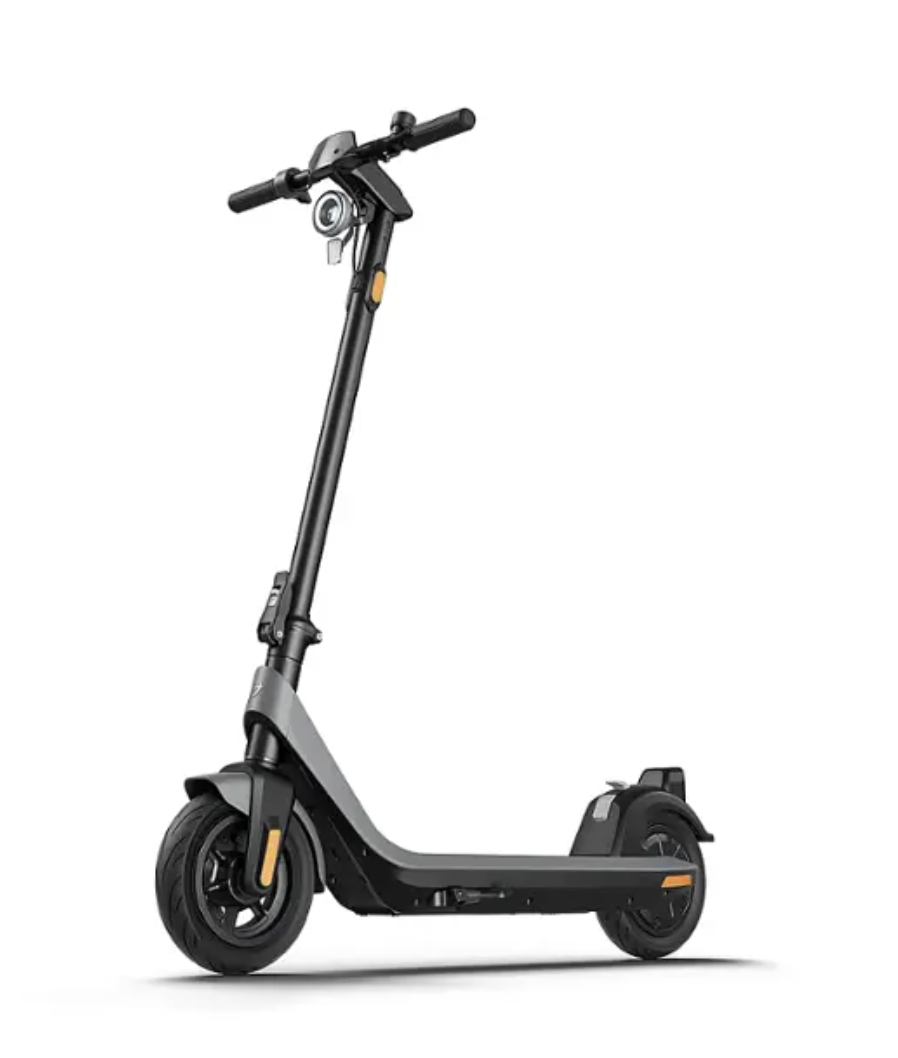
She basically had a 2018 version of this heavy duty, but slower speed scooter, purchased from Best Buy on Black Friday. It cost about one month of parking and she thought it was an excellent value.
Faster speed means heavier motor and more acceleration (could be dangerous if you are inexperienced or lose your balance). More range means heavier battery to haul on buses and trains. If you are just going (first and last mile) to transit, and can charge at home or at work, there is no reason to get a longer-range battery. Just buy an extra charger and leave it at work.
She convinced me. I bought a similar e-scooter, just in time for Covid and staying at home for Zoom meetings. You can see a picture of my husband riding the e-scooter and me riding my first e-bike on this SBCCOG Story Map.
Before you say, gotcha.
I know that neither of these people live car-free because they rely on someone else with a car. Both of these people live in car-free households, but occasionally share a car with another household with a single car. That's 0.5 cars per household. Why does Redondo Beach require 2.25 parking spaces per studio apartment?
It is possible for some people to live car-light or car-free most of the time, even in LA. Why should we enact all these minimum parking rules to make housing more expensive or impossible to build?
Wouldn't it be lovely if our children could stay near us in coastal California instead of moving to a Red state so that they could afford housing?
I often hear from people that I normally agree with on other issues that supply and demand don't apply when it comes to housing. I don't know why people who study housing all say one thing, and a corner of the advocacy space says another. I do have experience with Berkeley housing markets (albeit from the 1980s) and that soured me on rent control as the sole method to manage scarcity of an essential good.
Berkeley has long had a rent control ordinance and a rental registry to ensure compliance. Jeff Baker wrote some Python code to visualize the public data and it is fascinating. As a scientist, I always like to see real world data compared to idealized models of how things work.
The Rent Board of Berkeley, California maintains an Online Rent Registry with information about apartments and other dwellings under regulation by the city's rent control laws. The Registry lists the initial rent of a rent-controlled dwelling, and all of the subsequent annual adjustments.
The Registry tells us a bit about the city's rental market over time. Using the initial rent of tenancies still active at the present, we can deduce the market price of apartments in the year the tenant moved in. The chart below gives the median initial rent each year 1996-2022, adjusted for inflation to 2022 U.S. dollars, for tenants who are not listed as owners, managers, or any other special class.
Go to his site and read his analysis.
One surprising thing I learned is that, though rents in rent-controlled units are generally lower than in newer buildings not subject to rent control, they do rise unevenly instead of monotonically rise the maximum amount allowed. Rent-controlled rents plateau during recessions.
The population of apartments in the above figure are all older buildings, due to the nature of rent control in California. The rents shown are significantly below the advertised rents of the same size apartment in a new building in Berkeley. For example, some new buildings are currently advertising 1-bedroom apartments for around $3000 and 2-bedroom apartments at about $4200. The rents in old, regulated buildings are discounted by about 1 bedroom.
There's a lot of hand-wringing about how today's building code requiring two staircases results in mostly studios and 1-bedroom apartments with a few 2-bedroom units on corners. So, new construction is heavily weighted towards smaller units. Not too great for families, but fine for 1-2 person households.
Older units subject to the most stringent rent control have to report the new leases within 30 days of signing the lease. Newer buildings only have to report annually, Each dot represents the average rent for initial leases signed in one month. Note that the dots are really tiny, meaning hardly anyone moves. In a university town of 100,000+ population, less than 20 people move into 1-BR rentals.
In Dec 2017, 18 new leases for 1-BR apts were signed at an average rent of $2267 (2022 dollars). A bunch of new apartment buildings came online in downtown Berkeley, allowing people to move. That is when the bubbles become larger. By Dec 2024, 27 new leases for 1-BR apts were signed with an average rent of $1950 (2022 dollars). At the same time that the rent stock got more numerous, more modern (new units), it got cheaper in real dollars.
Remember, older rent-controlled units have to report monthly. Newer buildings can report annually. The bigger circles are from the months that the newer buildings reported en masse, so the average new rents for those months are higher. In August 2023, a whopping 785 new leases for 1 BRs were signed.
Notice how the small circles are falling faster than the big circles?
What's going on here? I heard that building new, expensive apartments makes rents in older units more expensive!
The data in Berkeley shows that new, expensive apartments makes rents in older units decline! Score 1 for the housing economists who say that supply and demand applies to housing.
There are fewer new 2-bedroom apartments because of the International Building Code (IBC), but the same effect is noticeable in the 2-BRs.
In Dec 2017, 14 new 2BR leases were signed for an avg of $3124.
In Dec 2023, 18 new 2BR leases were signed for an avg of $2529.
In Aug 2023, 275 new 2BR leases were signed, which is less than the 785 new 1BR leases for the same month. (Thank-you IBC.)
IBC hardly ever results in new 3 BR homes. But, when you have too few smaller apartments, people move in with roommates and outcompete families with children for the larger units. Even without building new 3 BR homes, just allowing people living with roommates who would rather live on their own (or in smaller households with fewer roommates), causes the rent for larger homes to stop sharply rising.
In June 2017, 19 new 3BR leases were signed for an avg of $4534.
In June 2023, 110 new 3BR leases were signed for an avg of $4728.
The circles also get larger, meaning that there are more vacancies that allow people to move to something that better suits their needs and desires. That's a win for overall happiness.
So, rent control provides certainty for incumbent renters, but doesn't allow them mobility if they need a larger or smaller unit. It also makes it impossible for new entrants to the market to find housing.
Creating new homes, even expensive ones (IBC is expensive to comply with), can lower the rents on older units.
My local wastewater treatment plant is one of the original CDC Sentinel sites where the CDC samples flu variants circulating in the population. I know that sewage-sheds are not perfect proxies for the general population. But, my wastewater (and that of 4.8 Million people in LA County) goes to the A K Warren Facility in Carson, CA. It's the largest treatment facility in LA County, the US, and among the largest in the world.
The CDC sampled at a number of facilities around the country in different metropolitan areas, determined the circulating diseases discoverable from wastewater, and then formulated the flu vaccine supply accordingly. This is a backwards-looking process. What was circulating last summer may not be what is circulating now. But, there is a long lead time to ordering vaccines and getting shots in arms.
Anyway, we can test for a lot more things now. And, we have the capacity to test at more sites. I'm very nervous about what is at state now that Trump has lost the election and wants to install RFK Jr to lead the CDC. Most people won't know what we lose because they don't even know what the CDC does. This is just a small window in what this agency does.
I just want to provide a few links to useful resources because Google Search has degraded so much, it's hard to find sites. Also, some sites have broken links--either moved elsewhere or lost their funding when the Covid Emergency declaration expired.
Click on See the data at the left toolbar and you reach a page where you can select the pathogen and domain to create charts. For instance, here is the regional Covid-19 chart. Note that the CDC website has data until Dec 21.
New CalSuWers site (made with R Shiny) has data last updated Dec 26. CalSuWers reports to CDC and the national network, so it's showing data that is a bit more recent.
Read the instructions/caveats. Then navigate to the Regional Data top level page. Use the menus of the left to select regional or sewage-shed data. Note that this plant last updated data on Dec 31.
Unfortunately, this data tool only reports Covid-19 data. There's lots more data I found on other sites.
Members of the California Water Environment Association collect a lot more data, including research products in partnership with scientists throughout California and the world.
The best site visualization site I can find right now that collates data from around the US is from WastewaterSCAN, a Stanford-Emory led effort.
Select the region on their national map, then zoom by region and select by sewage plant.
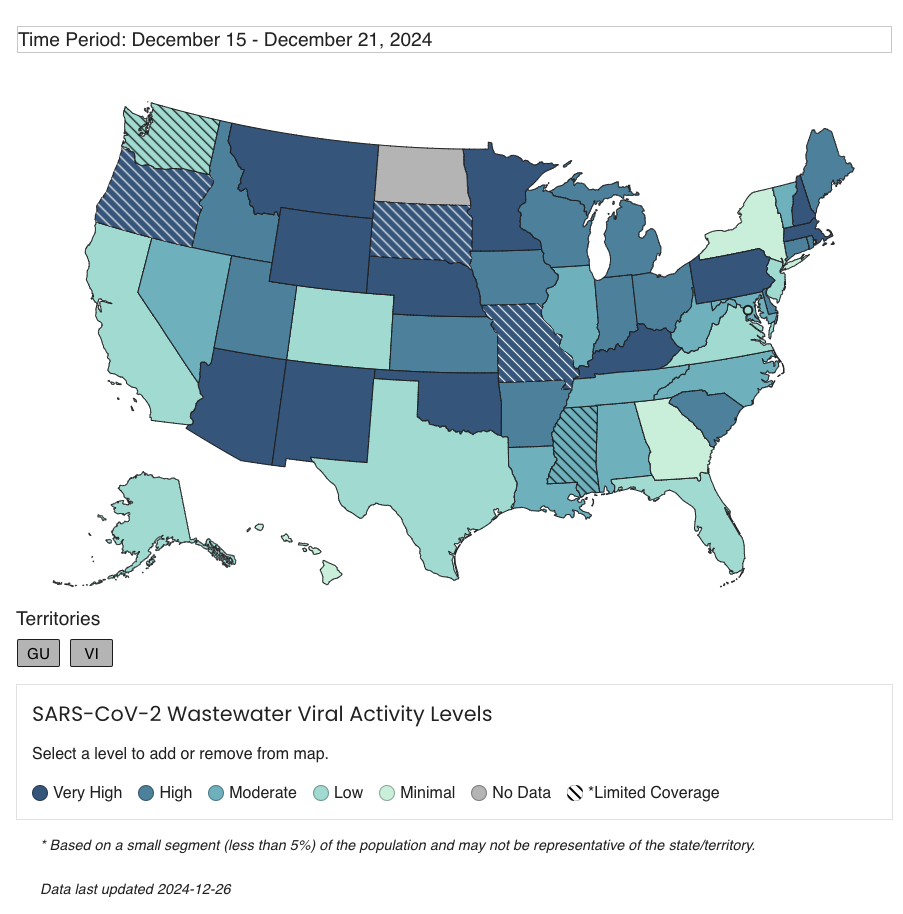
Click View Chart and you can see Covid-19, RSV, Influenza A or B, Human metapneumovirus, Norovirus, Mpox, EVD68, Candida auris, Hepatitis A (for the Warren facility). The number and type of tests vary by location. The most recent data is from Dec 25.
Based on positive detections for Hepatitis A in my subregion, I am glad that I started the 3-shot series that combines vaccines for both Hep A and Hep B. Covid-19, RSV, Inf A & B, and Norovirus are all circulating as well.
Meanwhile, our whole family came down with a cold. We bought the Covid-19 + Inf A + Inf B home test at CVS and we just had a plain old cold. It really ruined our holiday plans.
Los Angeles is in the middle of a record-setting (again!) heat wave. NWS reposts that LAX airport, along the coast, recorded a high of 102 F (old record of 99 F in 2020) while Downtown LA hit 112 F.
Several people asked about our Cool Roof and Heat Pump. I wrote about replacing our asphalt shingle roof with a composite shingle "Cool Roof" back in 2012. Our roof went from reflecting 30% of solar heat (absorbing 70% of the heat) to reflecting over 70% and absorbing less than 30%. If you look closely at the shingles, they incorporate bits of recycled glass, tumbled to a frosted gray, green or blue. From a distance, it looks like a light-medium gray. You wouldn't even know it was a cool roof unless I brag about it.
When you install a cool roof, you mitigate the Urban Heat Island (UHI) impact of urbanization. "Georgescu et al. (2012, 2013) reported that summertime statewide warming due to projected urban expansion for Arizona could be reduced by about 50% with the complete integration of highly reflective cool roofs." SoCal would likely be similar.
So, which should you pick, a cool roof, a green roof, or a photovoltaic (PV) solar roof? The answer turns out to be dependent on local climate and geography. Materials change the radiative impact of buildings. They can reduce the amount of heating during the day, but they can also disrupt the amount of cooling at night. They can heat the air above the city, strengthening the urban heat dome. There are so many variables, it takes a radiative full-physics model and a supercomputer to track them all.
But, if you were in London, Brousse et all found that cool roofs would be most effective in reducing extreme heat. Nonintuitively, green roofs wouldn't make much difference overall (but help during the day). Vegetation makes a minimal difference on a city-wide scale. Rooftop solar might have an overall heating effect, as would running AC. But, if the rooftop solar energy was used to run AC, and people could take shelter from the heat indoors, they could be a net benefit.
Governments can encourage behaviors good for society and suppress behaviors that are detrimental with subsidies/fines. If you were running the government, you would like to find out the cost-effectiveness of different interventions (eg subsidies) and fund what gives you the most bang for the buck. If you had even more money, then fund the slightly less effective but still helpful stuff.
COOL ROOFS reduce heat experienced inside the buildings and in the urban environment. Require them in new construction. Replace dark roofing materials with cool roofs first. If you have money left over install rooftop solar.
In 2012, I got a 10% tax credit on the cool shingles we used, but that is only a small amount compared to total cost of installation. The shingles cost the same as the darker colors in the same product line that absorbed more heat and didn't qualify for the tax credit. I didn't need a nudge of a few hundred bucks to do what I knew would make my house cooler.
Adding rooftop solar was not on my radar back in 2012 because I figured that the prices were still high and technology was still changing. A few people in our neighborhood installed them, but they were much bigger energy consumers than we are. We hadn't installed a heat pump yet.
When we got our heat pump back in 2020 (or maybe 2019?), people asked why we didn't get solar panels as well. I dragged my feet because the rooftop solar salesmen (and they are always bros) were so sleazy, and I also didn't want to buy anything made with forced labor. I was waiting for the solar supply chain to clean up. I am also waiting until I replace my roof again. The timing just wasn't right.
Besides, I know that California has an excess of solar power during the day. It used to be worse, but utility-scale batteries have been soaking up the excess solar power so that we need to shut down feed in (curtail) solar farms less than in prior years. For the last month, we have been curtailing solar farms during all the hours rooftop solar would have produced at my location.
Even during the heat wave this week, we had to curtail cheap solar farm power.
Yes, even during the hottest day ever (so far) in LA.
There just wasn't much value-add for society if I add solar panels to our cool roof.
I just heard a cringe podcast where they were discussing lack of street parking near our city's high school. One speaker said that, our region is hilly, and eBikes help with that. But not everyone's family can afford an eBike so many kids have no choice but to drive.
This is a classic case of car brain where people no longer notice the high cost of car culture and car ownership.
When our teen daughter was added to our car insurance policy, our premiums when up ~$2,000/yr even without adding another car. If your teen can delay becoming a driver by just one year, you can buy a decent eBike, lock, lights, and panniers. You will also save hundreds of hours chauffeuring your teen.
Another year, another AAA "Your Driving Costs" report has dropped. It's time to update True Cost to Own. The cost of owning and operating a new vehicle in the US has increased to $12,182 in 2023. New cars cost 4.7% higher than in 2022, but used cars went down in price.
Remember, this is an average over the entire US, and Los Angeles tends to have higher insurance and fuel costs (both gasoline and electricity). This is also for the average new car sold which, at $34,876, is significantly cheaper than the typical new car I see in our school district (Tesla Y, ~$45,000-$52,500).
The typical behavior in our area is for the parent to buy a new car and give their old car to the teen. Then they park the old car out on the street, making street parking even scarcer. It's not more people making street parking scarcer. It's more cars.
I'm doing the calculation a bit differently this year, inspired by a LA Times article about a Culver City High School teacher that had their students run the numbers on car ownership over a lifetime. I don't get into the messiness of predicting inflation rates or marginal tax rates.
Annual Increase in Savings: 3% (car costs have been going up faster than that)
Returns: 8.25% from balanced funds above
Taxes: 0% (if in tax-advantaged retirement account)
Then you have $1,0983,667.47 in year 24.
Start when you turn 16, and save a million dollars by 40.
In 50 years, age 66, the car-free saver will have $11,199,484.63.
But, wait, you can save $18,264 pre-tax (33.3% combined CA+Fed tax rate) while $12,182 car costs are post-tax. But then you pay taxes on withdrawal from retirement accounts. So the amount will vary, but the message is the same. Living car-free or car-light (my family) is a huge money saver.
Now I want to talk about the really pernicious part about car ownership, the externalized costs borne by others.
This is painfully obvious to me every time I go to city council to beg for a bike lane and am turned down because "poor people need a free place to park their vehicles" on the public streets.
I am charged the same price for my groceries whether I use the supermarket's huge and hugely expensive parking lot. I walk or bike to post of my groceries. I even bike to Costco for some of my trips. Yet, I pay for that parking lot.
Even though road wear is proportional to axle weight to the 4th power, I am paying property taxes to maintain my city streets even though I get around on a 50# eBike instead of a 4,500# electric SUV.
A 2020 Harvard Kennedy School study found that Driving is more expensive than you think. "Massachusetts' car economy is roughly $64.1 Billion, with more than half of that coming from public funds."
"Using publicly available data, the authors put the annual public tab at $35.7 billion, which amounts to about $14,000 for every household in the state. Those that do own vehicles pony up an additional $12,000 on average in direct costs."
You might nitpick that Massachusetts is snowy and snow plows are expensive. But, a 2021 Ulupono Initiative study in Hawaii found that "Public costs amount to roughly $15,000 per taxpayer ($24,400 per household), annually, even if they don’t own a car."
Furthermore, "Personal vehicles cost an additional $16,200 per household per year. With the public costs above, each household’s costs total $40,600 per year (or 51 percent of pre-tax income)."
Then there is the opportunity costs of the land. "Land value of public lands dedicated to road, highways, and parking is $3.9 billion, covering about 14 percent of the available urban land in our state."
Next time you see me bicycling for groceries, thank me for subsidizing your roads and parking. And drive carefully and slowly around cyclists. Dangerous road conditions are what's holding back the 60% of the public that is "interested but concerned" about riding bicycles. The more of us that are bicycling; the fewer cars in front of you, competing with you for parking, polluting your air, costing your city big bucks in road repair and climate change adaptation...
“Existing law requires the driver of a motor vehicle that is passing or overtaking a bicycle to do so in a safe manner, as specified, and in no case at a distance of less than 3 feet.
This bill would additionally require a vehicle that is passing or overtaking a vehicle to move over to an adjacent lane of traffic, as specified, if one is available, before passing or overtaking the bicycle.”
Drivers are required to pass cyclists with at least 3 feet of clearance (and that is from the furthest point of my bike, including handlebars and cargo). If there is more than one lane, drivers are required to change lanes before passing cyclists, just as they would do when passing another vehicle. This is why it makes sense for cyclists to ride 2-3 abreast in a pack instead of strung out in a single file line. Drivers can pass them in a shorter distance, making it safer and more convenient for everyone.
What did we expect? The College Board is a fundamentally conservative organization that preserves the status quo.
They long offered subject matter tests for Greek and Latin, which is taught at elite private schools, while they did not offer any tests for Asian languages until the addition of Japanese in 1993. They didn't even offer Mandarin until 1994.
What's inexcusable is the deference that we gave to the defenders of the unequal status quo.
When I applied to the University of California, we had to have studied 3 years of a foreign language tested by the College Board. CB did not test for any Asian languages in the 1980s. Thus, I studied German in high school, sitting in the same classroom as Peter Thiel, a native German speaker who immigrated from Germany.
I would have loved to have studied Mandarin instead, but my high school only offered languages accepted by the University of California, while only accepted languages tested by a testing service organized to sort students from elite high schools in the Northeast for elite colleges of the Northeast.
This kind of circularity was mind boggling to observe but I sucked it up and studied German and Latin in HS.
It was so unfair that all the Asian American students, many of whom spoke an Asian language at home, could not enjoy the same privilege as white students who got to learn a language at public school that they can use to speak with their parents and grandparents at home.
Because of US immigration law that severely restricted immigration from Asian countries before 1966, most of the Asian American kids in my HS were immigrants who spoke an Asian language at home.
We had to learn a THIRD language just to get into California's public universities.
Our test scores for European languages were evaluated against kids learning only a second language.
Even worse, we got no credit for knowing Asian languages.
The College Board has power in part because we give them power. We can cut them out.
What if, we didn't give value to AP test scores and the curriculum they represent? What if we taught a more in-depth curriculum, tailored to the needs and interests of the students?
We'd lose some uniformity, but be more relevant to each student. We might even foster more love of learning for its own sake.
Colleges and universities can just request a list of the books and readings used in history classes rather than rely on the AP test to create a de facto curriculum. Have kids supply a writing sample from their history or literature classes.
I've given a talk in December 2022 and am scheduled to talk again in January and February 2023 to groups comprised mainly of older homeowners concerned about lack of transit and wheelchair-accessible housing in their communities. Most are unaware that those are connected.
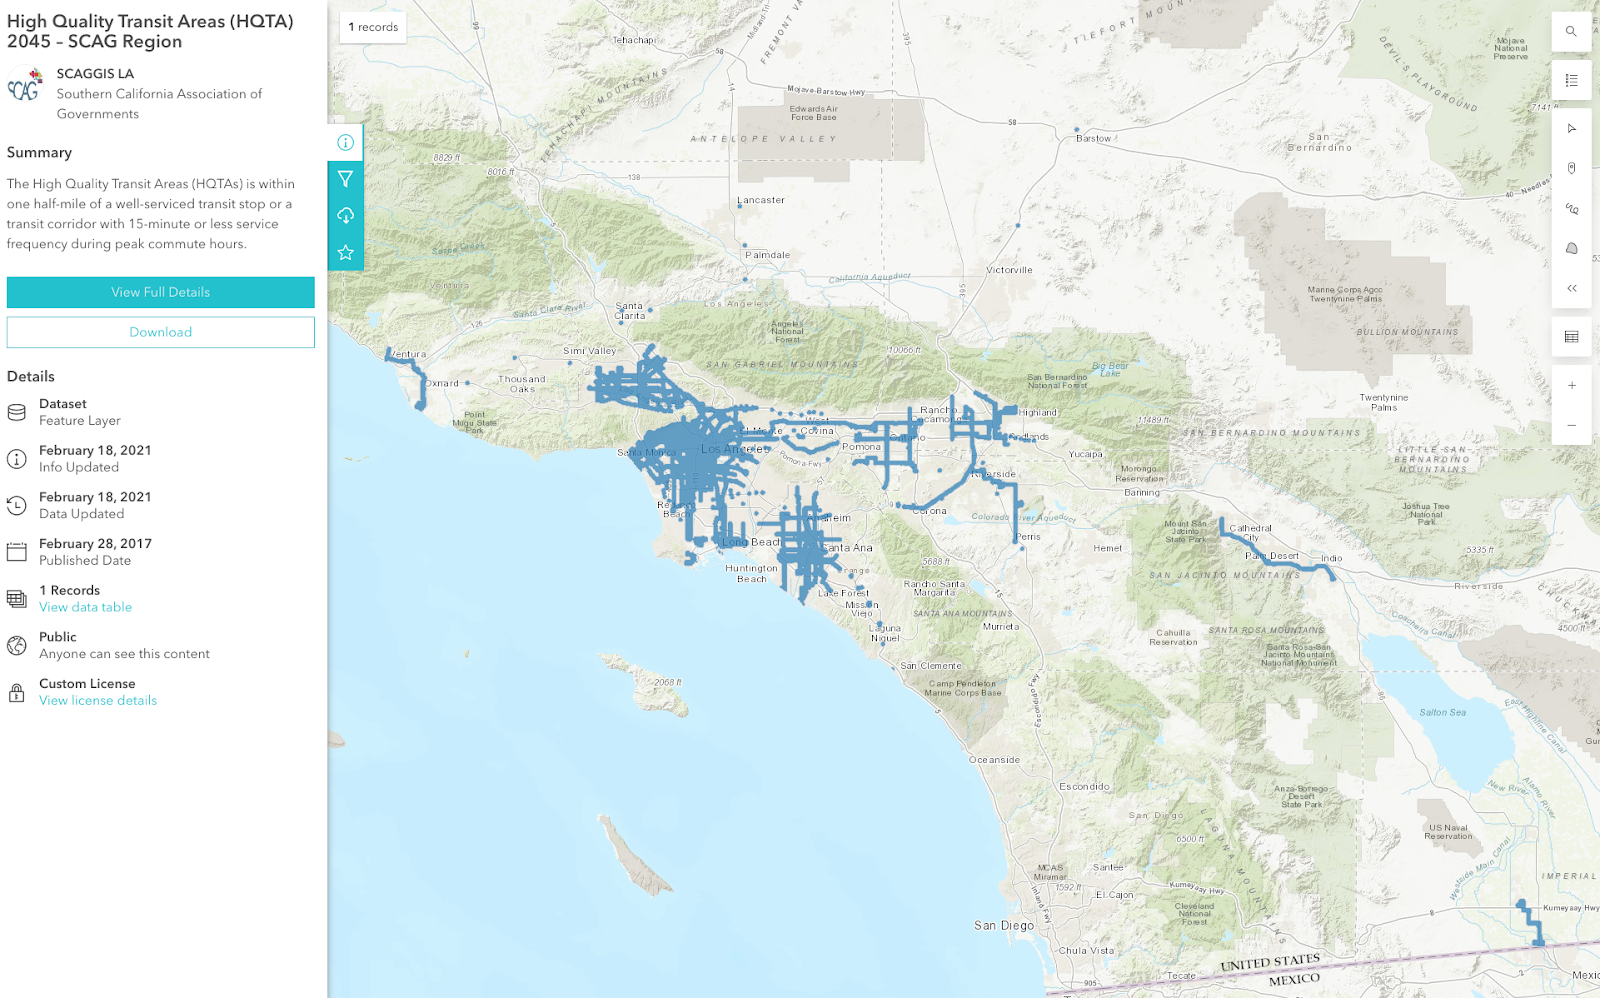
The High Quality Transit Areas (HQTAs) is within one half-mile of a well-serviced transit stop or a transit corridor with 15-minute or less service frequency during peak commute hours.
Founded in 1965, the Southern California Association of Governments (SCAG) is a Joint Powers Authority under California state law, established as an association of local governments and agencies that voluntarily convene as a forum to address regional issues. Under federal law, SCAG is designated as a Metropolitan Planning Organization (MPO) and under state law as a Regional Transportation Planning Agency and a Council of Governments.
The SCAG region encompasses six counties (Imperial, Los Angeles, Orange, Riverside, San Bernardino and Ventura) and 191 cities in an area covering more than 38,000 square miles. The agency develops long-range regional transportation plans including sustainable communities strategy and growth forecast components, regional transportation improvement programs, regional housing needs allocations and a portion of the South Coast Air Quality management plans
Seniors want to stay in their own homes, or at least in their own communities. And they want frequent transit to serve them. They've looked around and are deeply unhappy with what they have found. Why can't we have frequent and good transit like other places they have vacationed at?
Why doesn't the South Bay have good transit? We're visibly a transit hole. High quality, frequent transit does not touch most of the residential areas of the Beach Cities, El Segundo, Torrance and Palos Verdes Cities.
Is it because wealthy people can afford cars and don't need transit? Nope, not if you compare to Santa Monica, Culver City, Pasadena and Beverly Hills.
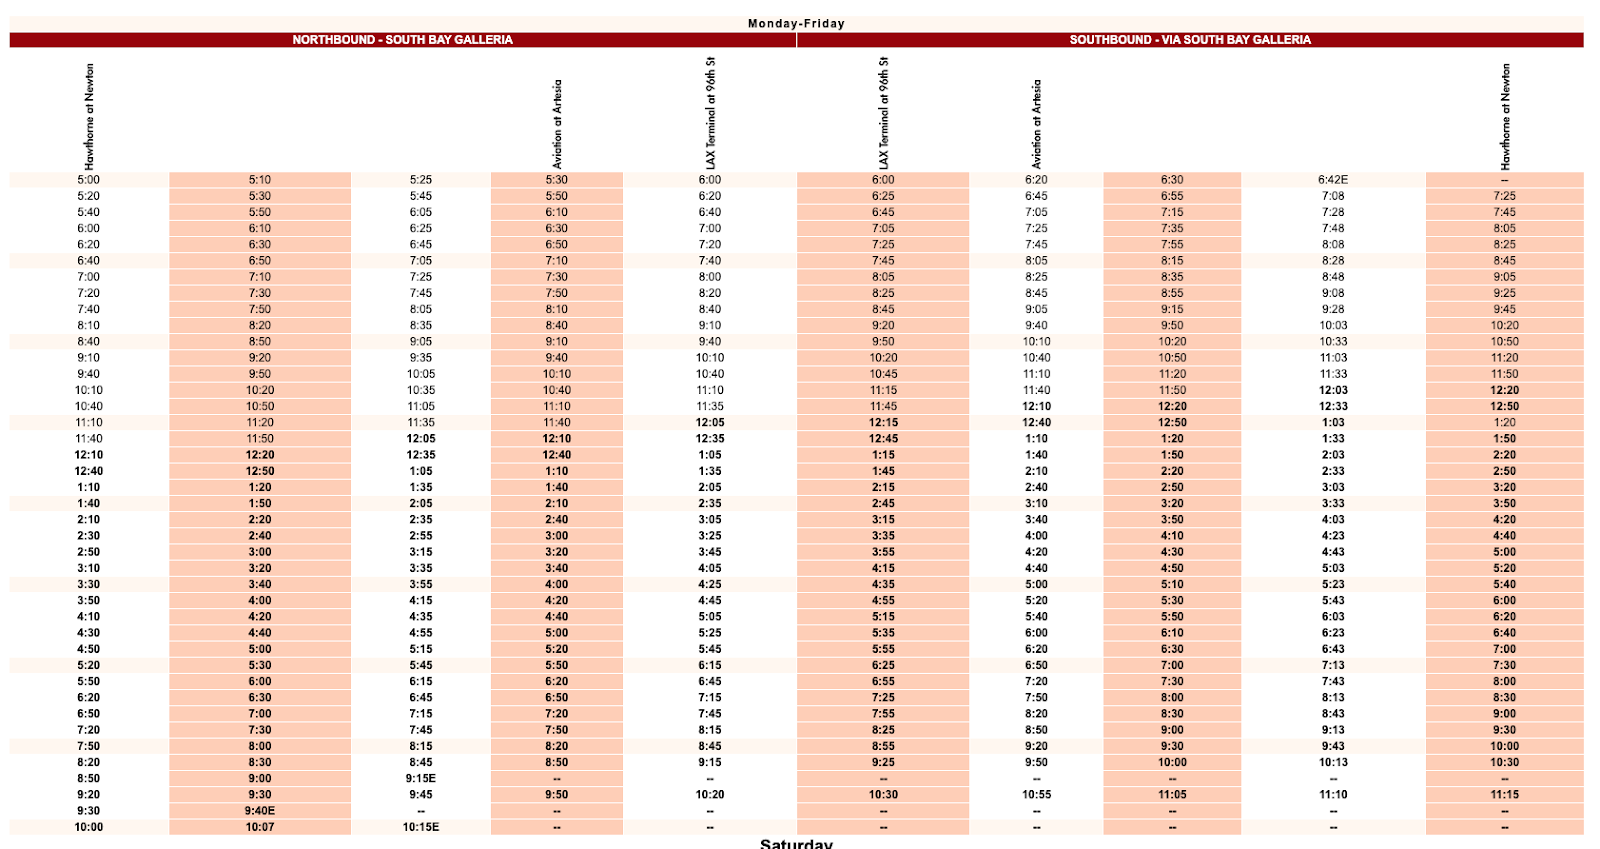
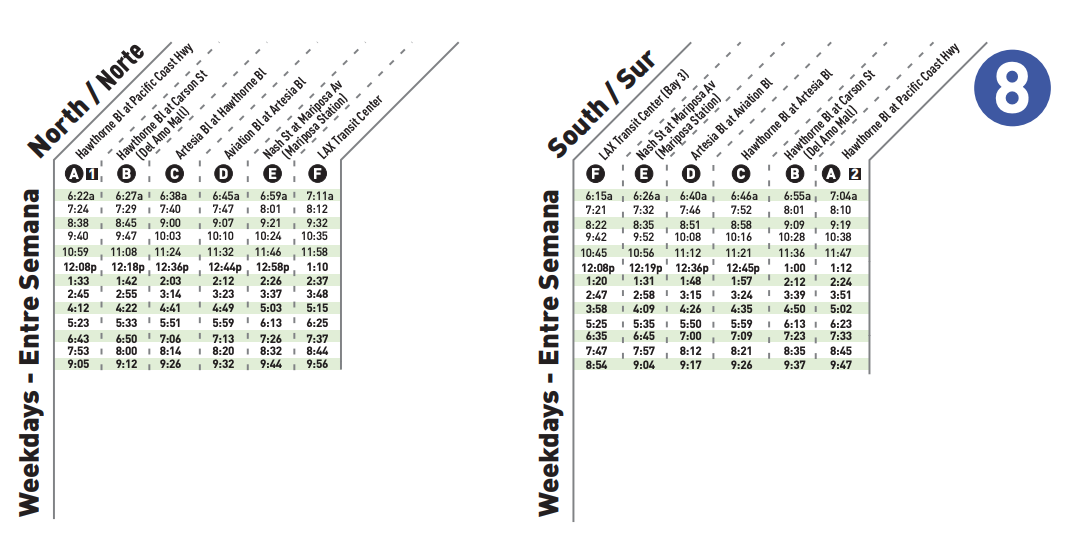
When we purchased our home in the late 1990s, we researched bus lines, bike commutes and USGS geologic maps. We really liked that the Torrance 8 bus ran between our home, daycare, workplace at 30 minute frequency throughout the day and even more often during peak commute hours. Those buses were well-used by people who worked in El Segundo and lived along the route in Torrance, North Redondo Beach and Hawthorne.
Over time, the service degraded noticeably and wasn't reliable any more. That's the main reason why I ride my eBike during the day and drive at night. Transit isn't viable for me any more, even if I want to take a bus to dinner and then walk home (burn off dessert) or catch a ride home with my dinner companions. Even during peak hours, the buses are infrequent and often get canceled at the last minute.
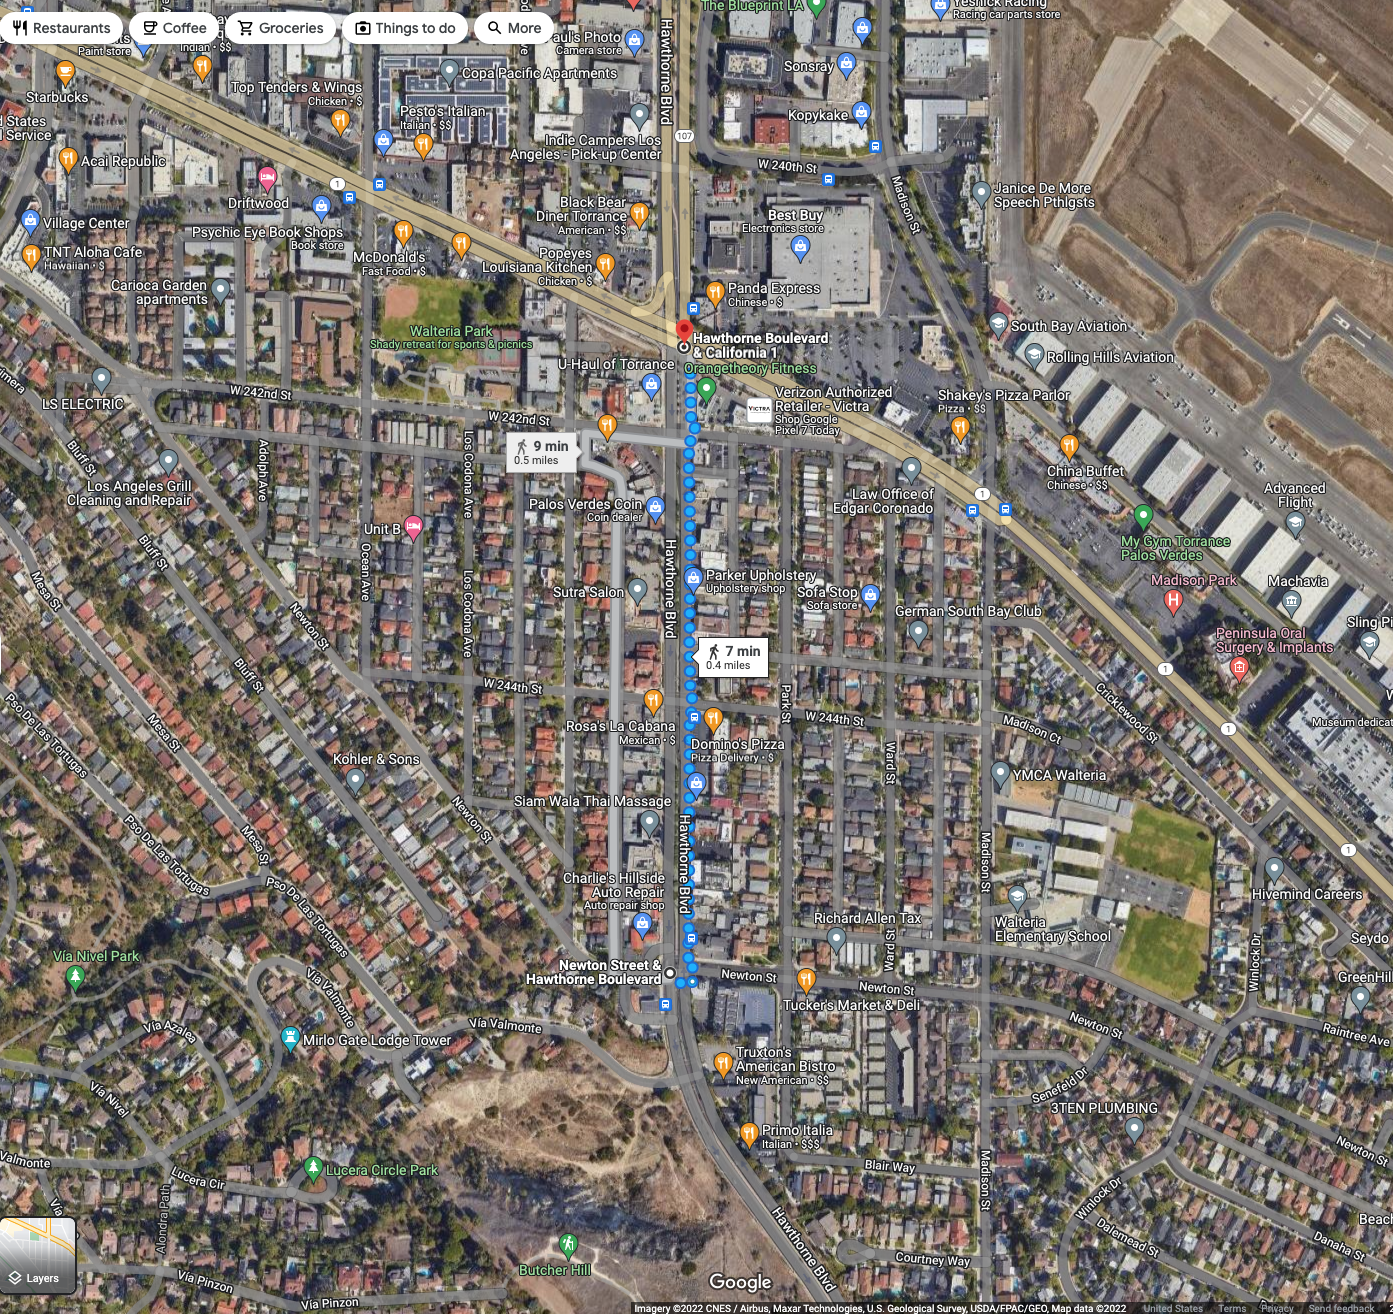
Moreover, the southern terminus of the route used to be at Newton St and Hawthorne Blvd, a short walk from hundreds of homes. Now the route has been shortened to end at the intersection of two state highways, Pacific Coast Highway (CA1) and Hawthorne Boulevard (CA107). To reach the stop, people have to walk farther from their homes and cross wide highways with 7-9 lanes of deafening traffic.
When I regularly took the bus, they were well-utilized. Most seats were occupied at peak hours. Even after peak, about half the seats were taken by people out shopping or going to their retail/service jobs.
Buses operate at a loss. That's why we pay taxes to subsidize them. But roads and parking lots also operate a loss and we never question whether or not they are necessary. Fuel and registration fees cover only about half the costs of roads; the rest comes from general funds.
The cost of "free parking" is borne by customers or tax payers, including those that didn't drive there. The subsidy is flowing towards drivers, not bike riders. In fact, pedestrians receive the lowest subsidy, then bike riders (cost of bike racks), then transit riders, then drivers.
But I digress. Let's get back to poor bus service. The seniors I talk to all want frequent buses that run near their homes. They would prefer the buses to run past their existing homes, but are willing to move to a condo or apartment complex within their communities if that is the only way they will get high-quality transit.
Sounds good. Let's pick some areas to serve intensively with transit, and then build lots of homes there. The more transit riders there are, the better service we can maintain; it's a virtuous cycle that serves seniors aging out of driving well.
Not so fast, building housing is politically toxic throughout the southland. Today's seniors have elected (for decades) local leaders running on platforms of preserving the "neighborhood character" of their "unique community", and fighting "overbuilding" and "Sacramento overreach".
Elected leaders are suing the state of California about whether they should be exempt from state housing law (like the Housing Accountability Act) and questioning both the legality and the numbers in the Regional Housing Needs Allocation.
The State of California's Department of Housing and Community Development (the CA analog of the Federal Government's HUD), tells each regional planning authority how many homes their region needs to build to provide for existing and future residents. Each region decides for themselves how they want to allocate those homes based on their goals and values.
The formula is a product of our professed values. We claim to value opportunity, so we assign more housing near where the jobs are. We claim to value clean air and want to lower Greenhouse Gas (GHG) emissions, so we place homes in HQTAs. We claim we want to address inequality, so we assign more low income housing to places that traditionally have not provided lower income residents.
Conversely, it assigns more higher income housing in poorer communities that can benefit from the tax base provided by higher earners. It's not forced gentrification or ghettofication. It's just trying to level the playing field to help everyone succeed. The goal is to work together with neighbors to solve regional problems like pollution, congestion, and the housing crisis.
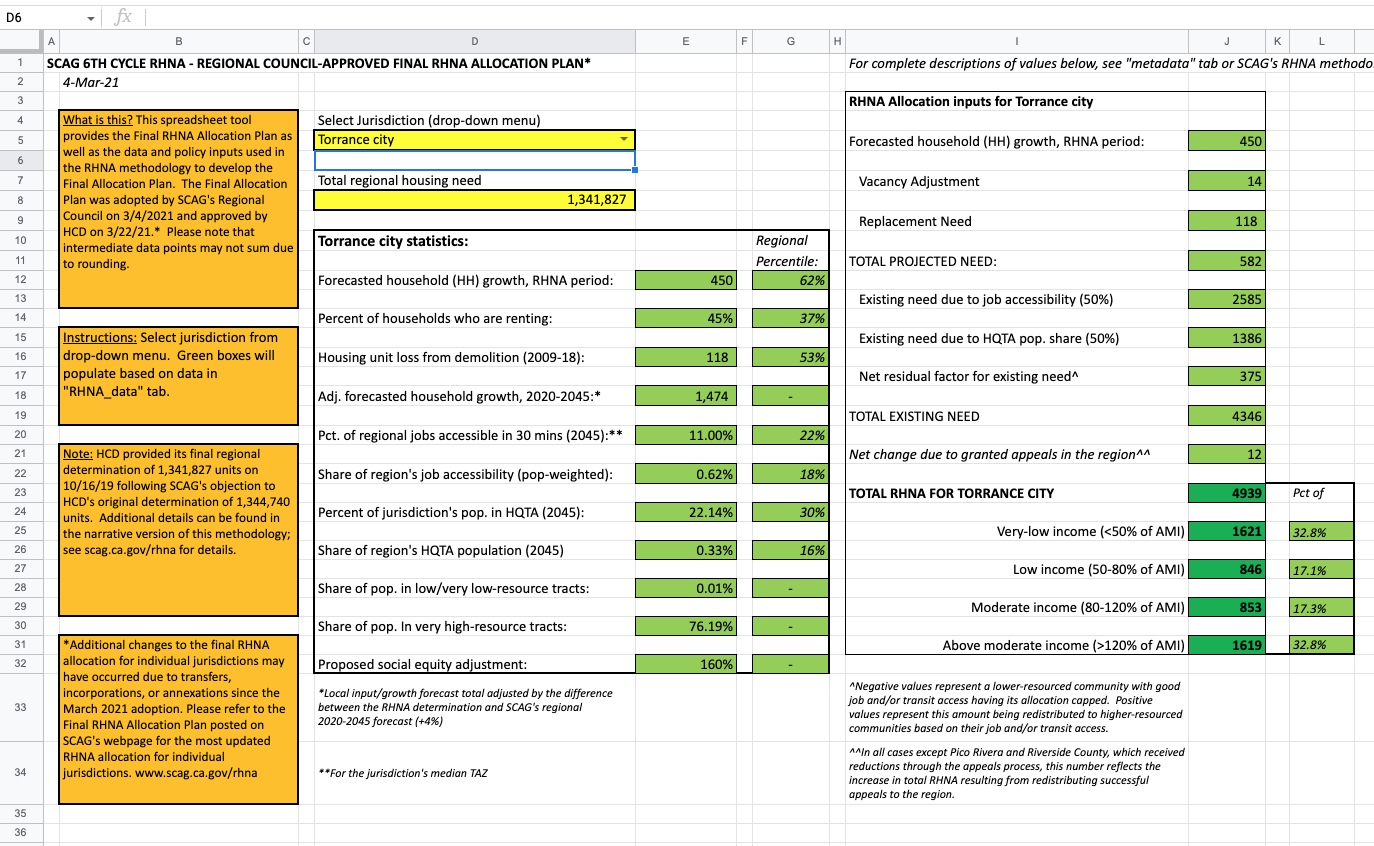
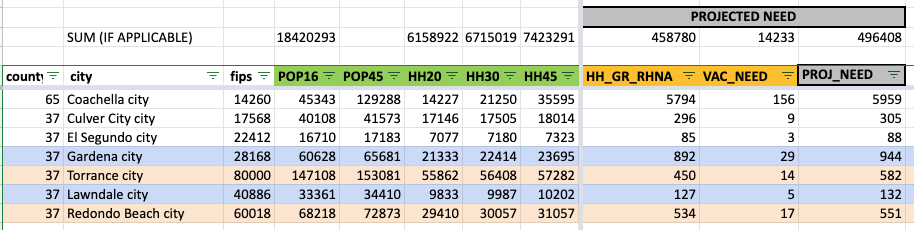
Just select your city of interest in cell D5. Here's Torrance, the city that runs Torrance Transit and presided over its demise. Torrance is big mad at their 6th Cycle RHNA "quota" of 4,939 homes over the next ~8 year RHNA cycle. They have never been given such a high allocation before. Their 5th Cycle allocation was 1,450, and they didn't even meet that.
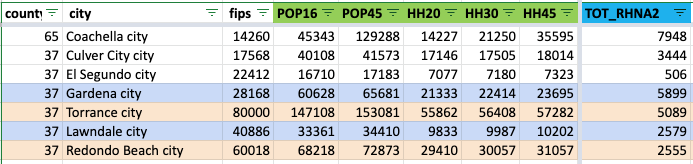
I paired Torrance with their neighbor, Gardena; and Redondo Beach with neighboring Lawndale. Notice how the smaller cities are given higher RHNA allocations than their larger and more affluent neighbors. They are assigned 2-3x as many homes per capita.
Is it because of job access? Look at the SCAG GIS map of Job Centers. Torrance is smack dab in the middle of one of the largest job centers in Southern California, with ~129,000 jobs.
Both loudly-complaining cities, Torrance and Redondo Beach, have more jobs and easier access to jobs than Gardena and Lawndale, hence they were assigned more homes in the Jobs column.
What explains the big differences then?
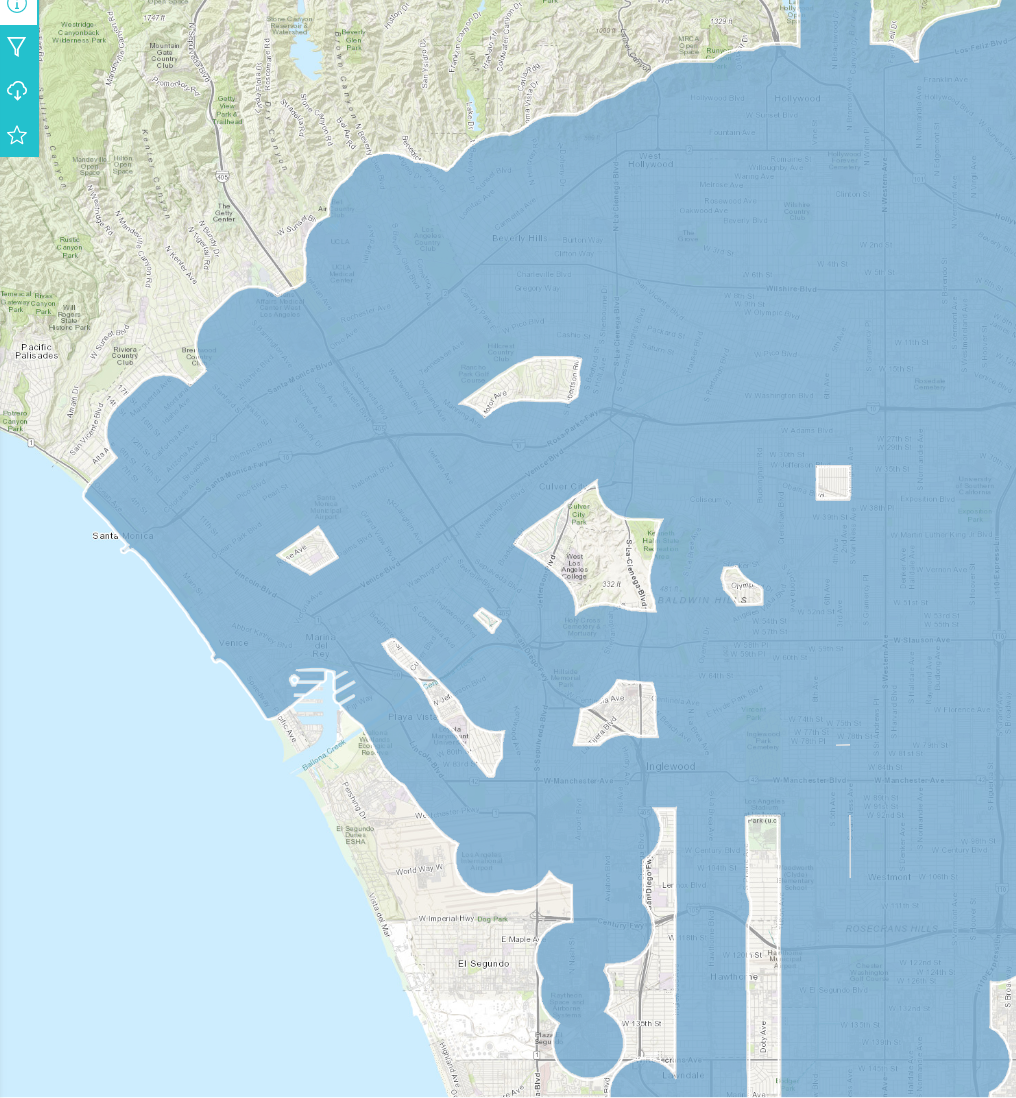
Go back and look at the HQTA map. It's all based on existing population in the HQTAs within each jurisdiction.
The more people already living inside the existing HQTAs used in the planning formula, the higher their HQTA-based RHNA allocations. Most cities like jobs (with the possible exception of pre-pandemic San Francisco) so they don't play as many games with that.
Cities know that the way to finesse lower RHNA housing allocations is to minimize the areal coverage of HQTAs in your city, and then to minimize the number of people who live in the HQTAs.
This is how El Segundo, home to LAX and the 121,000 jobs in the LAX job center,
and with 3 light rail stations inside of their cities and one just over the border at LAX, got allocated just 1 home due to HQTA. Yes, just 1 home!
When El Segundo fought to avoid permitting homes east of PCH, this is the subtext. They gave up land to Hawthorne to avoid having homes in their jurisdiction near a rail station.
Sorry to be the bearer of bad news, but South Bay seniors who want to live in wheelchair accessible home with viable public transit will have to move away. Transit sucks now and will not be added back if it will expand HQTA coverage area. No new homes will be built in HQTAs if local officials can stop it.
(This is also why California enacted laws to preempt local officials to force them to permit home building in HQTAs.)
It's all connected to the decisions made by the people we elected and the incentives they operate under. When they talk about preserving the "neighborhood character" of your "unique community", and fighting "overbuilding" and "Sacramento overreach", they collect donations and win elections.
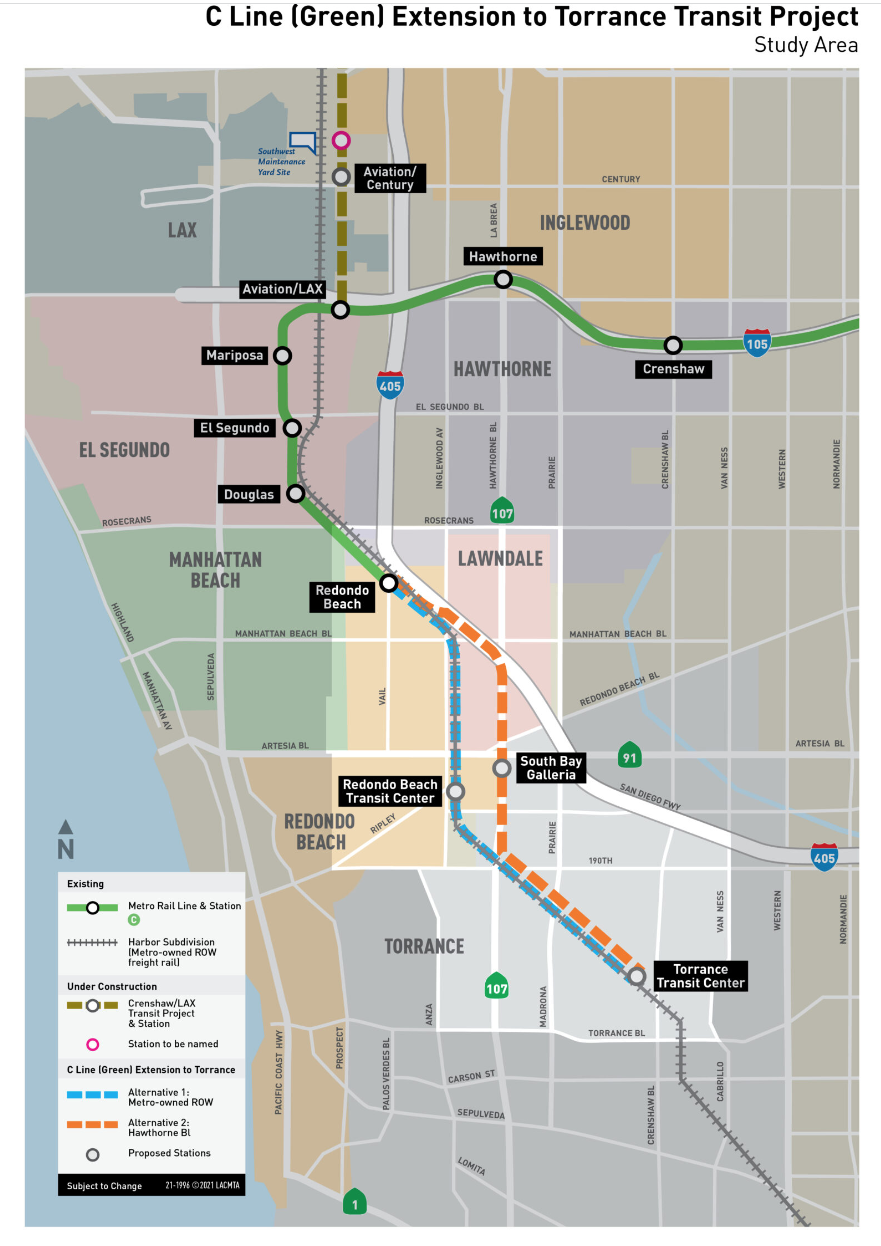
They don't tell you that they will never allow expansion of HQTAs within their jurisdictions if they can help it. This is a large part of the subtext of the fight over Metro C line extension routing. Your elected officials are fighting to ensure you don't get access to rail transit (which is harder to cancel/decrease than bus lines) so that they won't have to build housing.
They don't even want to build in existing HQTAs lest it expose them to higher RHNA allocations in future cycles. So instead, they talk about shadows and view sheds, impose high parking minimums. These all serve to reduce the number of homes that can be built and the number of people in the homes.
They don't tell you that the kind of low-density zoning they are protecting will only every yield townhomes with stairs, built on top of car garages. Low density zoning and height limits makes building accessible apartments with elevators prohibitively expensive to build. They hope developments don't "pencil out" (can't be built profitably), so that the developers go away.
What homes do get produced will be very expensive because they have to cover the parking and land. If you can build 2 stories of housing over 1 story of parking, they have to charge a lot more than if they built 4 stories of housing over the same parking structure on the same land. To maximize affordability, they could even stop requiring parking since seniors and the disabled are much less likely to drive or own cars anyway. Parking is another proxy war to suppress housing.
If you want to solve a problem. then you solve the problem. You don't spend decades screaming the problem doesn't exist. You don't enact ordinances that make the problem even worse. You don't sue people who point out that the problem exists. You don't defund researchers who collect data and evidence on the problem.
This applies to climate change and our regional housing crisis.
Enough, tonight. I just want to point out that it's all related.
Enjoy the Metro C Line (Green) Extension to Torrance Project Simulation Video. Think about how you want to live as you or your parents age out of driving. Think about where you want your children and grandchildren to live as the planet gets hotter and hotter. Do you want them on the cooler coast with you? Then make room for them.
I know that I will fight for a light rail route that is closer to my home. And I will also fight for a 7th Cycle RHNA allocation that can't be gamed by climate arsonists.
Even if we get a higher RHNA allocation based on light rail routing, California law gives us local control about where we place that home growth. We can and should spread it out, particularly as our area ages. The medical industry jobs in Torrance keep growing, and South Redondo Beach is very close to those jobs.
Aside:
Coastal Los Angeles Communities are facing a Silver Tsunami of aging residents and a dearth of younger families. Housing is so expensive, our children move far away. (A few may live with us.) The SCAG RHNA formula projects future housing needs based on demographics of existing residents. If you have few current residents of child-bearing age, then you won't have many births or future residents to house.
Since we have moved homes affordable for young, families so far into the inland deserts, they were assigned higher RHNA allocations than older communities along the coast. I included the data for Coachella in my comparison table.
Coachella has 14,277 Households in 2020, while Culver City has 17,146. Yet, Household Growth in Coachella is projected to be 5,794 while Culver City's is only 296. That's a 20-fold difference!
If you push young people out of your city, you will be assigned lower RHNA numbers. But then, who will help you change your senior diapers? How often will you see your children and grandchildren?
Anyway, stop fixating on "winning" a game of foisting housing elsewhere. Plan for a better future for yourself by planning for a more inclusive future in your community.
I got asked this again and decided to publish this as a blog post instead of in an email because this is such a common misconception.
First, read Vacancy Truths from September 2021 for background. There's a link to Darrell Owens' explanation about why home might be vacant and what we can learn from US Census Data. If a rental changes tenancy every 2 years, and it takes a month to clean/rehabilitate/lease out the rental. Thus, a 1/48 or 2.1% vacancy rate can mean essentially no open homes available.
As housing stock gets older, it takes longer to rehabilitate the units. Supply chain issues are also increasing the amount of time it takes to build new homes or spruce up old ones. It's not unusual to spend 2-6 months remodeling. A major SoCal developer announced to investors that home building is taking 6-8 weeks longer due to lack of materials and/or workers, citing kitchen cabinets as a major pain point.
The particular question from yesterday was from new homes in Pasadena, CA. She was sure that the new buildings in Pasadena are vacant and that developers get tax breaks to keep them vacant.
In 2010, Pasadena had 59,551 homes (4,281 vacant) and 137,122 people
In 2020, Pasadena had 61,643 homes (3,659 vacant) and 138,699 people
This means that Pasadena added more homes than people in the last 10 years. This is not a failure in planning. This reflects the general trend of households (HH) trending smaller and older people staying in their homes longer, even if they don't need all that space. Younger people can't afford the single family homes (SFH) or don't have the down payments required to purchase SFHs or condos, so they end up living in the apartments downtown.
It's possible that some of the new infill homes in central Pasadena are vacant, but they may still be under construction (lack certificate of occupancy), rentals being readied for a new tenant, or be for-sale condos waiting for a buyer. (For-sale homes are vacant longer than for-rent homes.)
Let's look at the data from the SCAG Local Profiles for communities in the 6-county (Ventura, LA, OC, Riverside, San Bernardino, Imperial) SCAG region. I pulled these charts from page 12 of the Pasadena Local Profile, 2018. They are derived from building permit data. Some of them are rebuilds and do not produce net new homes. (Likely source of discrepancy between the SCAG and Census data.)
Pasadena has done a better than average (for the region) job of building new homes in the downtown area. That is also why so many young people live there. New people (young people forming households, newcomers to the area) will flock to where the open homes are.
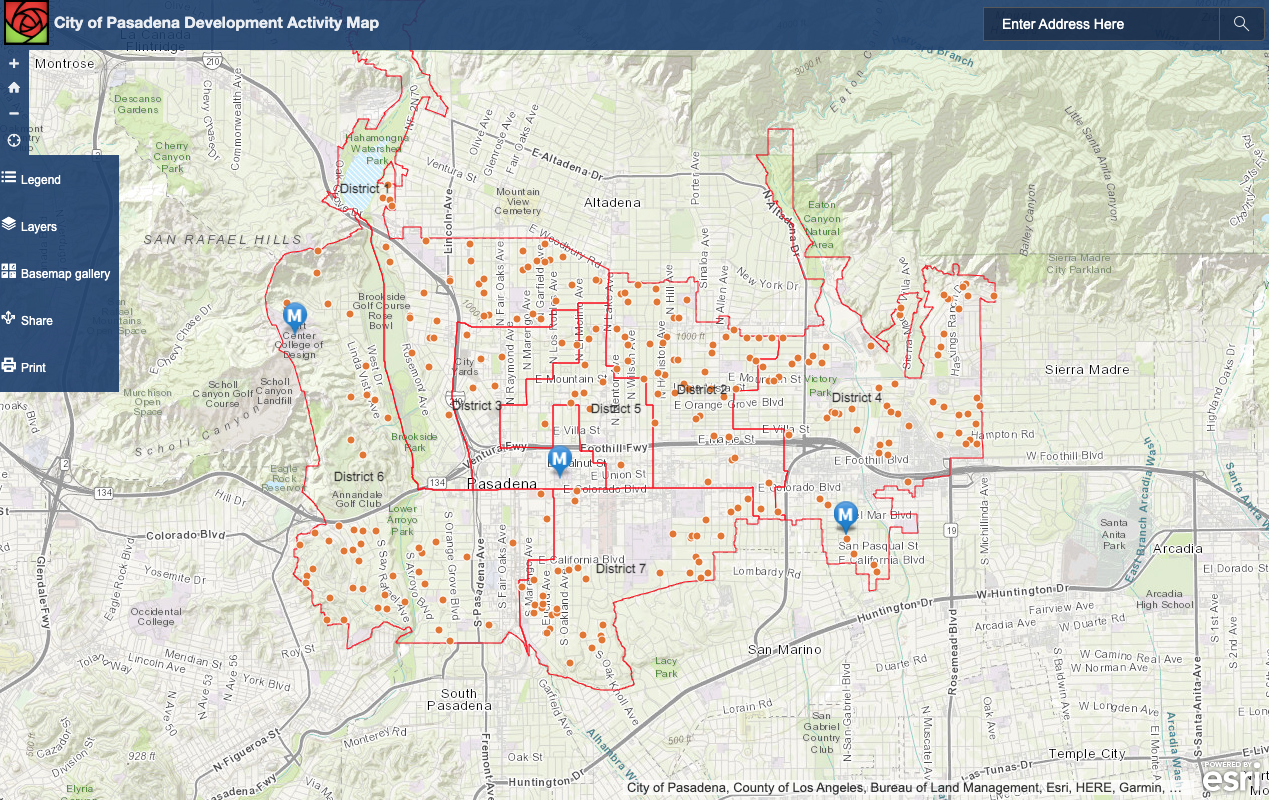
It may seem like there is a lot of construction, especially downtown, but it's a sampling bias. The City of Pasadena Development Activity Map shows building permits distributed throughout the city, but many of them are remodels or ADUs. The big construction projects are downtown, along major streets and freeways, because that is the only place cities allow them to be built. If we are driving around on the major roads (as most of our driving should be) we'll see more of the major projects. Explore the map; click on the orange dots to view data on each building site.
I checked Apartments.com and there are 164 apartments available for lease in Pasadena with next day occupancy (June 14, 2022). I checked Zillow and it shows 218 homes for sale and 152 for rent. I checked hotpads.com and it shows 279 apartments for immediate lease. Anyway, that's well under 1% of rental homes truly vacant, looking for a renter. Sounds like a very tight housing market.
Rate.com says that Pasadena has a 1.2% homeowner vacancy rate and a 2.9% rental vacancy rate. I found it informative to compare Pasadena and Redondo Beach. That "little old lady from Pasadena is real; 27% of Pasadena residents are seniors. But 25% are 20-34.
Pasadena has 53% working age population (20-64) supporting 47% elderly (65+) or youngsters (0-19) for a dependency ratio of 0.89. Redondo Beach has 44% working age population supporting 56%, for a dependency ratio of 1.27. If you don't provide for young people, then your children will have to move elsewhere, and that can socially isolate the elderly as they age out of driving. My home town of Redondo Beach is facing the Silver Tsunami with no plan.