Showing posts sorted by relevance for query parking. Sort by date Show all posts

Wednesday, April 02, 2025

Who lives in those apartments without parking?

 I have written many times previously about Parking Angst in the Los Angeles region. 

But, I want to write a quick post about why we should permit new homes without parking. 

Why do we vacation in places without parking and then deny ourselves the pleasure of living in a car-light place in everyday life? People who live in places that look like this (photo from Livable Communities Initiative) do use cars and get deliveries in trucks. It's just that they park on an alley or a remote lot/garage and deliveries take place when foot traffic is low. 

Pedestrian street lined with 2-3 story commercial or mixed use. Sun umbrellas, people walking around or enjoying the public space without cars.

I hear often from people that this won't work in LA because our area was built around cars. So let me tell you about two people I met who live in LA and don't own cars. 

Person #1 without a car: 

I met him several times while he dropped off or picked up his grandmother at League of Women Voters events. As I got to know them better, I learned that the grandmother is 100 years old and has no children nearby. He is her only relative nearby; he lives in an apartment 1/2 a mile away and rides a bike over to her house. 

He drives her car to take her on errands (they can do their grocery shopping together) and appointments. He rides a bike or takes the bus otherwise.  He lives on a major Metro LA bus line that runs every 10 minutes, which in planner speak is a High Quality Transit Area (HQTA). Click on the link for an interactive map of HQTAs in SoCal. 

A car parking spot in this area--close to jobs, transit, and the beach--is very expensive because of the high cost of land. You trade off building housing for people or housing for cars. The grandson chose to live without a car, saving the cost of car ownership and parking. It's a win for him, a win for her (because she has someone close to look after her), and for the community (he works in the arts, which has been struggling in high rent areas). 

Allowing cheaper housing without parking is clearly a win-win-win in this case. 

Person #2 without a car:

I only met her briefly in Koreatown, but she made quite an impression on me. I was walking from a meeting at Wilshire Center to the Metro B/D station at Vermont and Wilshire. She passed me slowly on her e-scooter while wearing scrubs and a backpack. I caught up to her as we waited to cross Vermont and Wilshire to reach the subway station. We chatted. Then she folded up her scooter and ran into the station, disappearing into the crowd.

She lived in an apartment in Koreatown where parking is a la carte. Her landlord wanted $300/mo (2019 prices) for a parking stall in a garage and she wondered how much she needed a car vs a nice apartment in a newer building.  

[Do the math on the $100,000 cost per stall for a multi-level parking garage, then double it for underground parking. $300/mo is not an unreasonable price to recoup the cost of building that parking.]

She was wearing scrubs so I assumed she worked in healthcare. She said that she was charged for parking at home and at work. In contrast, her workplace paid for transit passes. She added car payments, insurance, gas, parking, maintenance. She could save so much money, she could rent a car two weekends per month. 

She sold her car and bought her own e-scooter to get back and forth to the train station quickly. I asked her how often she rented a car. She said that, she met a boyfriend who has a car. They take weekend getaway trips in his car. On Sundays, they run their errands together and he drops her off at her house with her groceries. She budgeted for rental cars, but didn't need them. She saves the money instead.
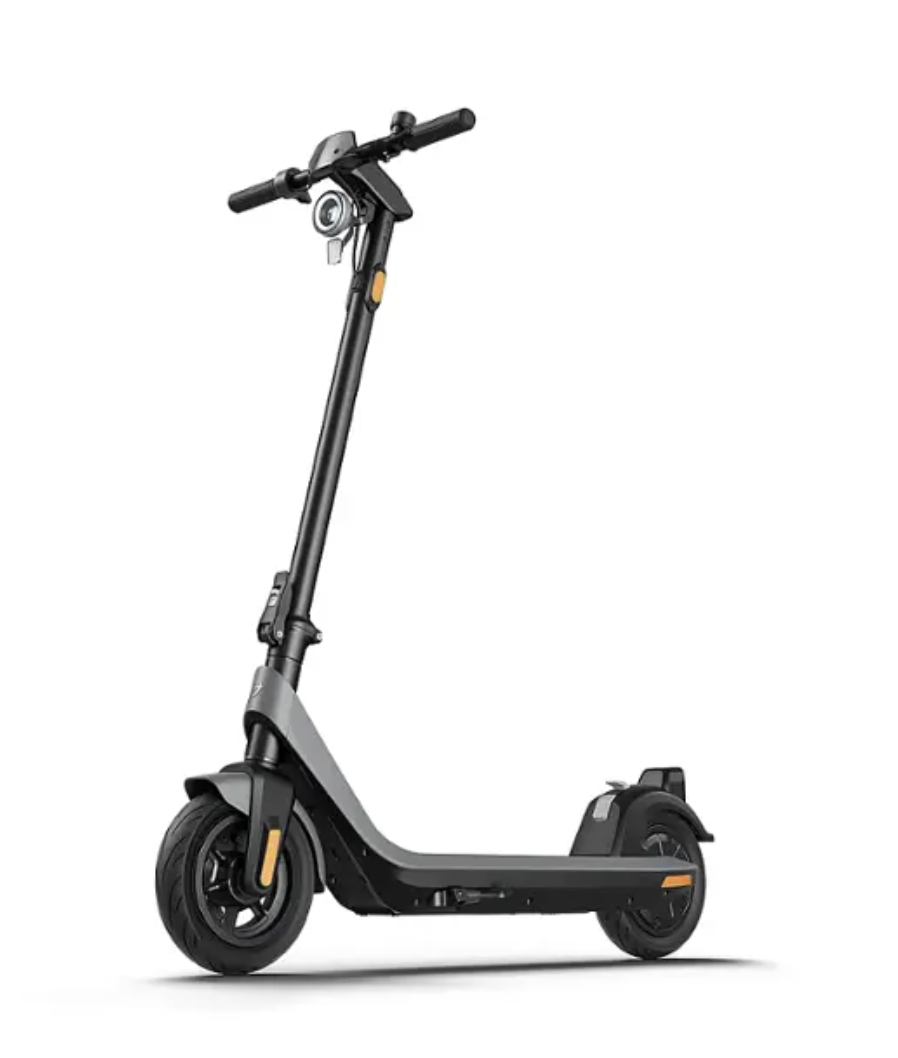

She basically had a 2018 version of this heavy duty, but slower speed scooter, purchased from Best Buy on Black Friday. It cost about one month of parking and she thought it was an excellent value. 

Faster speed means heavier motor and more acceleration (could be dangerous if you are inexperienced or lose your balance). More range means heavier battery to haul on buses and trains. If you are just going (first and last mile) to transit, and can charge at home or at work, there is no reason to get a longer-range battery. Just buy an extra charger and leave it at work. 

She convinced me. I bought a similar e-scooter, just in time for Covid and staying at home for Zoom meetings. You can see a picture of my husband riding the e-scooter and me riding my first e-bike on this SBCCOG Story Map

Before you say, gotcha. 

I know that neither of these people live car-free because they rely on someone else with a car. Both of these people live in car-free households, but occasionally share a car with another household with a single car. That's 0.5 cars per household. Why does Redondo Beach require 2.25 parking spaces per studio apartment?

It is possible for some people to live car-light or car-free most of the time, even in LA. Why should we enact all these minimum parking rules to make housing more expensive or impossible to build? 

Wouldn't it be lovely if our children could stay near us in coastal California instead of moving to a Red state so that they could afford housing?

Sunday, September 18, 2022

Engineering Disinvestment

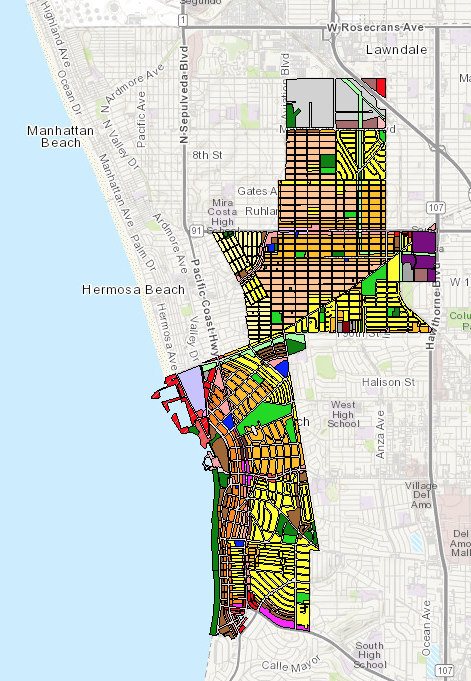
You can engineer disinvestment in communities with weaponized zoning. Let me show you how it was done in my community. 

Behold, the Redondo Beach Zoning Map


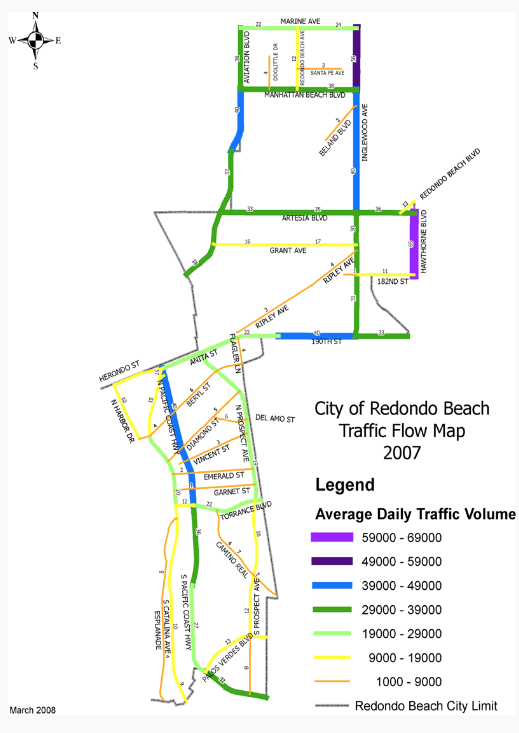
Let me zoom in on two sections, South Pacific Coast Highway 1, and Artesia Boulevard. According to the City's own Traffic Volumes Study, they get roughly the same traffic volumes, 29,000-39,000 vehicles/day (dark green). I verified it on the Caltrans Traffic Census Program website. PCH at Palos Verdes Blvd gets 30,000-33,000 vehicles/day while PCH/Torrance Blvd gets ~40,000 vehicles/day (blue). 


Artesia Blvd used to be CA 91 but the cities assumed control, so their traffic volumes are no longer measured and reported by Caltrans. I looked up a bunch of traffic studies on the Torrance, Lawndale and Redondo Beach websites and it looks like the RB section of Artesia gets about 35,000-40,000 vehicles/day. 

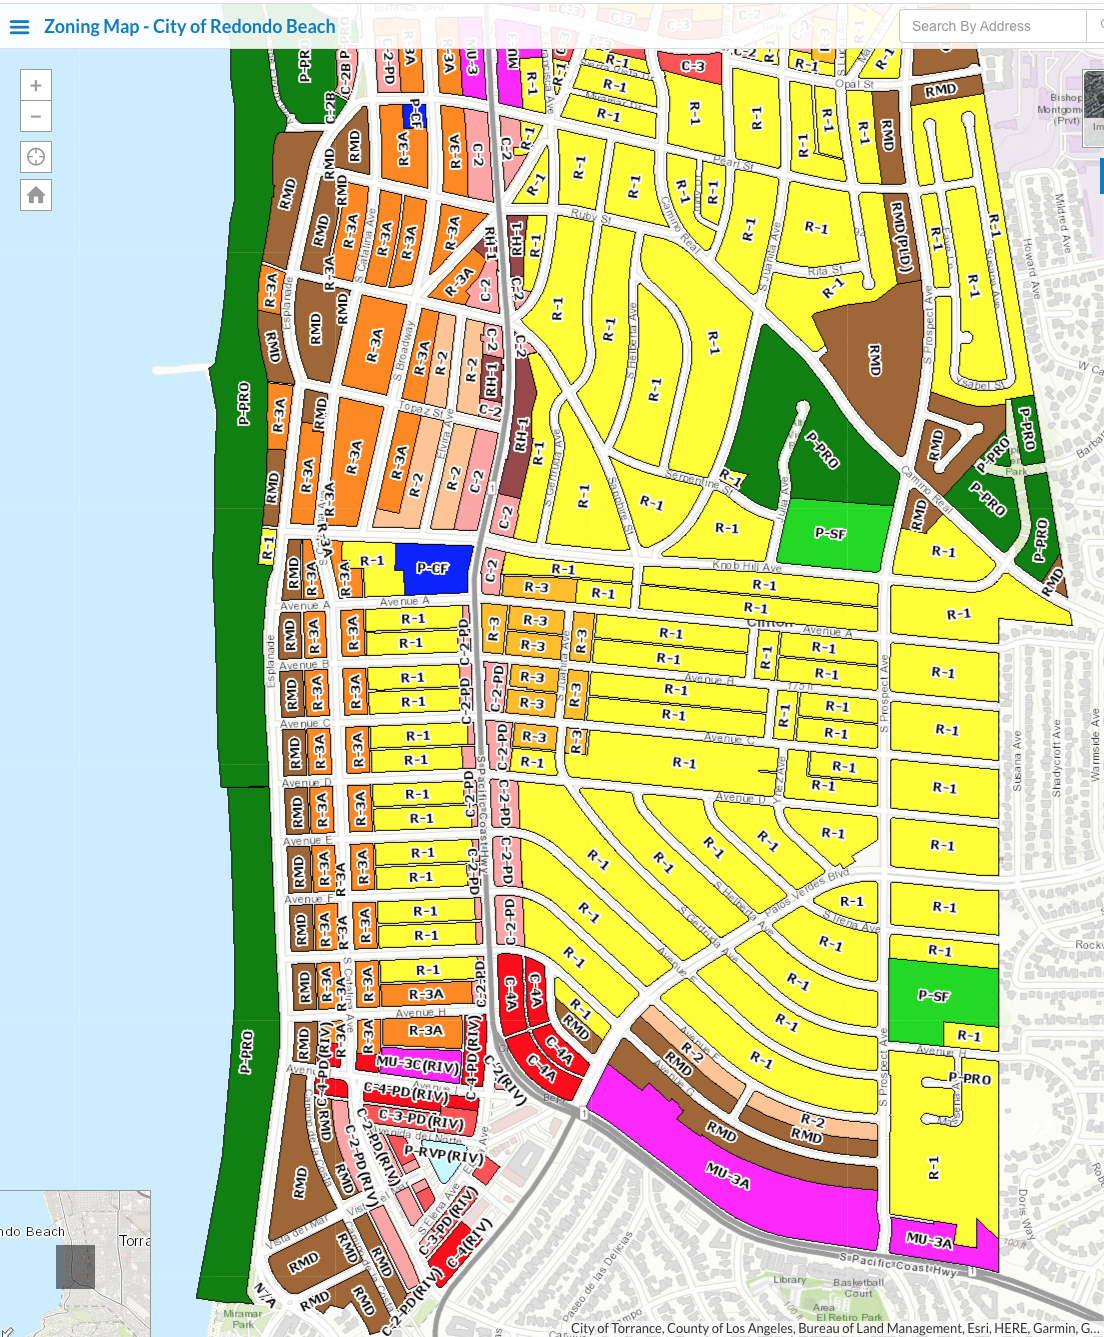
Let's take a closer look at the zoning map in these two areas. 

South PCH has large areas of Single Family Home R-1 zoning. It's low density by design. Yet, the commercial and mixed use areas along PCH from Avenue A to Prospect are all C-2-PD, C-4A, MU-3A. PD stands for Pedestrian-Oriented. 


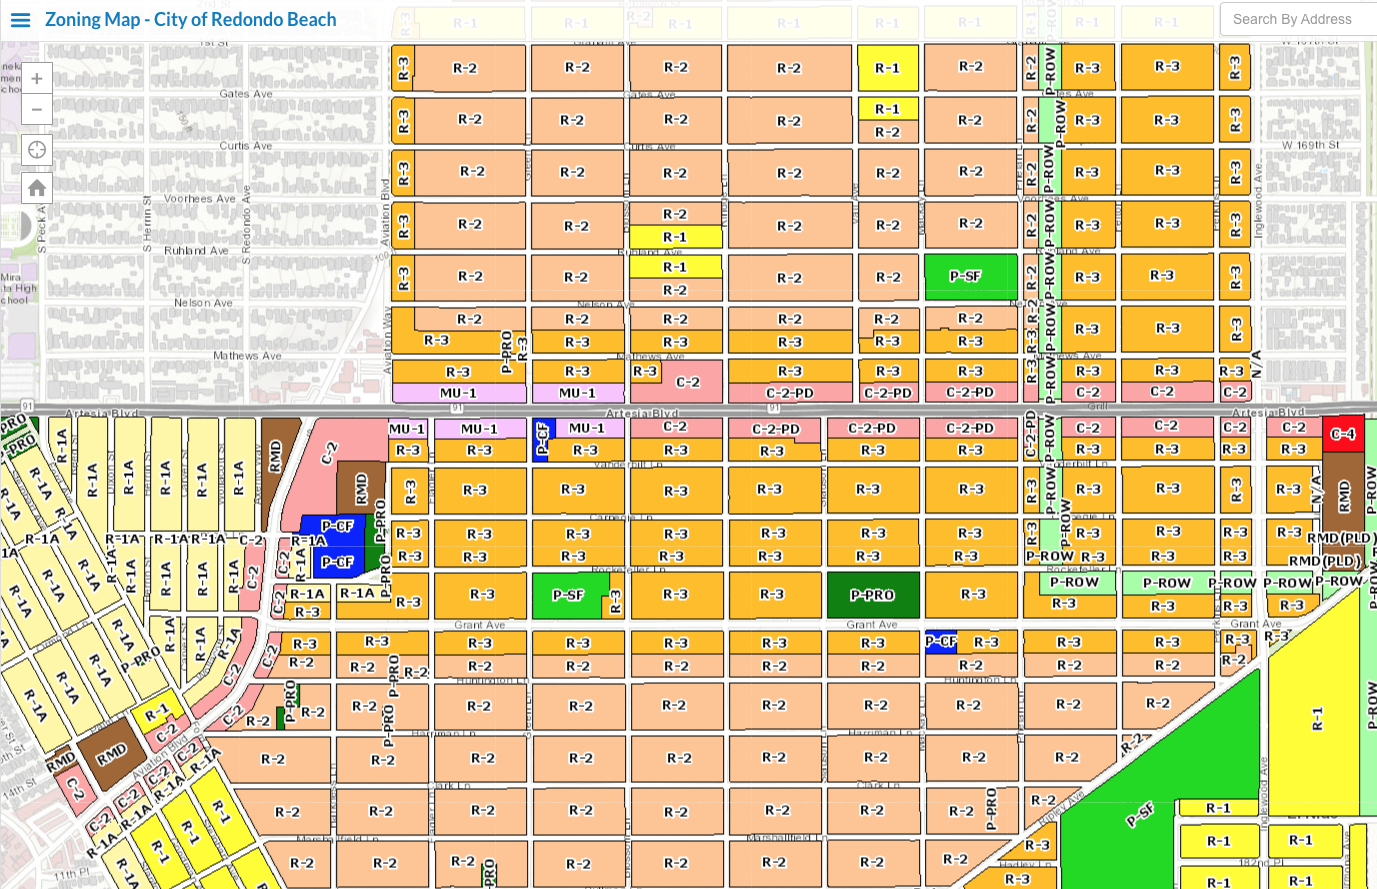
Along the Artesia Corridor, the residential zoning is R3 or R2, 2-3x as dense as along PCH. Yet, the commercial and mixed use areas along Artesia Blvd are zoned mainly for lower-intensity MU-1 and C-2, with 3 blocks zoned at C-2-PD. 


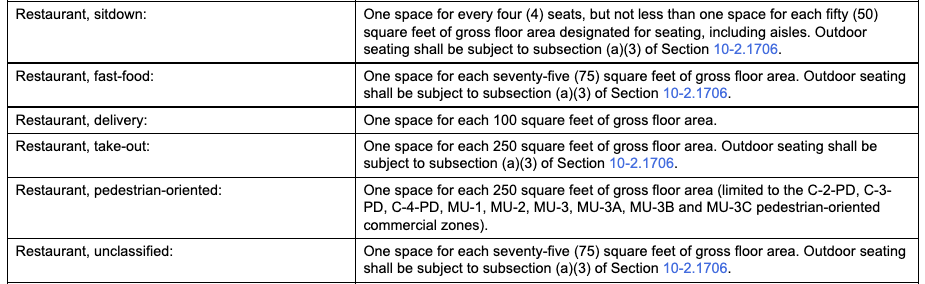
Redondo Beach Ordinance 10-2.1706: Commercial, industrial, and other nonresidential parking standards.


This zoning has a major impact on how the land is developed and how much the land is worth. Take a look at the parking minimums. A restaurant in C-2 needs one parking stall per 50 sf of dining space, including aisles or one space per 4 seats. A restaurant in C-2-PD only needs 20% as much parking, or one space per 250 sf of dining space. 

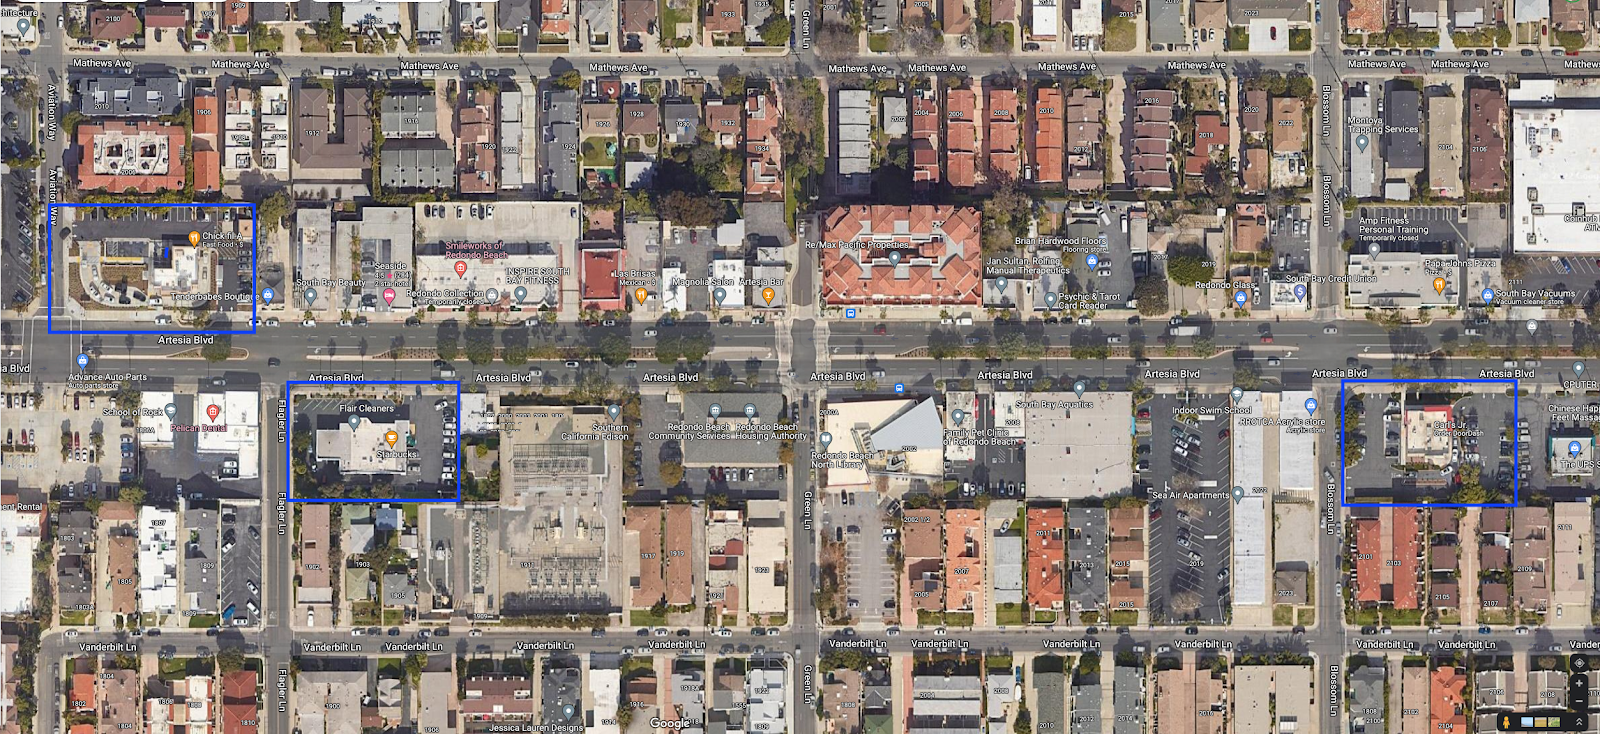
This guarantees vast moats of parking lots, and no new sit-down restaurants can be permitted. Look at the west end of the RB Artesia Corridor. The only restaurants are take-out or drive-through (blue boxes). Even the coffee shops, Starbucks and Coffee Bean & Tea Leaf must be drive-through. 

Needless to say, walking through this area is dreary and hot, with all that asphalt. There is one sit-down restaurant, Las Brisas, that predates the parking ordinance and is allowed to operate. However, should they want to sell the place, and the new owner wants to remodel, they will be subject to the current rules. 

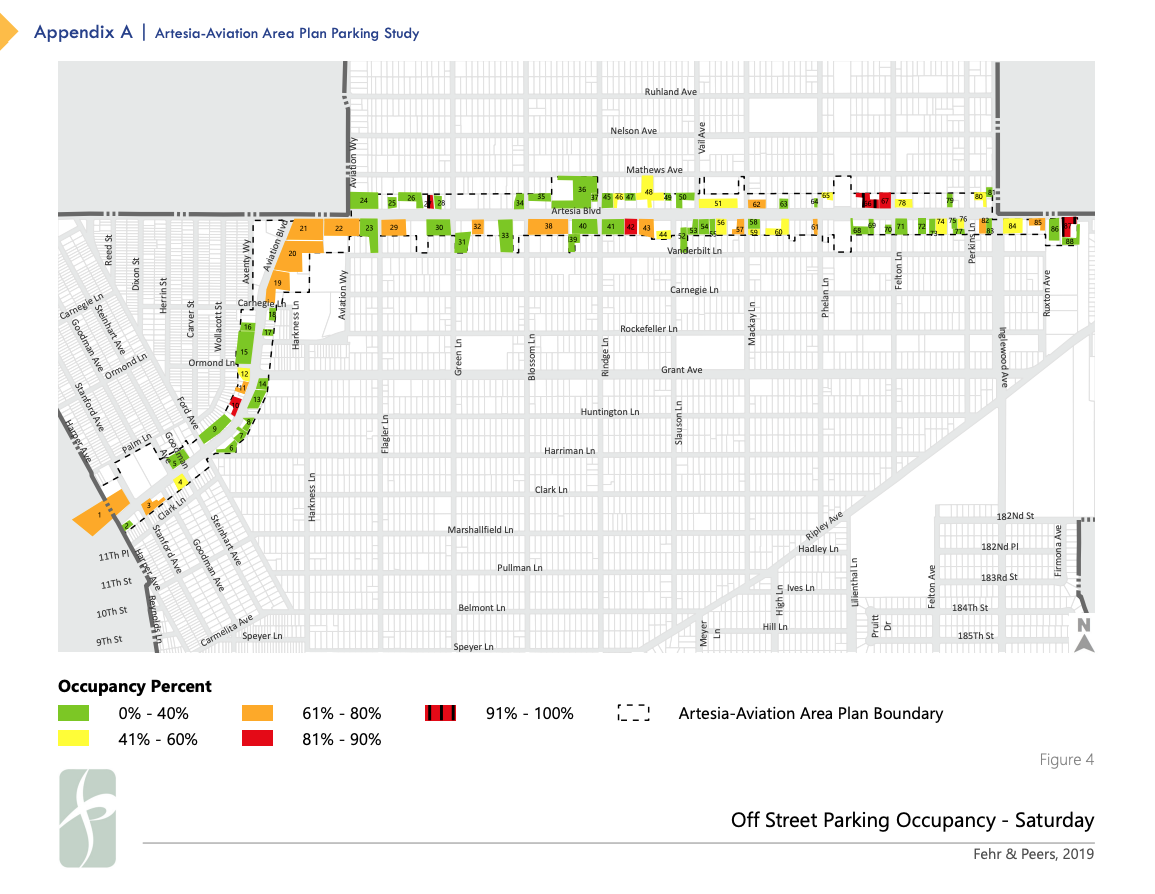
According to the city's own 2019 study (Appendix A), existing uses along Artesia only have half as much off-street parking as is currently required. Yet, only 0-95% of that is used at peak times (except at 2 small parcels, where people park on the street or in adjacent lots). Here's the parking census at peak times. See all that green? That's 0-40% utilizations at peak. The rest of that time, the asphalt is mostly empty. 

Donald Shoup explained in The High Price of Free Parking that 85% parking utilization is optimal for attracting customers in cars. Above that, people don't bother to drive there. Below that, they can confidently go with the expectation that they will find parking nearby. 

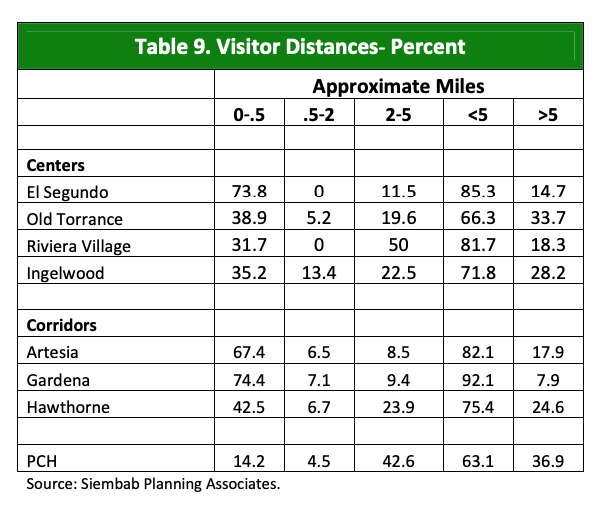
It gets worse. A 2009 South Bay Sustainability Report showed that Artesia gets 67.4% of their visitors from within half a mile (walking distance) of the corridor while Riviera Village (South PCH area) gets only 31.7%. Artesia gets another 6.5% between 0.5 and 2.0 miles (bicycling distance) while South PCH gets none, 0%. 

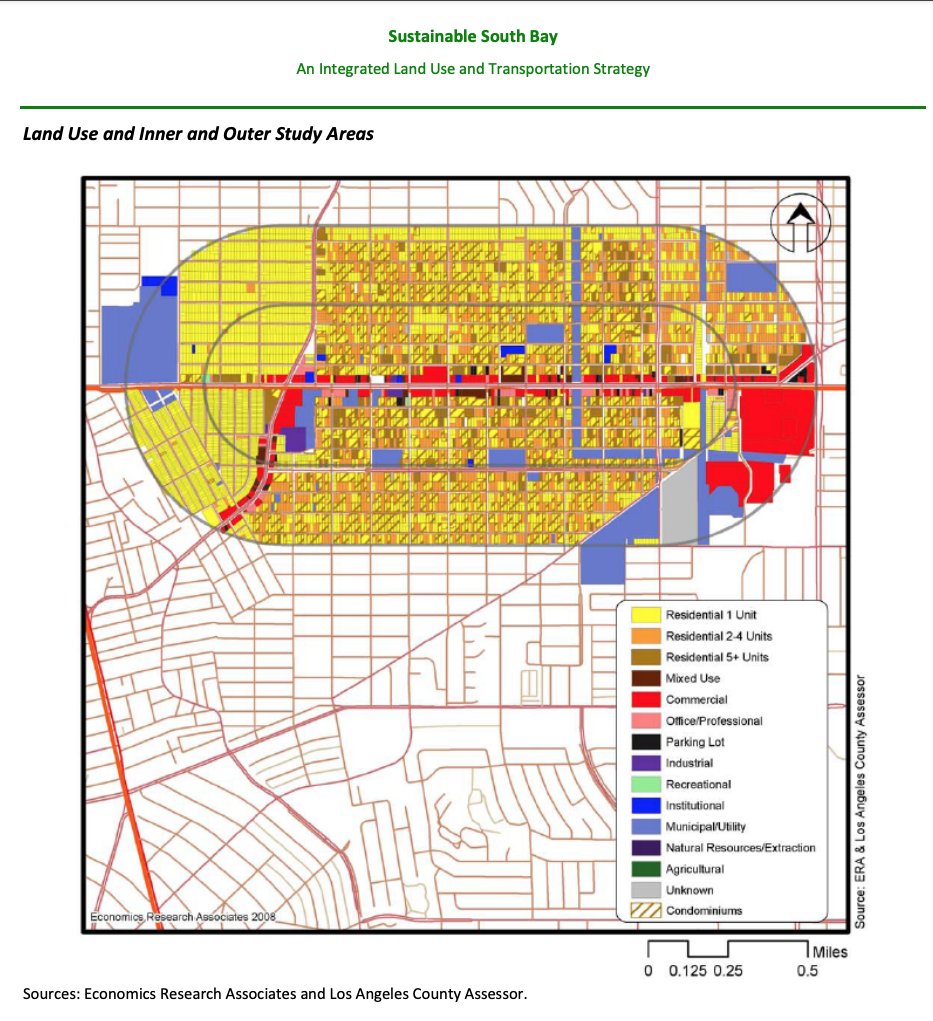
Here's a map of the 1/4 and 1/2 mile study area. 

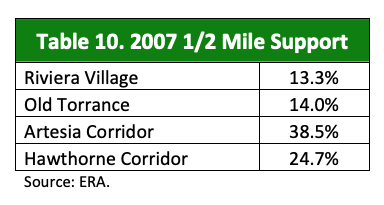
The Artesia Corridor leads the South Bay in percentage of dollar sales that come from people who live within walking distance, 38.5%. Riviera Village in South RB only gets 13.3%. 


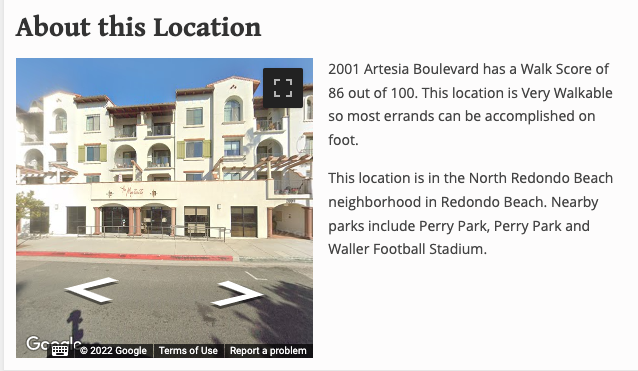
That was 2009. What's changed since then? Well, infill of R1 to R2 or R3 townhomes is nearly complete. The Artesia Corridor residential density is now 17,000 people/square mile, 2-3x denser than the R1 zoned areas of South RB. While SRB has the main library and post office, the smaller NRB branch libraries and post office are highly utilized. So are the grocery stores and pharmacies. In fact the Walk Score of this NRB mixed use development is 86/100, Bike Score 64/100. 


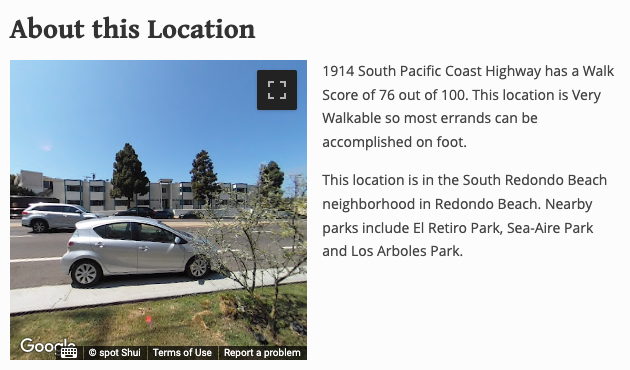
Meanwhile, this "Pedestrian Oriented" stretch of South PCH in SRB has a lower Walk Score of 76/100, Bike Score 49/100. 


Why is the less dense neighborhood with a lower Walk Score zoned for Pedestrian-Oriented use while the denser neighborhood is zoned for parking lots? Why does one neighborhood get sit-down restaurants and the other gets parking lots and drive-through businesses with idling cars? 

It all comes down to who is "deserving" of nice things, like sit-down restaurants; and who deserves to serve as a car sewer for people driving between the freeway and the beach.

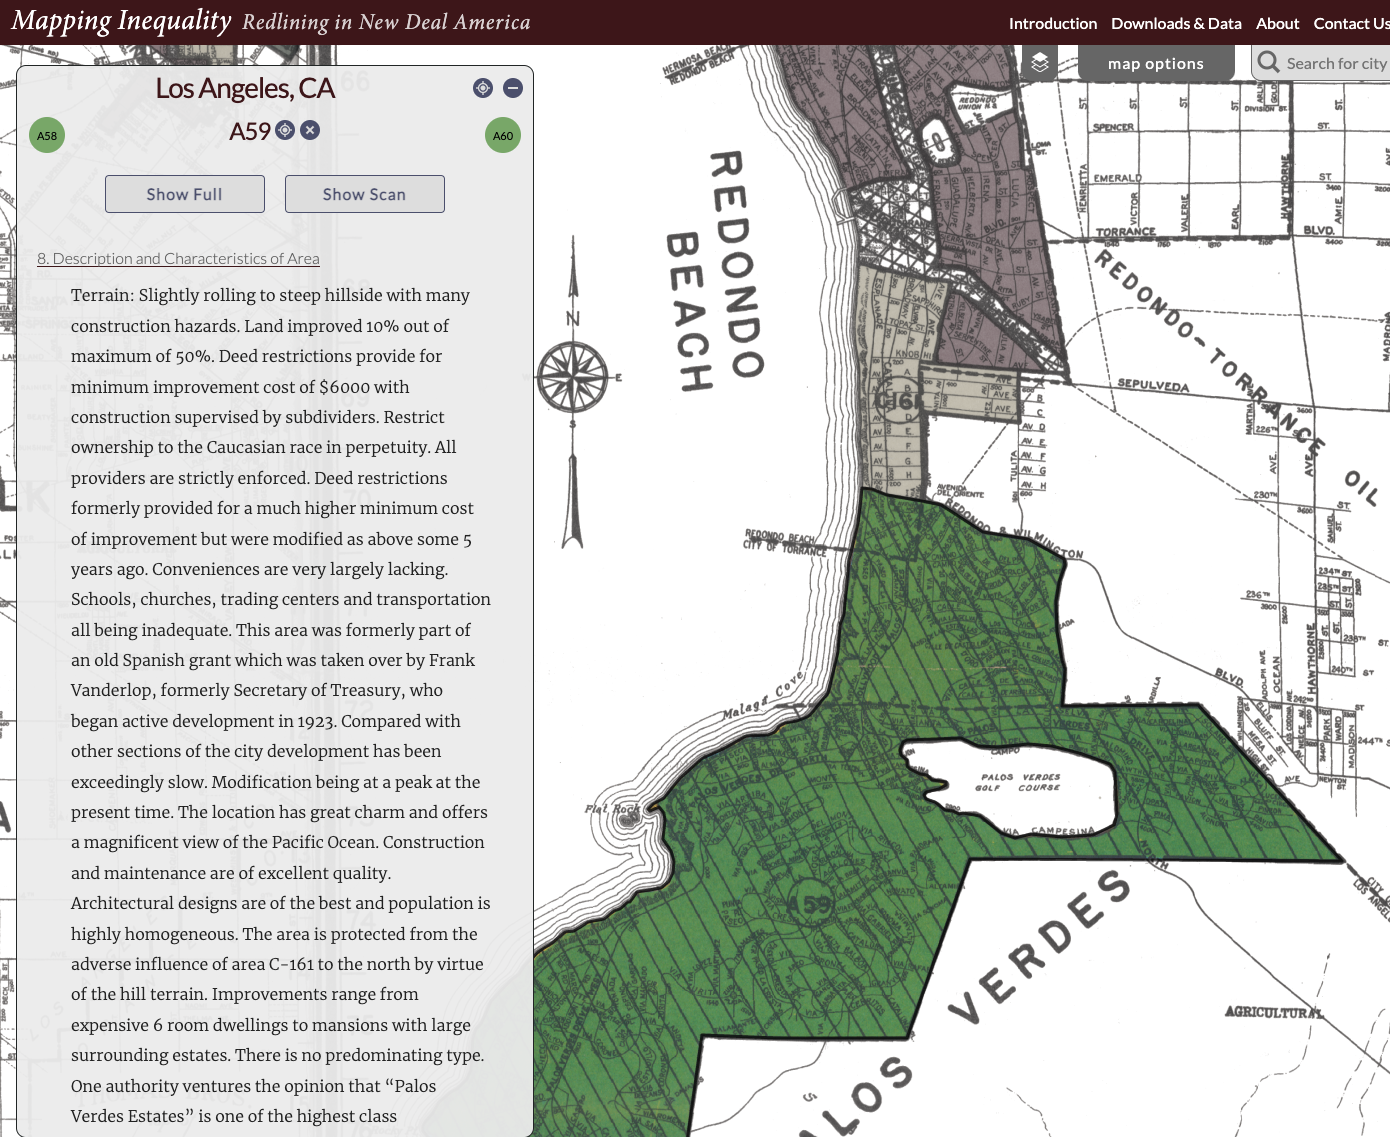
The HOLC "Redlining" map provides a clue. The Riviera area gets a Green rating due to Covenants that "Restrict ownership to the Caucasian race in perpetuity. All providers are strictly enforced."

The Artesia Corridor (formerly Redondo Beach Blvd) gets a Low Red rating due to "Mexicans, Japanese & Italians".  

This is ancient history, right? These covenants have not been legally enforceable for 50 years. 

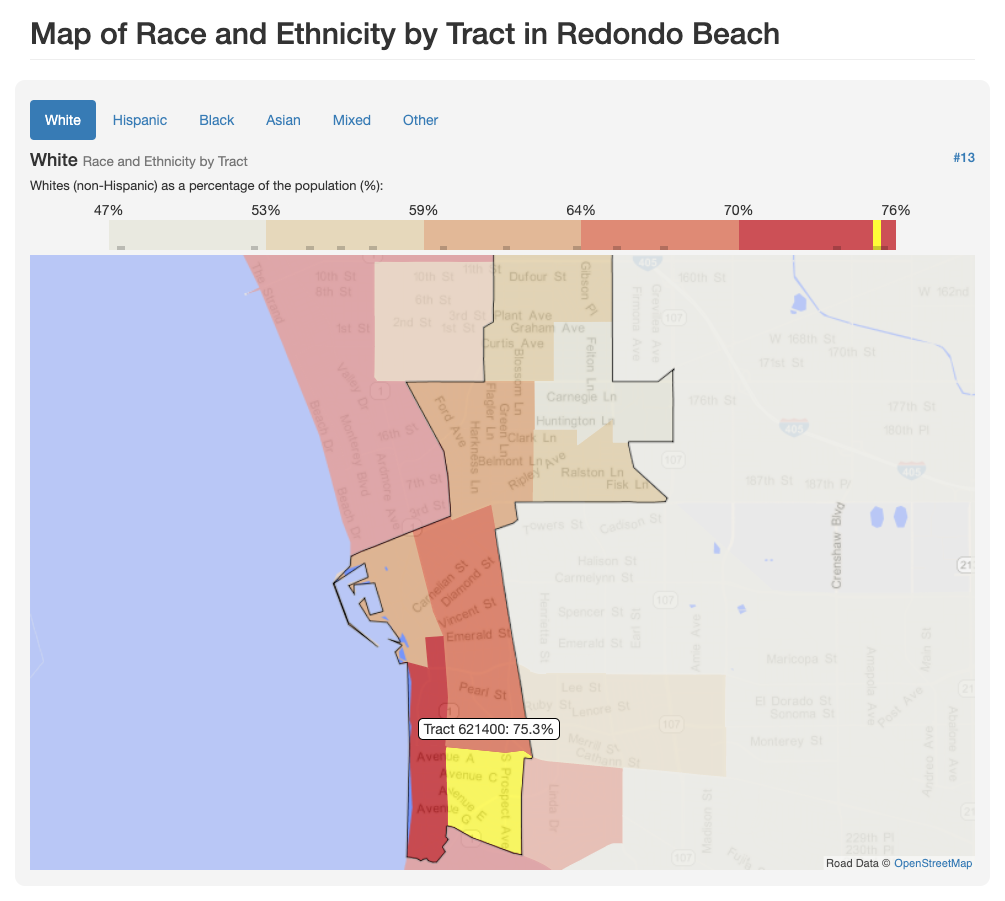
In the 2020 Census, LA County was 26.7% non-Hispanic white/47.9% Hispanic/14.2% Asian/8.3% Black/2.2% Mixed. 

Yet, this SRB census tract is 75.3% white/10.4% Hispanic/9.5% Asian/1.5% Black/3.3% Mixed. It is an outlier many standard deviations away from the mean. 

It didn't happen by accident. 

Zoning has become the proxy for race. "Preserving Neighborhood Character" and Single Family zoning restricts the number of new people who can move in. It also ensures that the new people who move in (if they didn't inherit their home) have to be very high bidders. Because whites have more net worth than any other group, the new people who do manage to buy there are much whiter than the general population. 


In contrast, the census tract containing the 2008 mixed use building on Artesia is 55.9% non-Hispanic white/14.6% Hispanic/16.5% Asian/4.4% Black/8% Mixed. This is more integrated than usual for a coastal Los Angeles County suburb. This census tract started out more diverse. Through infill, it was able to preserve diversity even as it gentrified. 

The ratio between Blacks and Asians reversed in the last 25 years, but nearby Madison Elementary School has both a Title I designation (22% low-income children) and an annual multi-cultural potluck that is lit. The children live in homes where dozens of different languages are spoken. The school population is 34% non-Hispanic white/29% Hispanic/13% Asian/5% Black/15% Mixed. 

[Note: I wrote about this building in New Construction Subsidizes Old; it has been called "a failure" by Mayor Bill Brand, who subsequently (with aid from some council members) downzoned Artesia so that nothing taller the commercial height limit is 1-story now.]

A 20-year old North Redondo Beach Business Association survey showed that the business owners along the one-mile stretch of Artesia, between Inglewood and Aviation, represented 20 different countries with many first-gen immigrants. 

Which brings me back to Engineering Disinvestment. By requiring parking minimums that existing buildings don't meet, and forcing new construction to meet the new impossibly high standards, and then piling on FAR (floor area ratio) and height limits, the city can ensure that nothing "pencils out".  Nothing can be replaced. It will just slowly rot. 

When business owners retire, the lot is their retirement fund. When they try to sell their lot, no one can pay very much. If the new owners modernize it, it would trigger the new zoning and parking rules. This is literally robbing these small business owners of hundreds of thousands of dollars on small lots, perhaps over a million on the larger lots. 

Anyway, I may lament the lack of sit-down restaurants in my neighborhood, but at least I enjoy a 15-minute neighborhood where I can visit the library, post office, grocery, pharmacy, UPS/Kinko's, hardware store, and even a sewing machine store that sells high-end Swiss Mettler thread. 

The shop owners that I depend on, though, are being robbed of their life's savings.

In the words of Frank Wilhoit (the composer):

Conservatism consists of exactly one proposition, to wit: There must be in-groups whom the law protects but does not bind, alongside out-groups whom the law binds but does not protect.

Thursday, February 01, 2024

True Cost to Own 2

I just heard a cringe podcast where they were discussing lack of street parking near our city's high school. One speaker said that, our region is hilly, and eBikes help with that. But not everyone's family can afford an eBike so many kids have no choice but to drive. 

This is a classic case of car brain where people no longer notice the high cost of car culture and car ownership. 

When our teen daughter was added to our car insurance policy, our premiums when up ~$2,000/yr even without adding another car. If your teen can delay becoming a driver by just one year, you can buy a decent eBike, lock, lights, and panniers. You will also save hundreds of hours chauffeuring your teen. 

Another year, another AAA "Your Driving Costs" report has dropped. It's time to update True Cost to Own. The cost of owning and operating a new vehicle in the US has increased to $12,182 in 2023.  New cars cost 4.7% higher than in 2022, but used cars went down in price. 

Remember, this is an average over the entire US, and Los Angeles tends to have higher insurance and fuel costs (both gasoline and electricity). This is also for the average new car sold which, at $34,876, is significantly cheaper than the typical new car I see in our school district (Tesla Y, ~$45,000-$52,500). 

The typical behavior in our area is for the parent to buy a new car and give their old car to the teen. Then they park the old car out on the street, making street parking even scarcer. It's not more people making street parking scarcer. It's more cars. 


I'm doing the calculation a bit differently this year, inspired by a LA Times article about a Culver City High School teacher that had their students run the numbers on car ownership over a lifetime. I don't get into the messiness of predicting inflation rates or marginal tax rates. 

Suppose you don't buy that new car and save that money instead in a balanced mutual fund. Using the Vanguard Benchmark Returns on Target Retirement Funds, you can expect to get ~8.25% long-term returns 


Using an online Savings Calculator, assuming 
Annual Savings: $12,182
Annual Increase in Savings: 3% (car costs have been going up faster than that)
Returns: 8.25% from balanced funds above
Taxes: 0% (if in tax-advantaged retirement account)

Then you have $1,0983,667.47 in year 24. 

Start when you turn 16, and save a million dollars by 40. 

In 50 years, age 66, the car-free saver will have $11,199,484.63. 

But, wait, you can save $18,264 pre-tax (33.3% combined CA+Fed tax rate) while $12,182 car costs are post-tax. But then you pay taxes on withdrawal from retirement accounts. So the amount will vary, but the message is the same. Living car-free or car-light (my family) is a huge money saver. 

Now I want to talk about the really pernicious part about car ownership, the externalized costs borne by others. 

This is painfully obvious to me every time I go to city council to beg for a bike lane and am turned down because "poor people need a free place to park their vehicles" on the public streets. 

I am charged the same price for my groceries whether I use the supermarket's huge and hugely expensive parking lot. I walk or bike to post of my groceries. I even bike to Costco for some of my trips. Yet, I pay for that parking lot. 

Even though road wear is proportional to axle weight to the 4th power, I am paying property taxes to maintain my city streets even though I get around on a 50# eBike instead of a 4,500# electric SUV. 

A 2020 Harvard Kennedy School study found that Driving is more expensive than you think. "Massachusetts' car economy is roughly $64.1 Billion, with more than half of that coming from public funds."

"Using publicly available data, the authors put the annual public tab at $35.7 billion, which amounts to about $14,000 for every household in the state. Those that do own vehicles pony up an additional $12,000 on average in direct costs."

You might nitpick that Massachusetts is snowy and snow plows are expensive. But, a 2021 Ulupono Initiative study in Hawaii found that "Public costs amount to roughly $15,000 per taxpayer ($24,400 per household), annually, even if they don’t own a car."

Furthermore, "Personal vehicles cost an additional $16,200 per household per year. With the public costs above, each household’s costs total $40,600 per year (or 51 percent of pre-tax income)."

Then there is the opportunity costs of the land. "Land value of public lands dedicated to road, highways, and parking is $3.9 billion, covering about 14 percent of the available urban land in our state."


Next time you see me bicycling for groceries, thank me for subsidizing your roads and parking. And drive carefully and slowly around cyclists. Dangerous road conditions are what's holding back the 60% of the public that is "interested but concerned" about riding bicycles. The more of us that are bicycling; the fewer cars in front of you, competing with you for parking, polluting your air, costing your city big bucks in road repair and climate change adaptation...


“Existing law requires the driver of a motor vehicle that is passing or overtaking a bicycle to do so in a safe manner, as specified, and in no case at a distance of less than 3 feet.

This bill would additionally require a vehicle that is passing or overtaking a vehicle to move over to an adjacent lane of traffic, as specified, if one is available, before passing or overtaking the bicycle.”

Drivers are required to pass cyclists with at least 3 feet of clearance (and that is from the furthest point of my bike, including handlebars and cargo).  If there is more than one lane, drivers are required to change lanes before passing cyclists, just as they would do when passing another vehicle. This is why it makes sense for cyclists to ride 2-3 abreast in a pack instead of strung out in a single file line. Drivers can pass them in a shorter distance, making it safer and more convenient for everyone. 

This is now in California Vehicle Code 21760


Thursday, December 17, 2020

Leaf blowers, street sweeping, car tires, fish and you

I heard arguments for easing up on street sweeping parking tickets during a possible second covid-19 shut-down from both the left and the right.  I'm going to explain why that is a very, very bad idea.

Cities don't spend money to sweep the streets as an excuse to issue parking tickets.  They really do need to clean the streets, especially in coastal communities like Los Angeles.  If we don't clean up our streets, storm drains and waterways, toxins get dumped into coastal waters and we get fined by the EPA.  The fines have enough teeth to prod cities to clean up our street runoff.

Car tire dust is a big, big problem.  

Chemicals in tires break down into a very dangerous toxin that is decimating salmon populations.  This solves the mystery of why, when fish habitat and water flow are restored, salmon continue to die.

Zinc in car tires is a leading source of heavy metal toxins in coastal waters (along with copper from brake dust).

Tire particles are the largest source of microplastics in coastal waters.

I read the microplastics paper and blogged about the painstaking methodology and their results in Heavy Metal in LA.


The tire industry acknowledges that car tire particles make up 60% of PM2.5 and 73% of PM10 particulate air pollution.  This has been confirmed by both microscopic manual separation and identification studies like the one above and by elemental analysis of road dust.

Tire Technology International devoted an entire special issue to the problem of tire dust. It's nice to see industry discuss issues ahead of regulation.  This gives us one more reason to keep our tires inflated.  It will reduce tire dust, improve fuel economy and lower our CO2 emissions.

While regulators are still fixated on fighting the last battle, tailpipe emissions, tire emissions are largely unregulated.  But, the EPA does indirectly regulate tire particles through water quality regulations.

I've written about my loathing for leaf blowers and the health hazards that they pose. Leaf blowers churn up pollen, dust and particulate pollutants. Cars create particulates (road surface wear, tailpipe, tire and brake dust) and churn up road dust as well.  Cars also grind down larger, less dangerous particles into finer, more dangerous ones that can lodge deep in the lungs.

We are in the midst of a raging pandemic. Studies around the world have shown that covid-19 is deadlier as PM2.5 particulate pollution rises. An increase of just 1 microgram per cubic meter of PM2.5 exposure leads to a roughly 10% rise in covid-19 mortality. The Harvard study of the US covid-19 mortality and PM2.5 also studies race and concludes that PM2.5 alone (holding race constant) increases risk by 8% for each microgram/cubic meter.

I bought a home air quality sensor and moved it around the house.  When I put it near a window facing the street, I could see the PM2.5 spike whenever a car drove past.  The road dust got really bad while our city was not able to sweep the streets all the way to the curb due to parked cars.  

When parking enforcement for street sweeping resumed, I saw a decrease in road dust when I opened my windows.  It hasn't rained, so the reduction in road dust is most likely due to more thorough street sweeping.

In the middle of a pandemic, when we are urged to open our windows and ventilate our homes, isn't it important to keep the street air as clean as possible?

Isn't it our self-interest to move our cars and let the street sweeping machines do the most thorough job possible?

Also, why are we storing private property (cars) on the public right of way (street)? What is the point of mandating so much off-street parking in zoning regulations if we're all going to dump our cars on the streets?  

Parking on the street is privatizing public property. Then that leads people to get mad about getting parking tickets when they don't move their cars for the 2 hours a week that the street is swept.  Moving a car off the street is the minimum that people need to do to keep our cities and water clean.

The real outrage is that people privatizing public space is keeping our kids from being biking safely down the street.  The kids are penned between twin rows of parked vehicles with no space for cars to pass them safely--even if they could be seen through the visual clutter of all the parked cars.

Addendum:

The number one thing we can do to reduce tire particulate pollution (in terms of biggest reduction) is to drive lighter cars.  Drive the smallest, lightest car you need for everyday activities. Rent a larger car for occasions where you really need a larger vehicle.

Number two is to drive them less.

Number three is to keep your tires properly inflated.

With climate change, our rain season is going to get shorter.  This means we will have to rely more on street sweeping instead of rain to clean up our tire particle pollution.  The best way is to create less in the first place.

Thursday, January 30, 2020

Data-Driven Climate Action

I gave an overview talk last Saturday at the League of Women Voters of Los Angeles County Winter League Day. I was the lead batter for a panel discussing the most impactful climate actions we can do in Los Angeles County right now. Enjoy.


I want to convey the seriousness and urgency of this moment, but not induce panic or hopelessness. Whether we constrain Climate Change (CC) at the optimistic 1.5 C or the business as usual 3.5 C, we can still make positive changes that will benefit our region.

CC is happening. We are the cause. This is not up for debate any longer. We cannot undo the damage that has already occurred, but it is not too late to act.

I’m going to take a speed tour of the impacts of CC on our region.
Then we’ll examine our Greenhouse Gas (GHG) emissions and where we can make the greatest reductions.


Terminology: Science speak to English translation
Climate: what you expect
Weather: what you get (short-term fluctuations)
Normal: average over 30 years of statistics, recomputed on the 10s, eg 1981-2010
We’ve already warmed 0.8 C over what would have happened if we hadn’t spewed so much CO2 & the rate is accelerating and the warming is not uniform over the earth.


This is not a model prediction. This is the actual warming we’ve experienced over the last 30 years. U of AK climatologist Brian Brettscheider had the insight that, at the end of this year, we will compute the normals again by subtracting the average over the eighties (the decade of 1981-1990) and adding the 2010s (2011-2020). He took an early look using the first 9 yrs of the 2010s. 2011-2019 - (1981-1990)
The earth has warmed 0.8 C since 1850, but roughly 0.5 C took place in the last 30 yrs. (Climatologists use a longer time average so the results may vary slightly. Nevertheless, 0.5 C warming over 30 years is very dramatic and scary.)


Here’s a closeup. Although we’ve only warmed up about 1 C, the areas from which we draw our water have warmed up to 4 C.


I cribbed this from LAC’s sustainability plan that Kristen Torres Pawling will talk about later. Our County imports river water from the Sacramento-San Joaquin Delta & the CO river basin through Metropolitan Water District. LA City also imports water from the Owens Valley in the southern Sierras through DWP. This is not sustainable or just, even without climate change.


Now I will show a climate projection of likely precipitation changes. Keep in mind that, for every 1 C of warming, the atmosphere can hold 7% more water. Air, plants and soil become thirstier. We’ll also have less frequent rain, especially in the springtime, which leads to longer fire seasons.

What rain we do get, will come in more intense storms, which will make managing runoff more difficult. Less water will wind up in the rivers. Wildlife will need more water to stay cool on a warmer earth. The CO river basin has already dried up 20% since the 1980s and will continue to dry up. Some estimate the flow will reduce to half by the end of this century. Furthermore, federal courts have affirmed that roughly 20% of the CO river water were awarded by treaty to sovereign tribes.


I’ve shown you water scarcity, now I’m going to show water overabundance. Luckily, our region is not prone to hurricanes. But we need to prepare for stronger atmospheric rivers that persist over small areas for longer times. That’s due to irreversible changes in the jet stream due to polar ice cap melting. Notice this brown dot near the Oroville dam breach and Reno’s catastrophic flooding.


Then there is sea level rise. Our sea ports move 40% of our nation’s container ship volume, and much of it will be underwater in the medium CC scenario. Even areas that are above the rising seas will still be affected by sunny day flooding and salt water intrusion into aquifers, thus threatening our local water supplies.

Water insecurity--too much or too little--and the nexus between energy and water, is a huge concern and I hope to hold a future meeting around that.


Longer dry seasons will stretch the fire season. Changes to the jet stream will make Santa Anas more frequent and longer in duration. This leads to increased fire danger and air pollution build up.

To an atmospheric scientist, the pretty sunset in the title slide shows several days’ worth of pollution, stacked up like bathtub rings against the atmospheric lid of a wintertime inversion layer.

Now that I’ve scared you, let’s transition to problem solving.


We’ll start by examining our county’s GHG emissions. We need to bring down our emissions budget down by about half overall. We’re an urban area so there isn’t much direct agricultural emissions. Transportation, ⅔ of which is private automobiles, is the 800# gorilla. If you add up the oil refineries in the energy industries slice, transportation accounts for over half of our GHG emissions. There is simply no way to to achieve a stable and livable climate without drastically reducing our transportation emissions.

California overall is similar with 41% of 2017 GHG emissions from transportation.  It's frustrating that so much attention is paid to electricity generation, which only releases 15% of our GHG total budget, and yet we ignore the elephant in the room.


Responsibility for climate change is highly unequal. I’m showing Rancho Sante Fe (in San Diego County) because I didn’t want to single out any LA County cities. This is a map by household size, not per capita emissions. These green areas in the urban core often have the highest HH size as families struggle to make rent in overcrowded apartments, so the per capita inequality is even more stark. We can choose to eat less meat and better insulate our homes on our own, but the really meaningful change in transportation requires collective action.


There’s simply a geometry problem in our streets. We give the most space to the most inefficient form of transportation. We let buses holding 80 people sit in traffic behind cars holding an average of 1 person each. We even let people store personal property, in the form of cars, on the streets. Often for free! Then we tell bicyclists to get off the road because there is no room for them.


Parking is another geometry problem. It’s also a chicken and egg problem. The more hellish we make it for people outside of cars, the more we push people into cars. Then we need more space to put those cars. Parking minimums for apartments have doubled from 1 to 2 spaces since 1960, raising housing costs. (Data from Mikhail Chester, Andrew Fraser, Juan Matute, Carolyn Flower, and Ram Pendyala
Parking Infrastructure: A Constraint on or Opportunity for Urban Redevelopment? A Study of Los Angeles County Parking Supply and Growth
Journal of the American Planning Association, 2015, 81(4), pp. 268-286, doi: 10.1080/01944363.2015.1092879)


Look at this lovely mid-Wilshire area apartment building that is not legal to build today.


Parking pushes us apart, making travel distances longer. Buses are slow because they are impeded by cars. Give buses dedicated bus lanes and they can beat private cars. It’s cheap, too. If you speed a city bus up from 9 to 18 mph, you double bus frequency with no additional drivers and buses. All it takes is some paint and enforcement.

Some people say that our region is too spread out for bikes. Traffic congestion and parking time make bikes faster for short trips. Longer trips can be combined with transit. Increasing density along transit corridors so people can live full lives with fewer cars is working around the world and it can work here, too.


Take it from decarbonization expert and CMU professor, Costa Samaras. eBikes are the future. While his research shows that an electric car has ½ the CO2 emissions of an Internal Combustion Engine (ICE) one, an eBike beats both.


I can eBike 50-100 miles with the energy it takes to move a Tesla just 1 mile. Factor in parking time, and eBikes beat cars, even on a normal afternoon on the 405. BTW, cars are a leading source of urban heat. Add the concrete needed to support cars and they are the leading cause of urban heat. The background is the August 2019 SoCal air quality maps from airnow.gov, an EPA website.


In summary, decarbonizing transportation has the highest potential for stopping CC, but it requires collective action. We can’t choose to bike along a street that doesn’t create a safe space for us or take a bus to an evening concert if the buses don’t operate at night. An urban area is precisely where these two modes can excel, if we let them. We don’t need a solution that works in Iowa or New Hampshire or even Fresno. We have the existing density and the weather to do this right here, right now. Let’s paint those streets Green & Red.

Transportation Actions Now

  • Make driving alone the last, not first resort.
  • Reallocate road space from cars (especially on-street parking along arterials)
  • Bike lanes network
  • Bus lanes network
  • Smaller, more efficient cars (both in space and GHG)
  • Vision Zero like you mean it

Housing Actions Now

Help climate refugees...
  • …move closer to work so they can get out of cars
  • …move out of fire corridors & landslide zones
  • …move out of low-lying coastal zones & flood plains
  • …move to cooler microclimates near the coast
and
  • Reduce parking minimums
  • Support laws that speed up housing production (SB 50)

Water Actions Now

  • Educate your communities about the risk
  • Prepare for loss of imported river water
  • Build stormwater capture projects
  • Continue conservation (but diminishing returns)
  • Expand water recycling; legalize potable reuse
  • Consider desalination

Climate Takeaways

  • Move fast, with existing technology
  • Continue research, but don’t fixate on shiny vaporware
  • Don’t replace one injustice with another
Taking climate action now can result in
  • Cleaner air and water
  • Better mobility and public health
  • A more just and cohesive society

Wednesday, May 10, 2023

Guidance for the Metro Active Transportation Corridor: Redondo Beach Blvd Survey from a Local

Urgent Action Alert 

Deadline Extended to May 30, 2023 May 15, 2023 so read on and fill out the survey now 

I need you to fill out a public input survey about a vital active transportation project for Redondo Beach and surrounding cities in the South Bay region of Los Angeles County. This is our chance to reverse some of the damage wrought by past auto-centric road design in North Redondo Beach and allow those who can ride a bike to make school and shopping trips with confidence that they can make it home alive and in one piece. 

There's also a Story Map about the Redondo Beach Blvd Active Transportation Corridor Project with more information. 

Short version if you are in a hurry:

The current street allocation with car parking on both sides and massive SUVs speeding down our streets is not safe or welcoming for cyclists. The proof is in the declining bicycle mode share. 

When filling out the survey, select the options that give a protected bike lane every time. Scroll down past the background info to see my recommendations and why. 

Paint is not protection. Never select an option with a paint-only bike lane in the door zone. If someone opens a door, a cyclist in the door zone will be knocked off their bike and suffer grievous injuries. If they swerve to avoid the door, or are knocked into the traffic lane, they could be killed. No one wants to be killed or have their child killed while riding to school. 

Two-way cycle tracks are a good option, particularly near schools. When kids are arriving or leaving school, there will be a lot of traffic congestion on all modes. But cars are particularly dangerous. The less car traffic they cross while leaving the congested area, the safer they will be. Keep them on the school side of the street, with wide lanes so that there is passing room in the bikeway (keep the kids out of the car traffic lane). 

Plastic poles are not physical protection, but likely the best we can get as a first step.  Plastic poles can be replaced with bollards or concrete barriers later if we allow enough buffer space to install the plastic poles in the first place. Do not let the perfect get in the way of actions we can do right now. 

You can skip the background (but I hope you read it when you have more time).  

Background: The Connection with Schools

The project area below was originally going to be along the old freight route from Redondo King Harbor to the inland rail routes, but Ripley was found to be too steep (several areas with 15% grades) to be feasible for safe cycling. 


A Redondo Beach traffic study determined that 30% of the city's AM/PM peak traffic is the child school run. This travel corridor includes

  • Adams Middle School: 1066 students: 6-8 grades
  • Washington Elementary School: 801 students, K-5
  • Jefferson Elementary School: 509 students, K-5
That's almost 2400 K-12 students arriving and departing each day on this corridor. 

But that's not all, because all students in Redondo Beach Unified School District (RBUSD) attend Redondo Union High School (RUHS) in South Redondo Beach*. Jefferson ES students also attend Parras Middle School south of RUHS. 

Assuming 350/grade at Adams MS and 90/grade at Jefferson ES, 

350*4 + 90*7 = 2030 students cross 190th Street to attend school and return home each day. 

About half of all RBUSD students traverse this corridor every school day.

But that's not all; El Camino College (ECC, 22,000 students, many from the Beach Cities) is on the eastern end of this travel corridor. Some RUHS and MCHS students do concurrent enrollment and take classes at ECC while they are in HS. Due to many factors, including cost and lack of housing at UC campuses, a large number of students are enrolling in grades 13/14 at ECC before transferring to a 4-year college/university. 

When filling out the survey, think about what you would send your kid to school on. Think about what you would be comfortable riding on as you accompany your younger child to school or run your errands. I ride this area 1-2x/week to run errands in North RB or West Torrance. I want better infrastructure for my safety, too. 

Watch this video of the horrifying existing conditions as ridden by two fit MAMILs (Middle-Aged Men in Lycra). Would you ride these steep hills? Next to fast-moving busy traffic?


Here's another video of the area where Kyle, an area father, rides his kids to preschool. 


My opinionated guide for the survey choices and why they matter: 

Every cross-section shown is facing either Eastbound or Northbound.

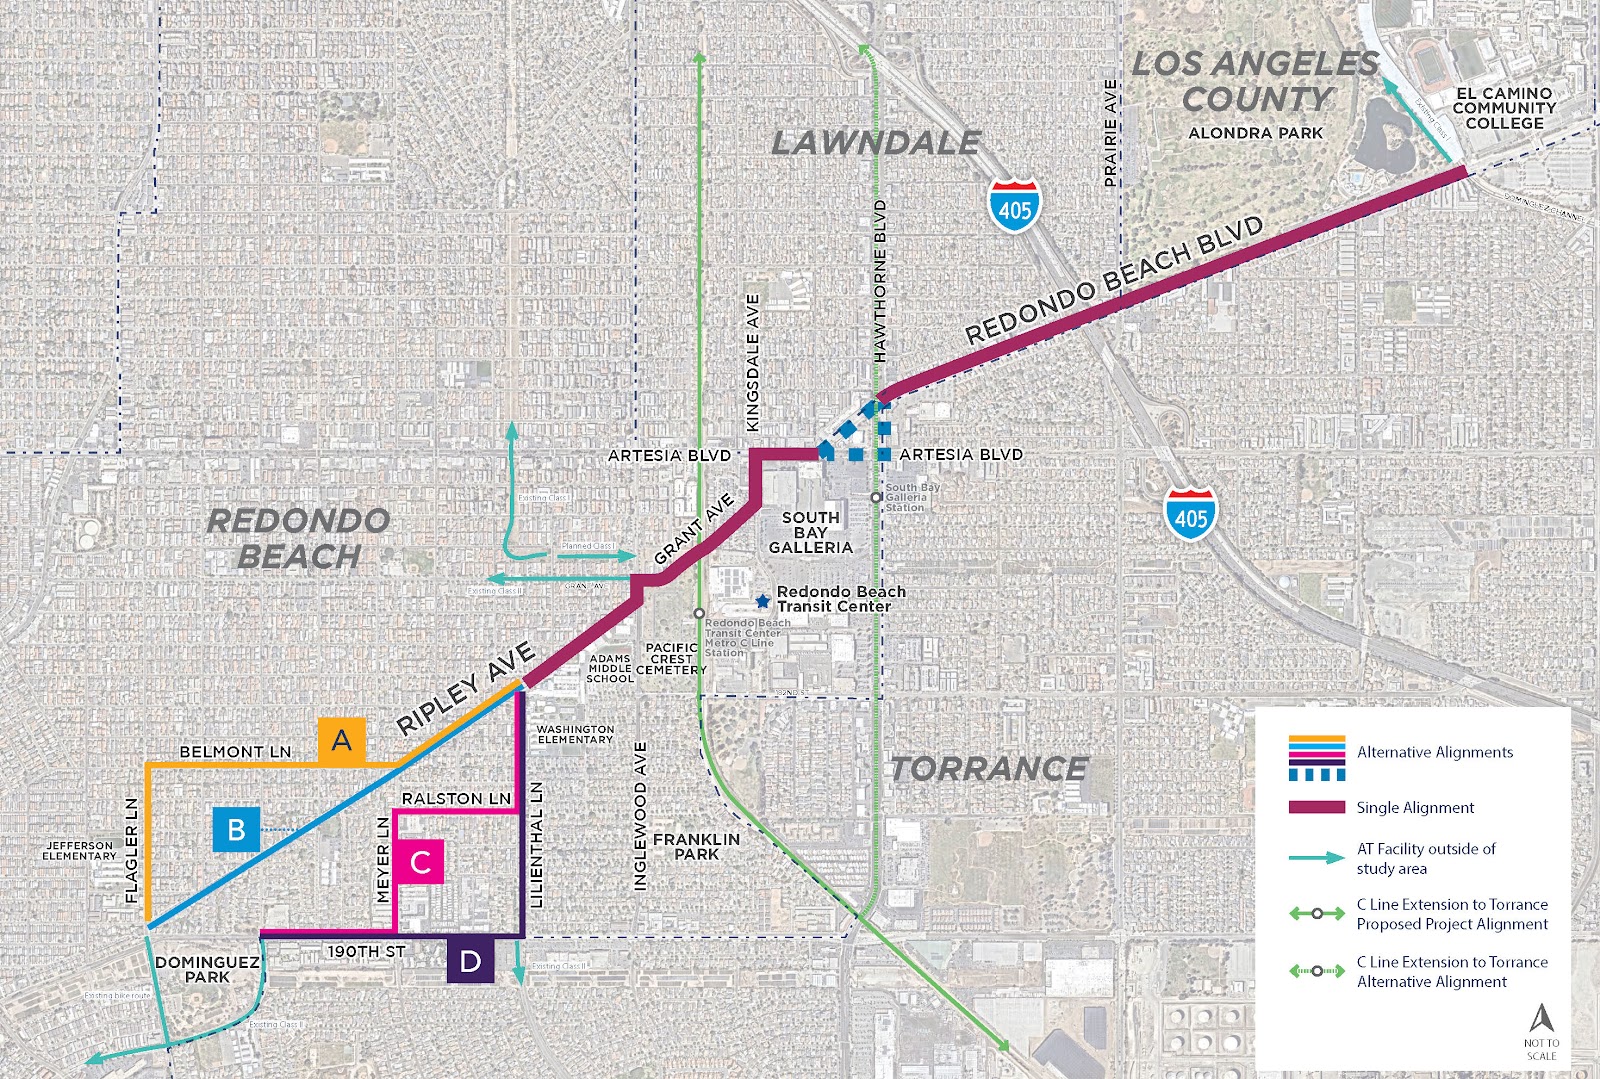
Q1: For the westernmost portion of the corridor, which alignment(s) do you prefer? 


I picked D because that would give us a 2-way cycle track on Lilienthal and the longest length of protected bike lanes on 190th. 190th St is also the only way to avoid steep hills. 

The problem with B: The first video shows just how steep Ripley is. Notice that the lead cyclist on a light road bike has trouble getting up the hill (and the trailing cyclist with the camera is on an eBike). Going up a 15-16% grade is difficult, but going down them is downright dangerous. Do not send kids on this route. 

A and C are better, but still steep in some sections. Also, if those are the official routes, there will not be likely any road changes except Sharrows, which are shown to be more dangerous than not doing anything

Only Option D along 190th St will yield any road space allocation for cyclists. 

What is a Sharrow? 

Why are Sharrows so dangerous? 

Q2: The proposed street section for 190th St (Alignments C and D) is shown here. How satisfied are you with this proposal?


I picked Very Dissatisfied: These cross-sections are looking towards the east, with Torrance on the Right Hand Side (RHS) and Redondo Beach on the LHS. Cars are coming down the hill from Flagler and often speeding 50 eastbound mph. People drive with the sun in their eyes during the morning and evening commutes. Do you feel safe with just paint and plastic poles designed to bend when run over by vehicles?

I recognize that people living in the apartments in Torrance on the right need overflow parking, but let's swap the bike lane and parking lane. Install a parking-protected bike lane like this one in Long Beach on the Torrance side with breaks to preserve sight lines at each driveway or street crossing. 


On the RB side, I'd like to see real bollards or a curb. Imagine something like these without the parking lane. Images courtesy of National Association of City Transportation Officials (NACTO)


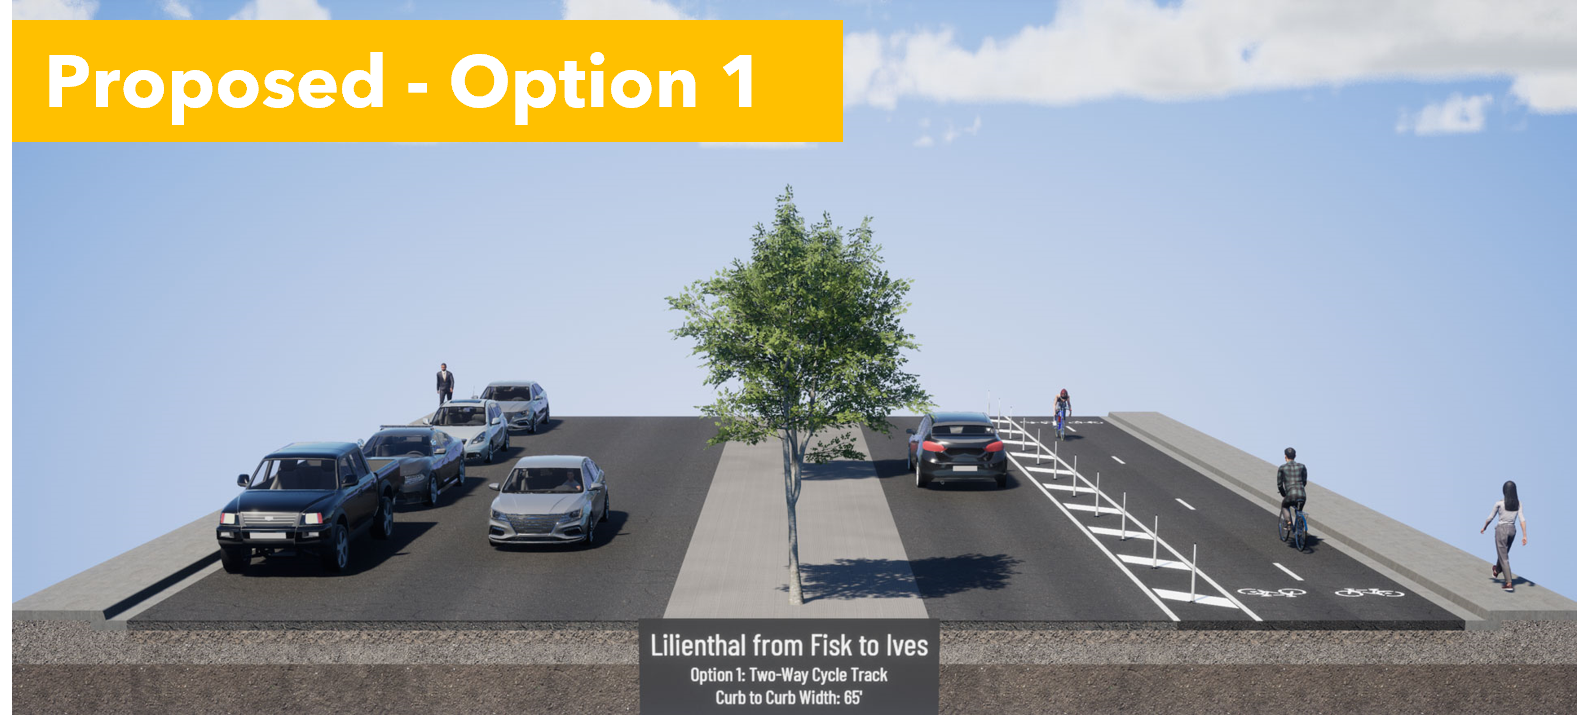
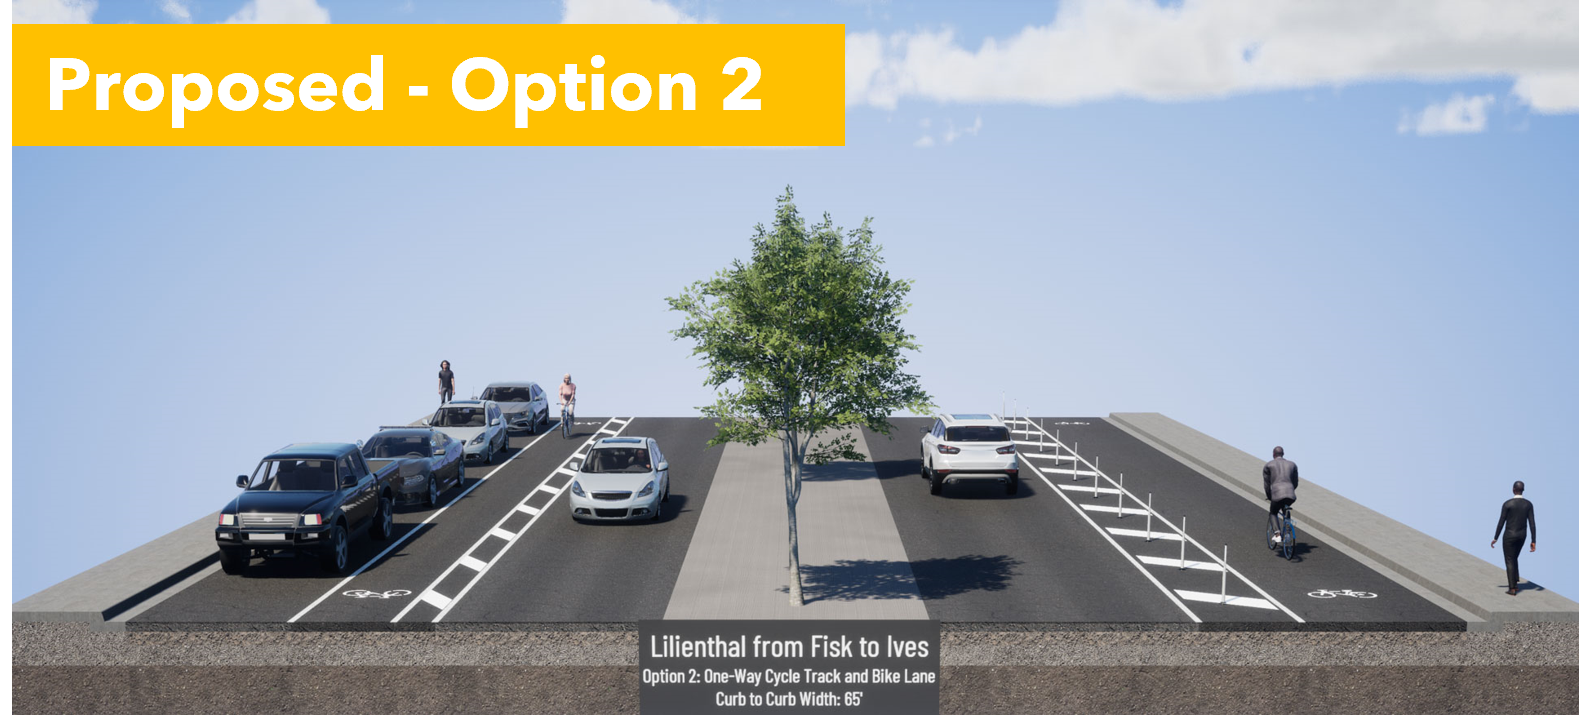
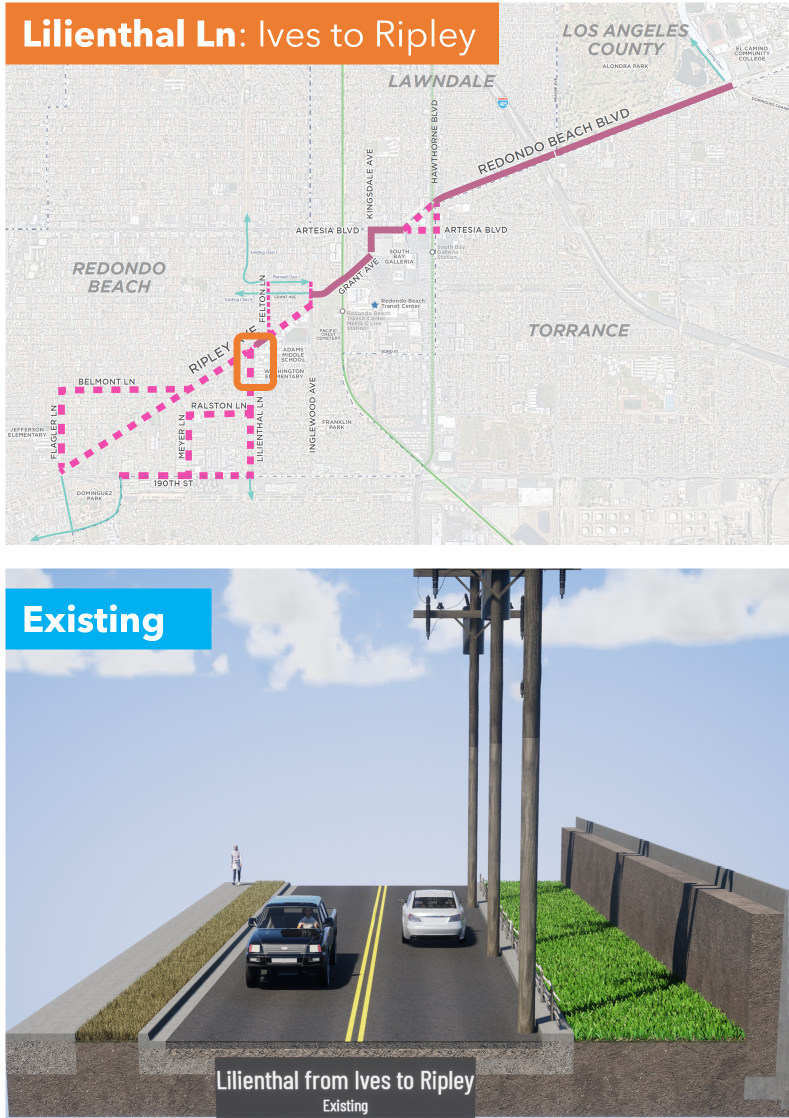
Q3: Select Option 1, the 2-way cycle track on the east side, next to Washington ES. 


Option 1 provides separation from cars, and is wide enough for passing, and allows parents to ride side by side with a child gaining confidence in their bike skills. In 2-way cycle tracks, people riding opposing car traffic are facing approaching cars, so they can see and react to dangerous drivers. It would be better to have solid protection here, but Option 1 gives us room to retrofit with more solid barriers later. 


Option 2 puts kids in the door zone on one side and makes them cross the street to get to school. It's a dangerous situation. 


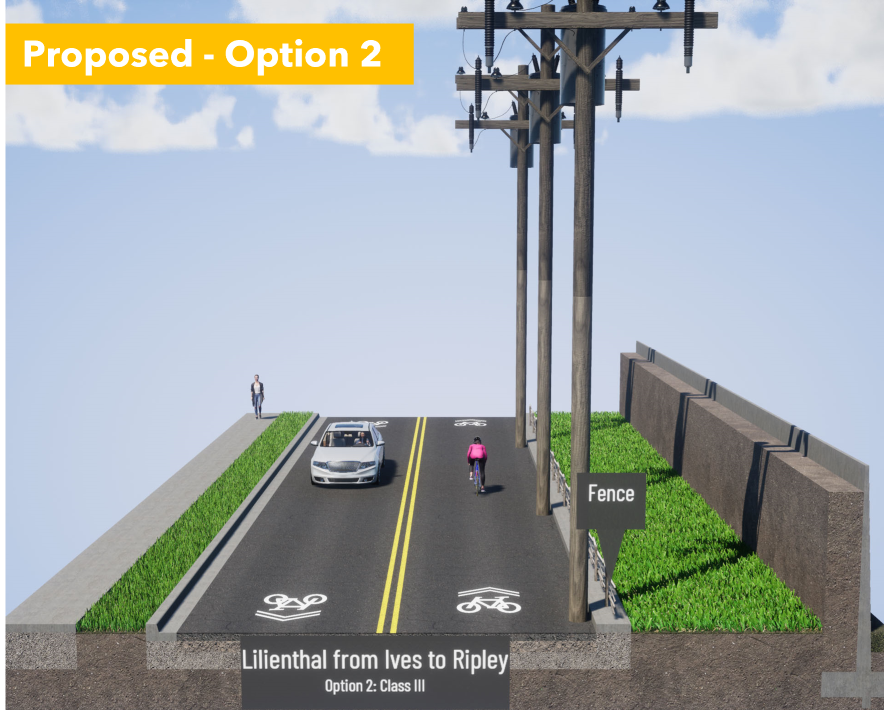
Q4: Select Option 1, the 2-way cycle track on the east side, next to Washington ES.  


Don't be distracted by the stock visualization image with a tall solid wall. There is currently short solid wall on the parking lot side and a wood and rope fence on the road side. 


Option 1 gives a clear place for kids to ride that is physically separated from cars. The 2-way cycle track would replace the wide grassy area.


Option 2 is sharrows in a place where drivers are more focused on making a turn at Ripley than cyclists approaching from behind them. 

Motorists trying to make a right turn will pull over to the right, trapping cyclists behind them. Small children on bikes and tall, boxy hoods on todays trucks and SUVs mean that parents may not be aware of cyclists in front of them. This has led to an epidemic of frontover crashes where drivers run over people in front of them because they can't see them over their hoods. Or, they look at their screens and forget that there are children in front of them. 

Option 2, sharrows, is a safety disaster. 


Q5 on Ripley: Pick Option 1, the 2-way cycle track on the Adams MS side


Option 1 keeps the kids on the school side as long as possible. It also preserves the car unloading curb space that people are currently using. 


Option 2 puts kids in the door zone, at precisely the time that kids being driven to school are unloading. This is a safety disaster. 


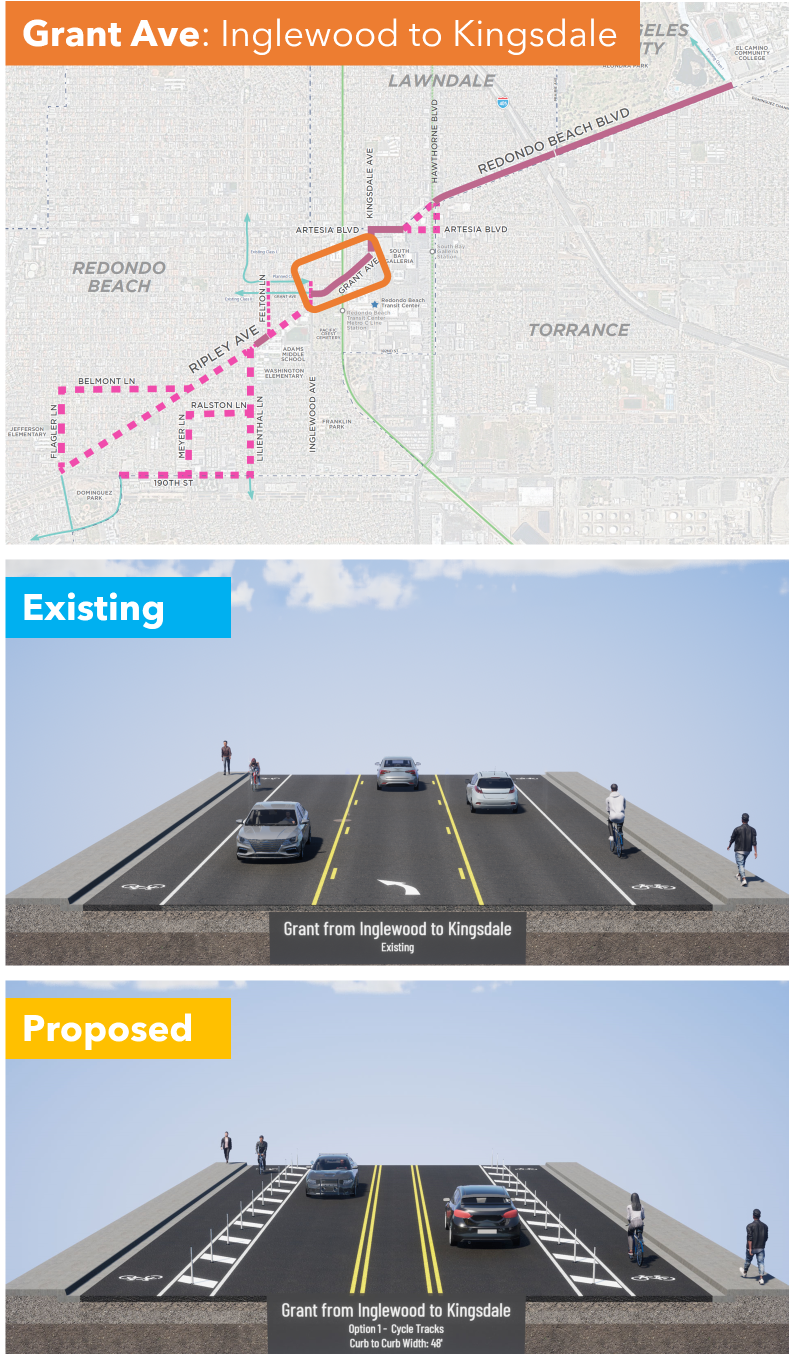
Q6: Grant Ave from Inglewood to Kingsdale; I am very dissatisfied but I selected other and explained why we need solid protection instead of plastic bendy poles


They are proposing paint, a buffered (space separation) and plastic bendy poles. 

This is better than existing conditions, but not safe. Cars pick up speed heading downhill and frequently misjudge the curve, so they end up sideswiping cyclists in the bike lane. We really need a concrete barrier on the downhill (right hand) side. 

I ride by bike to shop at the Galleria and this is the scariest part. I saw a guy almost get killed here. If we want more people to bike through this area, which connects to shopping, the South Bay Transit Center, and the 300 new homes under construction, then we deserve solid protection in this dangerous area. 

I gotta break for lunch but I'm going to hit Publish on this so you can get started. I'll finish after lunch. 

...

I'm back. Stay with me because we are on the home stretch, but the most dangerous one that crosses the 405 Freeway and has the most high-speed traffic. 

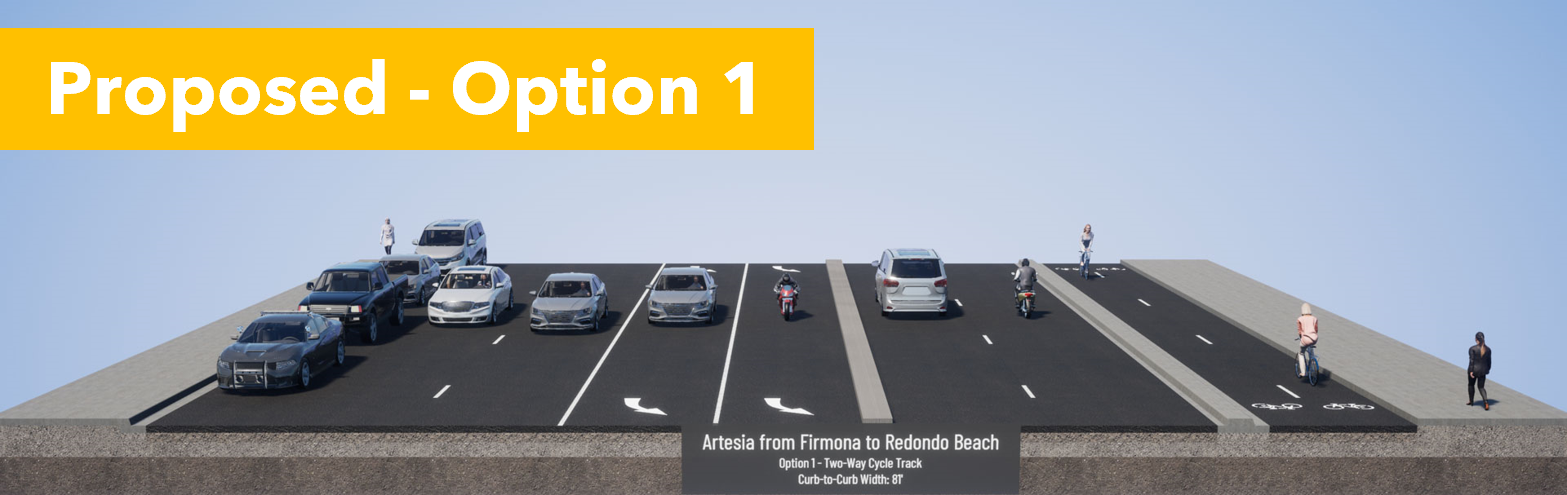
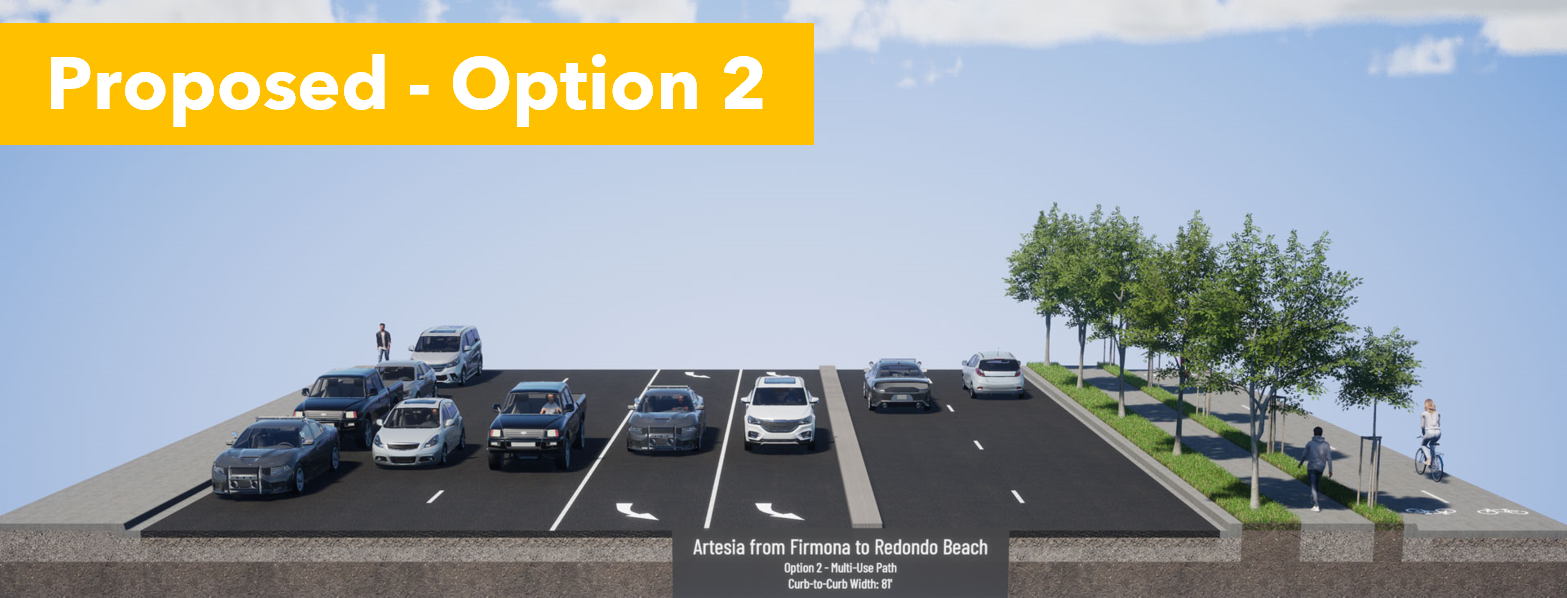
Q7: Artesia Blvd from Kingsdale Ave to Redondo Beach Blvd pick Option 2.  

Existing conditions are awful and you see very few cyclists brave enough to ride here. If they do, they are often on the sidewalk, conflicting with pedestrians. 

Option 1 puts cyclists next to vehicle lanes, but protected with a concrete curb. Pedestrians and cyclists would intuitively understand where they are supposed to be, as faster bike traffic is at the street level. However, this would interfere with bus stops. 


Option 2 puts pedestrians next to the vehicle lanes, but also next to the bus stop. Trees would provide shade. There could be some confusion with pedestrians wandering on the bike path, but that can be solved with good signage.


Our community has experience with pedestrian and bikeways next to each other in the North Redondo Beach Bikeway (NRBB). While there is some spillover, people have already learned where pedestrians and rollers have priority on the NRBB. Option 2 will work best for us and we already know how to use it. 

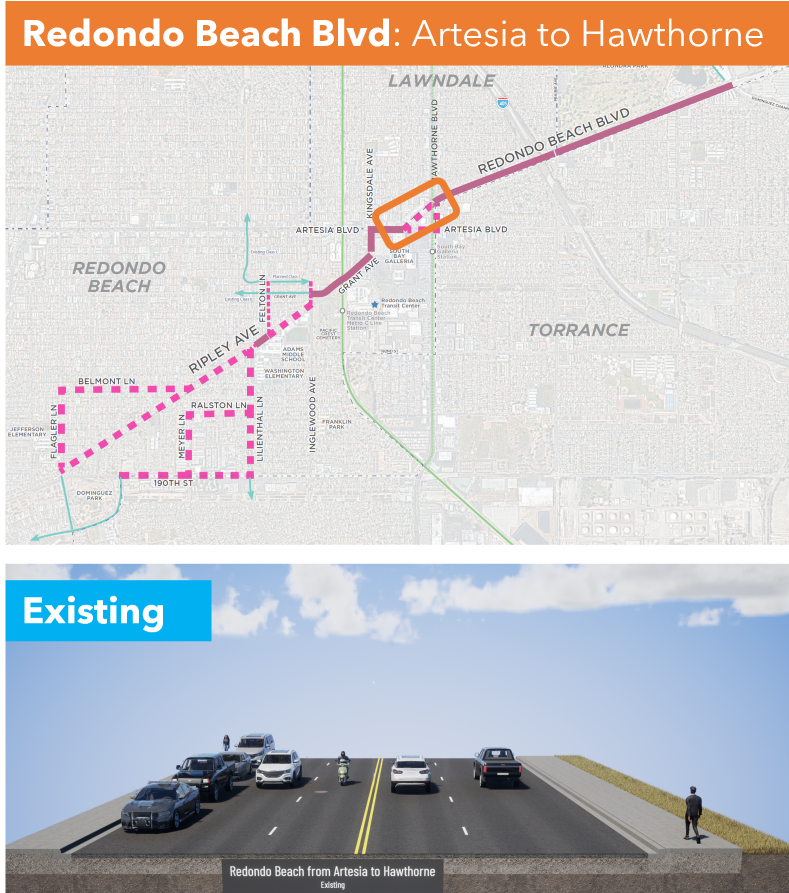
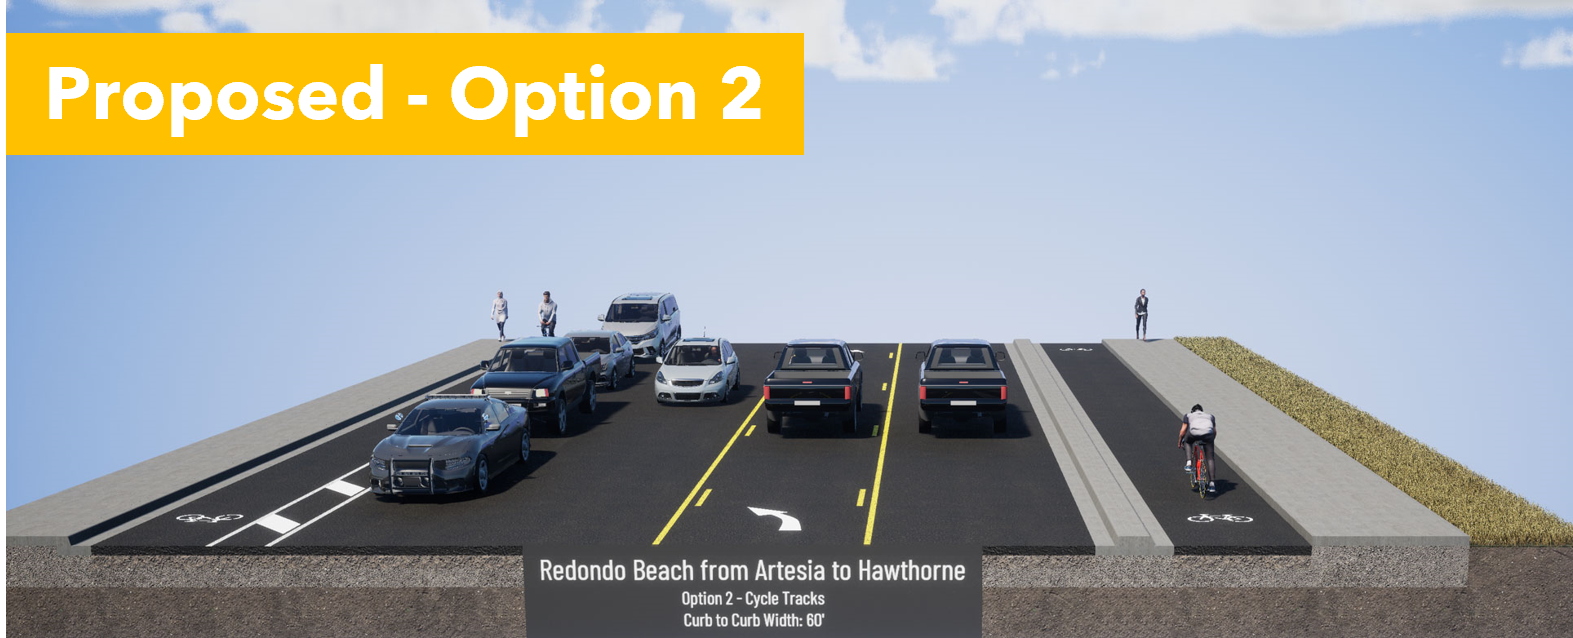
Q8: Redondo Beach Blvd from Artesia Blvd to Hawthorne Blvd. Is a tossup but both Options are so much better than the status quo.


Option 1 pits cyclists against pedestrians, but provides 2-way access to Walgreens and Starbucks. It's not terrible as long as cyclists slow down when passing pedestrians and motorists exiting the parking lots look both ways. 


Option 2 provides a clear separation between motorists, cyclists and pedestrians. Cyclists are curb-protected on the eastbound RB side, and parking-protected on the westbound Lawndale side. However, coming westbound from Walgreens/Starbucks, people will likely bike on the sidewalk until they meet the 2-way cycle track. 


Although you lose a traffic lane, it's not the cyclists' fault. One can just as easily blame the space allocated to free car storage (on-street parking) and a turn lane. Motorists are losing a travel lane to other motorists, not cyclists. Don't forget that. 

Option 1, the 2-way cycle track, provides a better alternative not suggested by Metro for the next section. 

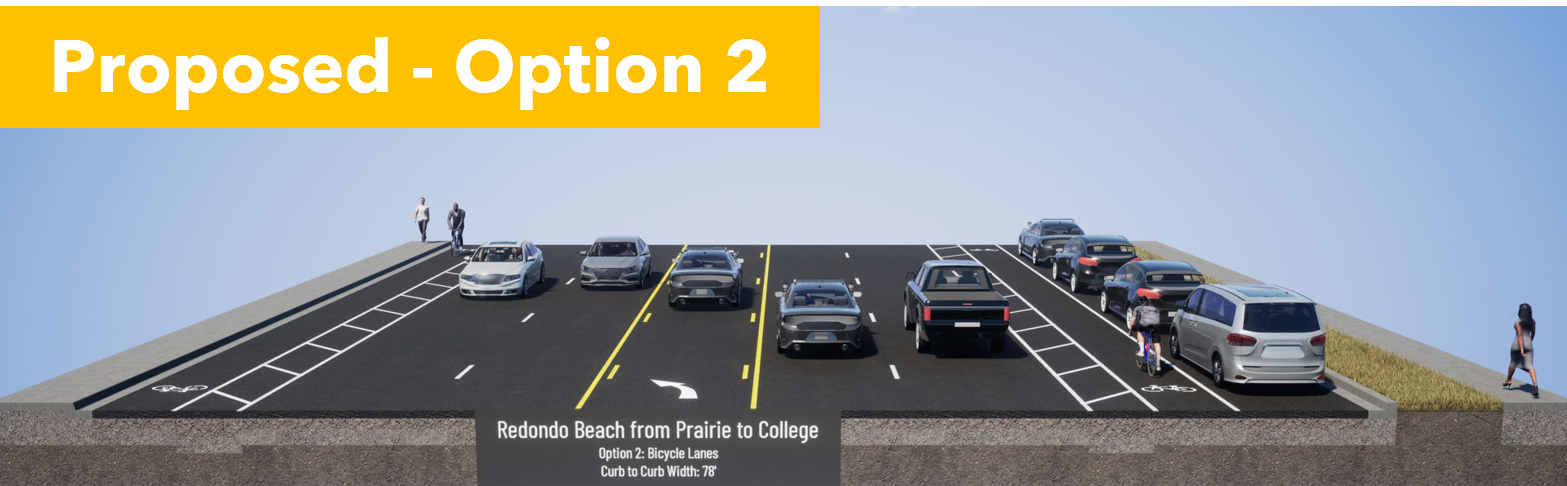
Q9: Redondo Beach Blvd from Hawthorne Blvd to Prairie Ave. I am Very Dissatisfied & propose a better solution. 


Although the status quo is very bad, we shouldn't rush into the proposed door zone bike lane next to high-speed traffic heading to the freeway onramps. It is extremely dangerous. This will greatly reduce the number of people brave enough to ride to Alondra Park and El Camino College. 

If there is enough room for on-street parking, then there is enough room for a parking-protected bike lane. That may require narrowing the car lanes a bit, but that would also inhibit speeding, making that stretch safer and quieter for all road users. 

The freeway onramp is on the north side of RB Blvd. A 2-way cycle track on the south side of RB Blvd would keep cyclists away from the crazy line of cars trying to merge onto the 405 on-ramp. Suggest that in Q11. 

Q10: Redondo Beach Blvd from Prairie Ave to Dominguez Channel. Pick Option 1, the 2-way cycle track on the North side, next to the park and El Camino College. 


Option 1 puts cyclists next to the park and ECC. Although it is shown with plastic bendy straws, it can easily be fitted with bollards or a concrete curb for better protection when cycling to and from evening classes at ECC. 


Option 2 puts cyclists in the door zone, where they can be knocked into fast-moving traffic and killed. Drunk or malicious drivers can also harm cyclists easily with only "paint as protection". 


Q11: Additional Comments: This is where we ask for a protected 2-way cycle track on on the south side of RB Blvd between Hawthorne and Prairie. 

What do you need to be comfortable bicycling this corridor? Tell them!

Keep in mind that younger Beach Cities kids will probably only ride the western side of this corridor, west of Inglewood or Kingsdale. But older teens and young adults may need to ride to ECC or to retail jobs between Kingsdale and Crenshaw. 

There are a lot of children and seniors in Lawndale and Torrance who would benefit from these bike facilities, whether they are riding a bike, trike or mobility scooter. 

We should make this corridor welcoming for ages 8-80. 

Think about who needs to travel through this corridor and at what times. What kind of cycling facilities do they need to get there comfortably and safely?  What about seniors in mobility scooters or electric wheelchairs? Would you like to see food delivery robots in the bike lane or more food delivery by privately-owned cars?

With better bike facilities, I may choose to bike to stores further east than I currently feel safe. Every trip I make by eBike instead of car, I am "sparing the air", not taking up road space in front of you, and not competing with you for parking. 

Another thing that excites me about this project is that it connects us to the Dominguez Channel. In a separate project, LA County Public Works will be extending the bike path along the channel southwards. It currently goes north to 120th St, past Amazon, Space-X, Lowe's and to the Metro Green/C Line. A southbound channel bike path would connect to the Harbor Gateway Transit Center, with very fast connections to the Silver/J Line to USC/Expo Park (15 min) and Downtown LA (20 min). Harbor Gateway TS is already linked up to CSU Dominguez Hills. This is a large step forward for a transportation transformation for the South Bay. 

Bike lanes benefit you even if you don't ride a bike, but your neighbors do. 

Bike lanes will save you time currently spent chauffeuring your kids short distances. 

Bike lanes will benefit your kids because students who get exercise before school do better. 

Bike lanes will benefit you when you age out of driving. 

Bike lanes may allow your family to shed one car, saving you over a million dollars per lifetime

Finally, I want to close with this terrific video of a #BikeBus led by Coach Sam Balto in Portland. 

https://twitter.com/CoachBalto/status/1656353963489501190?s=20

This bike corridor will touch the lives of half the students in RBUSD and can be transformative for the way our community gets around. If half of our households can shed just one car, we would be richer, our street parking and traffic congestion problems will evaporate, our air and water will be cleaner, and we will have done our part to slow climate change. Oh, we'll be fitter and happier, too. 

* A very few students living in North RB attend Mira Costa HS in Manhattan Beach, but only if MBUSD will take them.