I have written many times previously about Parking Angst in the Los Angeles region.
But, I want to write a quick post about why we should permit new homes without parking.
Why do we vacation in places without parking and then deny ourselves the pleasure of living in a car-light place in everyday life? People who live in places that look like this (photo from Livable Communities Initiative) do use cars and get deliveries in trucks. It's just that they park on an alley or a remote lot/garage and deliveries take place when foot traffic is low.
I hear often from people that this won't work in LA because our area was built around cars. So let me tell you about two people I met who live in LA and don't own cars.
Person #1 without a car:
I met him several times while he dropped off or picked up his grandmother at League of Women Voters events. As I got to know them better, I learned that the grandmother is 100 years old and has no children nearby. He is her only relative nearby; he lives in an apartment 1/2 a mile away and rides a bike over to her house.
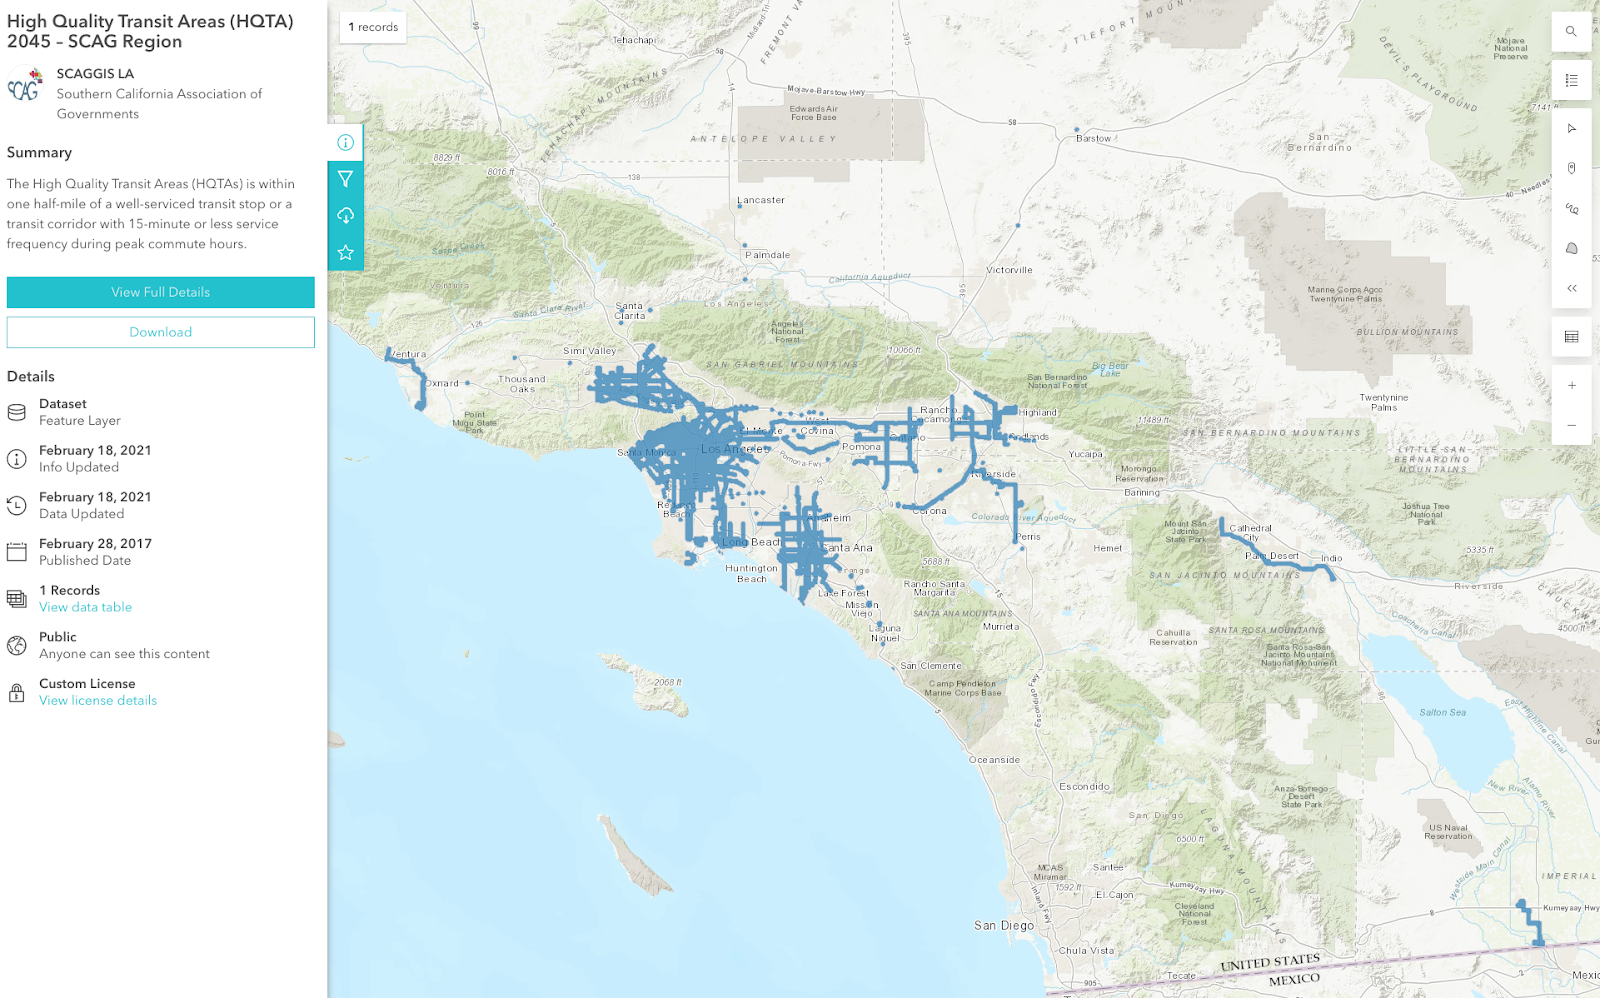
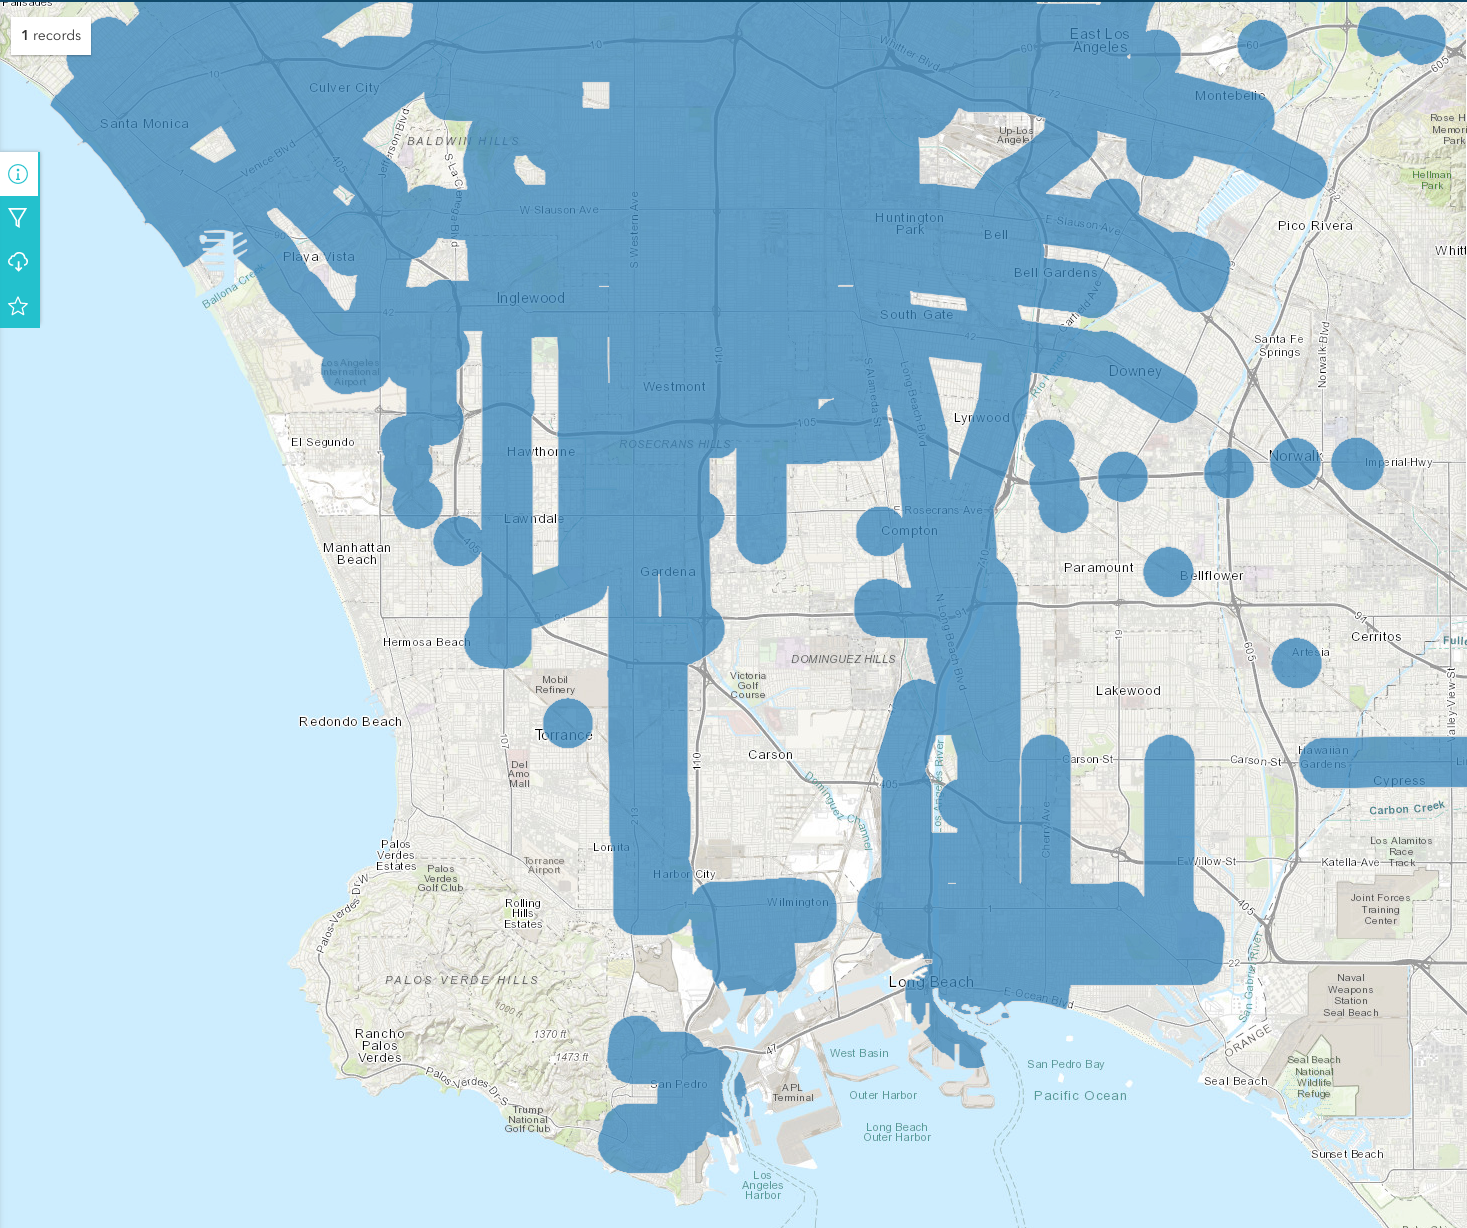
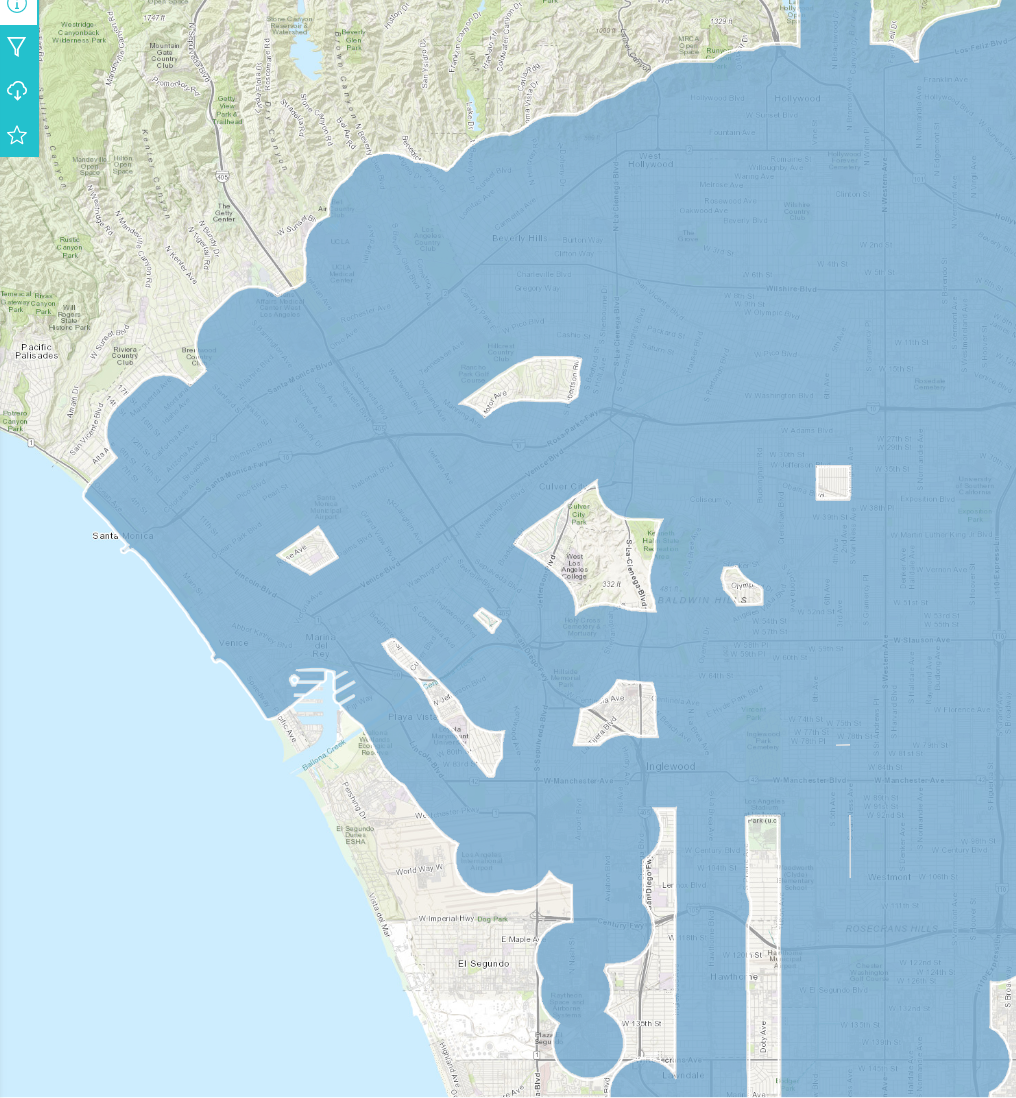
He drives her car to take her on errands (they can do their grocery shopping together) and appointments. He rides a bike or takes the bus otherwise. He lives on a major Metro LA bus line that runs every 10 minutes, which in planner speak is a High Quality Transit Area (HQTA). Click on the link for an interactive map of HQTAs in SoCal.
A car parking spot in this area--close to jobs, transit, and the beach--is very expensive because of the high cost of land. You trade off building housing for people or housing for cars. The grandson chose to live without a car, saving the cost of car ownership and parking. It's a win for him, a win for her (because she has someone close to look after her), and for the community (he works in the arts, which has been struggling in high rent areas).
Allowing cheaper housing without parking is clearly a win-win-win in this case.
Person #2 without a car:
I only met her briefly in Koreatown, but she made quite an impression on me. I was walking from a meeting at Wilshire Center to the Metro B/D station at Vermont and Wilshire. She passed me slowly on her e-scooter while wearing scrubs and a backpack. I caught up to her as we waited to cross Vermont and Wilshire to reach the subway station. We chatted. Then she folded up her scooter and ran into the station, disappearing into the crowd.
She lived in an apartment in Koreatown where parking is a la carte. Her landlord wanted $300/mo (2019 prices) for a parking stall in a garage and she wondered how much she needed a car vs a nice apartment in a newer building.
[Do the math on the $100,000 cost per stall for a multi-level parking garage, then double it for underground parking. $300/mo is not an unreasonable price to recoup the cost of building that parking.]
She was wearing scrubs so I assumed she worked in healthcare. She said that she was charged for parking at home and at work. In contrast, her workplace paid for transit passes. She added car payments, insurance, gas, parking, maintenance. She could save so much money, she could rent a car two weekends per month.
She sold her car and bought her own e-scooter to get back and forth to the train station quickly. I asked her how often she rented a car. She said that, she met a boyfriend who has a car. They take weekend getaway trips in his car. On Sundays, they run their errands together and he drops her off at her house with her groceries. She budgeted for rental cars, but didn't need them. She saves the money instead.
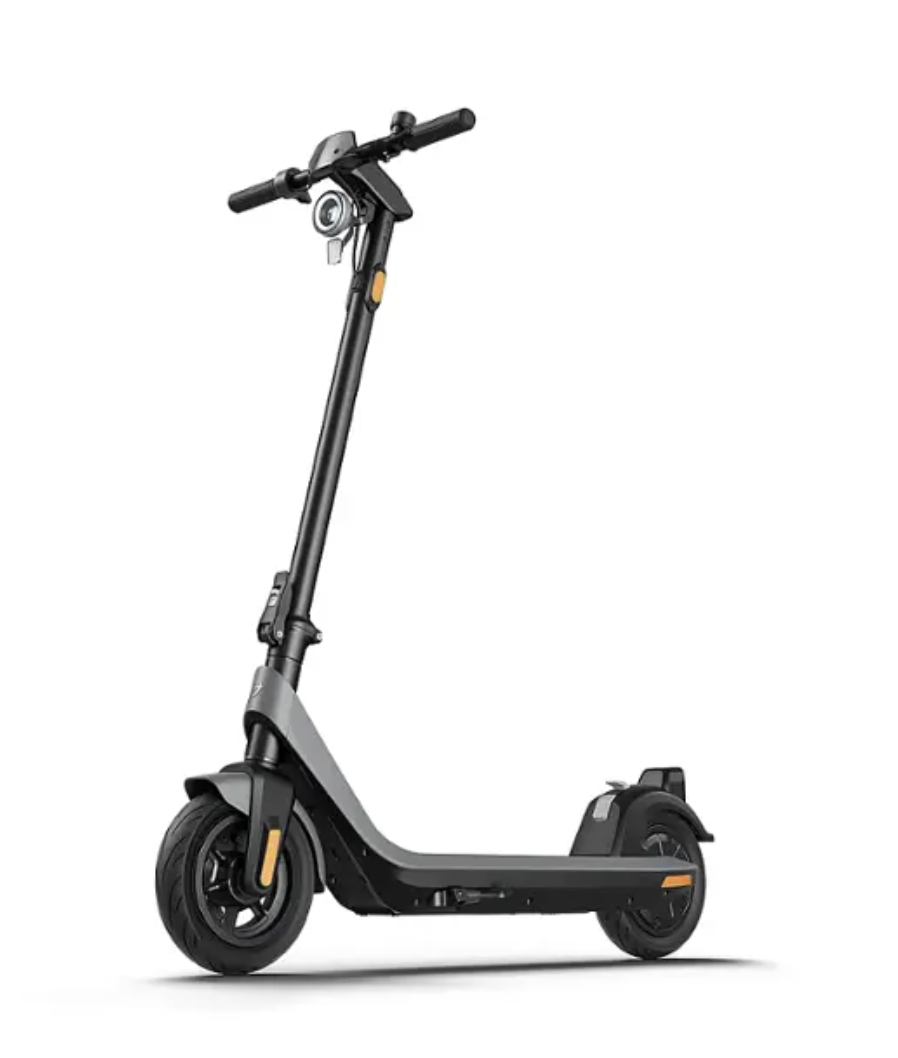
She basically had a 2018 version of this heavy duty, but slower speed scooter, purchased from Best Buy on Black Friday. It cost about one month of parking and she thought it was an excellent value.
Faster speed means heavier motor and more acceleration (could be dangerous if you are inexperienced or lose your balance). More range means heavier battery to haul on buses and trains. If you are just going (first and last mile) to transit, and can charge at home or at work, there is no reason to get a longer-range battery. Just buy an extra charger and leave it at work.
She convinced me. I bought a similar e-scooter, just in time for Covid and staying at home for Zoom meetings. You can see a picture of my husband riding the e-scooter and me riding my first e-bike on this SBCCOG Story Map.
Before you say, gotcha.
I know that neither of these people live car-free because they rely on someone else with a car. Both of these people live in car-free households, but occasionally share a car with another household with a single car. That's 0.5 cars per household. Why does Redondo Beach require 2.25 parking spaces per studio apartment?
It is possible for some people to live car-light or car-free most of the time, even in LA. Why should we enact all these minimum parking rules to make housing more expensive or impossible to build?
Wouldn't it be lovely if our children could stay near us in coastal California instead of moving to a Red state so that they could afford housing?
I often hear from people that I normally agree with on other issues that supply and demand don't apply when it comes to housing. I don't know why people who study housing all say one thing, and a corner of the advocacy space says another. I do have experience with Berkeley housing markets (albeit from the 1980s) and that soured me on rent control as the sole method to manage scarcity of an essential good.
Berkeley has long had a rent control ordinance and a rental registry to ensure compliance. Jeff Baker wrote some Python code to visualize the public data and it is fascinating. As a scientist, I always like to see real world data compared to idealized models of how things work.
The Rent Board of Berkeley, California maintains an Online Rent Registry with information about apartments and other dwellings under regulation by the city's rent control laws. The Registry lists the initial rent of a rent-controlled dwelling, and all of the subsequent annual adjustments.
The Registry tells us a bit about the city's rental market over time. Using the initial rent of tenancies still active at the present, we can deduce the market price of apartments in the year the tenant moved in. The chart below gives the median initial rent each year 1996-2022, adjusted for inflation to 2022 U.S. dollars, for tenants who are not listed as owners, managers, or any other special class.
Go to his site and read his analysis.
One surprising thing I learned is that, though rents in rent-controlled units are generally lower than in newer buildings not subject to rent control, they do rise unevenly instead of monotonically rise the maximum amount allowed. Rent-controlled rents plateau during recessions.
The population of apartments in the above figure are all older buildings, due to the nature of rent control in California. The rents shown are significantly below the advertised rents of the same size apartment in a new building in Berkeley. For example, some new buildings are currently advertising 1-bedroom apartments for around $3000 and 2-bedroom apartments at about $4200. The rents in old, regulated buildings are discounted by about 1 bedroom.
There's a lot of hand-wringing about how today's building code requiring two staircases results in mostly studios and 1-bedroom apartments with a few 2-bedroom units on corners. So, new construction is heavily weighted towards smaller units. Not too great for families, but fine for 1-2 person households.
Older units subject to the most stringent rent control have to report the new leases within 30 days of signing the lease. Newer buildings only have to report annually, Each dot represents the average rent for initial leases signed in one month. Note that the dots are really tiny, meaning hardly anyone moves. In a university town of 100,000+ population, less than 20 people move into 1-BR rentals.
In Dec 2017, 18 new leases for 1-BR apts were signed at an average rent of $2267 (2022 dollars). A bunch of new apartment buildings came online in downtown Berkeley, allowing people to move. That is when the bubbles become larger. By Dec 2024, 27 new leases for 1-BR apts were signed with an average rent of $1950 (2022 dollars). At the same time that the rent stock got more numerous, more modern (new units), it got cheaper in real dollars.
Remember, older rent-controlled units have to report monthly. Newer buildings can report annually. The bigger circles are from the months that the newer buildings reported en masse, so the average new rents for those months are higher. In August 2023, a whopping 785 new leases for 1 BRs were signed.
Notice how the small circles are falling faster than the big circles?
What's going on here? I heard that building new, expensive apartments makes rents in older units more expensive!
The data in Berkeley shows that new, expensive apartments makes rents in older units decline! Score 1 for the housing economists who say that supply and demand applies to housing.
There are fewer new 2-bedroom apartments because of the International Building Code (IBC), but the same effect is noticeable in the 2-BRs.
In Dec 2017, 14 new 2BR leases were signed for an avg of $3124.
In Dec 2023, 18 new 2BR leases were signed for an avg of $2529.
In Aug 2023, 275 new 2BR leases were signed, which is less than the 785 new 1BR leases for the same month. (Thank-you IBC.)
IBC hardly ever results in new 3 BR homes. But, when you have too few smaller apartments, people move in with roommates and outcompete families with children for the larger units. Even without building new 3 BR homes, just allowing people living with roommates who would rather live on their own (or in smaller households with fewer roommates), causes the rent for larger homes to stop sharply rising.
In June 2017, 19 new 3BR leases were signed for an avg of $4534.
In June 2023, 110 new 3BR leases were signed for an avg of $4728.
The circles also get larger, meaning that there are more vacancies that allow people to move to something that better suits their needs and desires. That's a win for overall happiness.
So, rent control provides certainty for incumbent renters, but doesn't allow them mobility if they need a larger or smaller unit. It also makes it impossible for new entrants to the market to find housing.
Creating new homes, even expensive ones (IBC is expensive to comply with), can lower the rents on older units.
Do you remember when California spent more money on building and operating prisons than on higher education? I remember. Those were terrible times for every one involved except for the prison profiteers.
[We are still grappling with the aftermath as public university tuitions soared, UCs made up lost revenue by admitting out-of-state students instead of qualified in-state students, and student loan balances approached the size of mortgages for their parent's generation.]
Rehabilitation and reintegration into society are hard to explain in a soundbite. They are not as catchy as "3 Strikes and you are out!", but they have more evidence showing that they work and they are more cost-effective.
I am not going to link to that awful LA Times article about the person who was let out of prison, only to commit a murder. You can always find a few recidivism stories. But, you will rarely find a news story about rehabilitated prisoners who successfully reintegrate into society because they very understandably need their privacy.
You will also not read stories of the children whose parent came home from prison, possibly on "supervised release" where they wear a GPS ankle bracelet. Even a parent on supervised release can perform childcare so that their co-parent can go to work. This can prevent a family from falling into poverty and repeating the cycle.
Crime statistics show that crime is going down at the same time that we are using evidence-based principles to decide appropriate punishments/rehabilitation, and to reduce prison populations. This is the time to stay the course. Do not harm families, bankrupt the state, and steal our futures again.
Criminal justice reform, just like climate change mitigation and adaptation, requires clear-eyed analysis of the complex issues, and consistent practice of evidence-based solutions. It takes time, but it is worth it.
While you are voting, please reflect upon why it is easier to build prisons than college dorms and vote for people who will help build college dorms and more housing in general.
In Mono County "more than 90 percent of the land is owned by conservation-minded government agencies: the U.S. Forest Service, the federal Bureau of Land Management and, most controversially, the Los Angeles Department of Water and Power."
Public open land is usually not developed for a reason. Read the legal definition of Open Space. Most importantly, Open Space has value for ecosystem services (that may indirectly help humans).
Open space for the preservation of natural resources including, but not limited to, areas required for the preservation of plant and animal life, including habitat for fish and wildlife species; areas required for ecologic and other scientific study purposes; rivers, streams, bays and estuaries; and coastal beaches, lakeshores, banks of rivers and streams, and watershed lands.
One of the reasons for acquiring US Forest Service lands is to protect watersheds for downstream users (farmers and urban users). If you don't see any buildings or roads on it, the land is working as intended. I don't want to get into a debate about whether it is appropriate to divert water from the Eastern Sierras for the City of Los Angeles. But, if this is the headwaters for a water supply (one of many) for 4 Million people, it is correct to protect the upper watershed from housing development & the roads necessary to service the housing. The USFS lands protect watersheds for other downstream users, including wildlife and farmers.
Mono County is over 2 million acres, 94% of which is publicly-owned. This leaves 120,000 acres of privately-owned land that could potentially be used for housing. About 7,500 people reside in the Mammoth Lakes region and another 35,000 visit annually. You can easily find enough space to house workers if you build densely enough in already-developed areas. The only thing preventing you is imagination and bad zoning. (You will also have to do some infrastructure work, but it will be much less than if you continued the sprawl development pattern.)
The population density of Mono County is 4 people per square mile. Even if you add in visitors (vacation home owners), the density is still < 20 ppl/sq mi. In contrast, my census tract in suburban Los Angeles County has 18,000/sq mi. If you use only the 6% of private land, that's still only ~500 ppl/sq mi. I know that some of the land is not suitable for housing, but there is still lots of room to build infill housing if the local government were to allow it.
Not allowing denser housing in town, near the jobs, is causing the homelessness euphemistically called "Van Life". Small towns can build social workforce housing so that workers won't have to compete with vacation home buyers. Salida, CO is doing that. They are building UP--allowing mixed use housing above downtown commercial space. They purchased land downtown to build a 100% affordable workforce housing project. Why don't the Mono and Inyo county towns do something similar? Infill workforce housing of < 100 units is exempt from CEQA (Class 32).
I was incredulous when I learned that the communities did not have public bathrooms and showers. It would not take that much space and $ to build public bathrooms and showers. Colorado mountain towns often have laundromats that sell showers. (So refreshing after a backpacking trip.) Why don't the CA towns build their own public showers or partner with a laundromat to add showers?
Don't whine about others so you can perpetuate sprawl. Make bathrooms and showers available in the short term. Upzone the small towns and keep everything compact, affordable and sustainable.
I was coached to give an executive summary so people know where I am going.
Executive Summary
Sewage Capacity is not a reason to deny infill housing in established areas of Los Angeles County.
It's cheaper to service sewage from infill housing than for sprawl housing because you are using capacity that already exists and is currently underutilized.
Infill housing reduces or eliminates the cost of declining water flows, reducing costs to existing residents.
Infill housing spreads the fixed costs of infrastructure among more customers, reducing costs to existing residents.
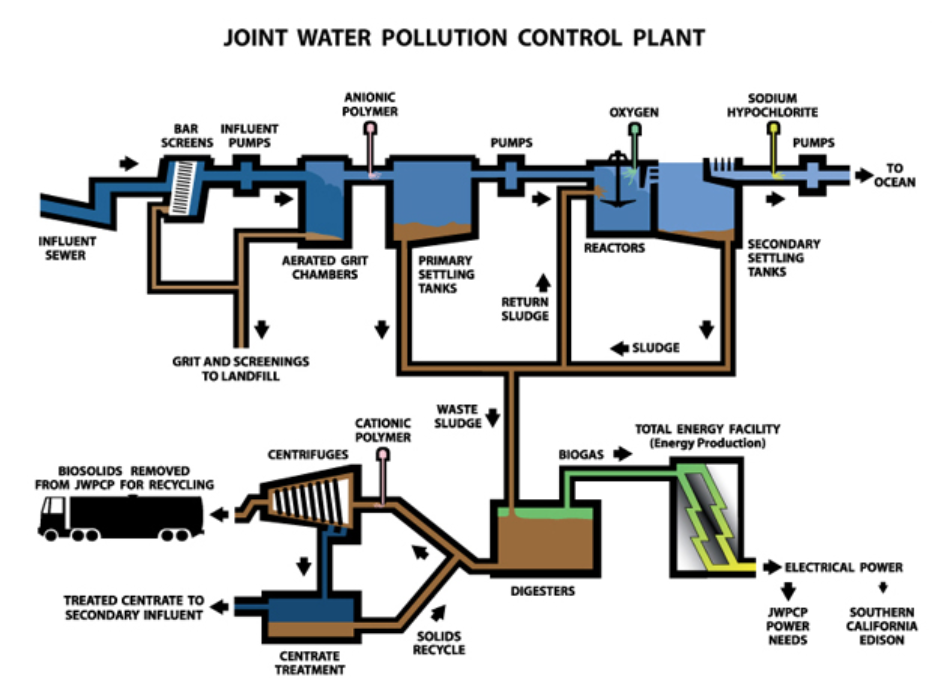
And was also told to add more color pictures, like this One Water Cycle graphic by Brown and Caldwell, 2017.
It was such a classic display of NIMBY Kettle Logic about horrible traffic and parking woes, which they themselves contribute towards. This area is simultaneously such a historic area that it should not be desecrated with more traffic, while it is already so traffic-choked, that it cannot accommodate one more car.
But, since I had just been thinking about the societal impacts of chemistry and engineering, I homed in on the arguments about sewage.
A massive build like the one being proposed will dramatically change the character of our neighborhood.
It will also have a significant impact on traffic in the surrounding area.
It will further tax our already heavily burdened water and sewage systems, and potentially have damaging environmental impacts to the Quassaick Creek and its wildlife.
The build puts additional strain on the current water supply and added pressure to the city sewage system’s downstream capacity.
Residents in the town of Newburgh are currently nearing our maximum agreed sewage usage with the city. ... In 2004 the town updated their intermunicipal sewer agreement with the city to increase the amount of sewage the town sends to the city treatment plant at 2,000,000 gals/day with the ability to send an additional 2,000,000gals/day providing the town pay to enlarge the current city facility. This previously cost taxpayers $1,250,000 to construct the necessary facilities. According to the November 3 town planning board minutes, the town is currently sending 2,000,000 gals/day already and at their first allotment. They have 2,000,000 more gallons owed to them, but much of that has already been allocated to other projects.
As stated in their draft scope, the proposed apartment complex would produce an estimated 28,380 gals of liquid waste per day. And according to the 2004 intermunicipal contract "when the town’s average flow exceeds 3.4 million gallons per day as evidenced by the last 90-day average flow" a second expansion will need to be constructed by and paid for by the town residents, unless we insist the cost be passed on to the builders of these new projects.
The US Census office estimates that Newburgh, NY has a 2021 population of 28,834.
If 28,834 people send 2,000,000 gals/day of sewage to the treatment plant, that's 69.4 gallons per capita per day (gpcd). How many times are they flushing every day?!?! Or do they have many industrial facilities? Why are they using so much water?!?!
If Newburgh residents were as water-thrifty as Angelenos, they could house 10,000 more people and have cheaper sewage service as well because they would be spreading fixed costs among more customers.
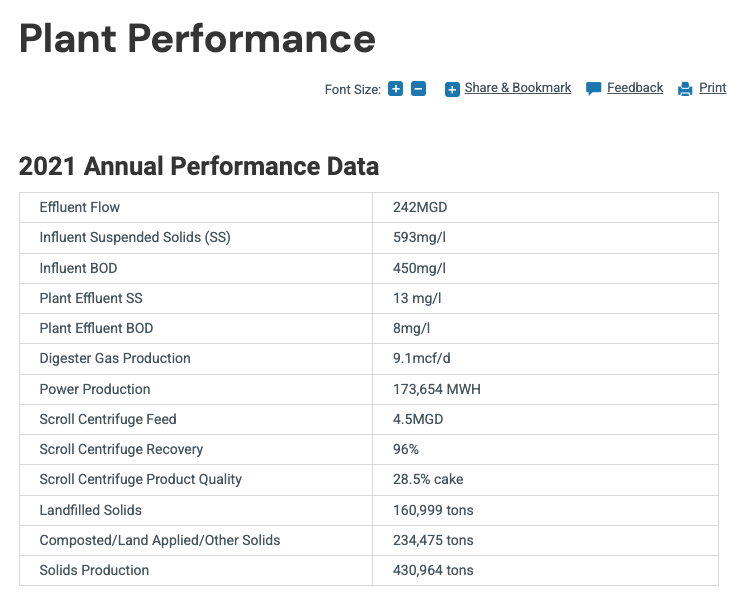
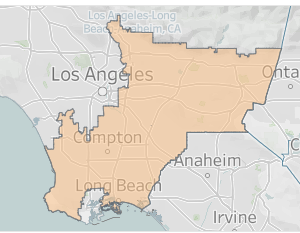
JWPCP has a design capacity of 400 MDG, we've added ~1 million people to the service area in the last 20 years, and we are still using only 60% of the capacity. We can add millions more residents without needing any more sewage treatment capacity.
JWPCP is a huge plant that serves almost half the people in the most populous county and one of the largest manufacturing centers in the US.
If Newburgh residents were really concerned about not overrunning their sewage capacity, they should look at water saving household appliances, low-flow toilets and low-flow shower heads. But, perhaps they are just not interested in providing homes for people.
They do seem interested in providing homes for cars. One of their objections to this apartment complex is that it will only provide 515 parking spots for 259 homes.
Enough poking fun at Newburgh NIMBYs. We have plenty of NIMBYs at home in Los Angeles County to poke fun of.
Gratuitous diagram of JWPCP, a social network tying together 4.8 M Angelenos
Consider the problem of declining water flows. This is a serious and expensive problem for established areas that are not building housing fast enough to offset improvements in water efficiency. Californians in existing developed areas are using about 2% less water per year. If that is not offset by infill, this causes problems for both drinking water and sewage systems.
California Urban Water Agencies surveyed their members and wrote a white paper on Adapting to Change: UtilitySystems and Declining Flows. Go to Section 6 (page 22), Impacts of Declining Flows on
Wastewater Treatment Plant
Operations. 40% of urban systems reported effluent quality problems.
Lower flow means longer residence times in the sewage pipes, which exacerbate production of gases. That's both an odor and a corrosion problem. It also decreases the amount of hydraulic pressure, which works with gravity to move sewage towards the treatment plant.
In fact, the less hydraulic pressure you have, the more energy you need to apply (e.g. sewage lifting stations) to push the effluent along. We have so much excess capacity in our existing sewage mains, it's costing us more energy to pump it to the treatment facilities.
You also need to spend more unclogging pipes. We sometimes have to put fresh water into the sewage mains to reduce the residence times, clear clogs, and provide hydraulic pressure.
We'll save the problem of declining flows on drinking water systems for another day. Spoiler, it's cheaper and safer for everyone if we concentrate new residents in existing areas rather than build new sprawl.
Bonus Sewer Content:
the year is 1873.
in cleveland, a tall and narrow sewer is being dug deep underground and built by hand, brick by brick to move sewage. the work is hard. the need is great. the city is growing.
* C&EN News = Chemical and Engineering News is the monthly general interest magazine for members of the American Chemical Society. Bad Dad and I both hold BSs in Chemistry and he also has a PhD in Chemistry (while I hold a PhD in Chemical Physics). Although our work is far from what most people consider chemistry, we still enjoy learning about happenings in the Chemistry world and the policy implications and societal impacts of Chemistry. Editorial leadership of C&EN News eliminated coverage of science policy and societal impacts. Sign the petition if you disagree.
I've given a talk in December 2022 and am scheduled to talk again in January and February 2023 to groups comprised mainly of older homeowners concerned about lack of transit and wheelchair-accessible housing in their communities. Most are unaware that those are connected.
The High Quality Transit Areas (HQTAs) is within one half-mile of a well-serviced transit stop or a transit corridor with 15-minute or less service frequency during peak commute hours.
Founded in 1965, the Southern California Association of Governments (SCAG) is a Joint Powers Authority under California state law, established as an association of local governments and agencies that voluntarily convene as a forum to address regional issues. Under federal law, SCAG is designated as a Metropolitan Planning Organization (MPO) and under state law as a Regional Transportation Planning Agency and a Council of Governments.
The SCAG region encompasses six counties (Imperial, Los Angeles, Orange, Riverside, San Bernardino and Ventura) and 191 cities in an area covering more than 38,000 square miles. The agency develops long-range regional transportation plans including sustainable communities strategy and growth forecast components, regional transportation improvement programs, regional housing needs allocations and a portion of the South Coast Air Quality management plans
Seniors want to stay in their own homes, or at least in their own communities. And they want frequent transit to serve them. They've looked around and are deeply unhappy with what they have found. Why can't we have frequent and good transit like other places they have vacationed at?
Why doesn't the South Bay have good transit? We're visibly a transit hole. High quality, frequent transit does not touch most of the residential areas of the Beach Cities, El Segundo, Torrance and Palos Verdes Cities.
Is it because wealthy people can afford cars and don't need transit? Nope, not if you compare to Santa Monica, Culver City, Pasadena and Beverly Hills.
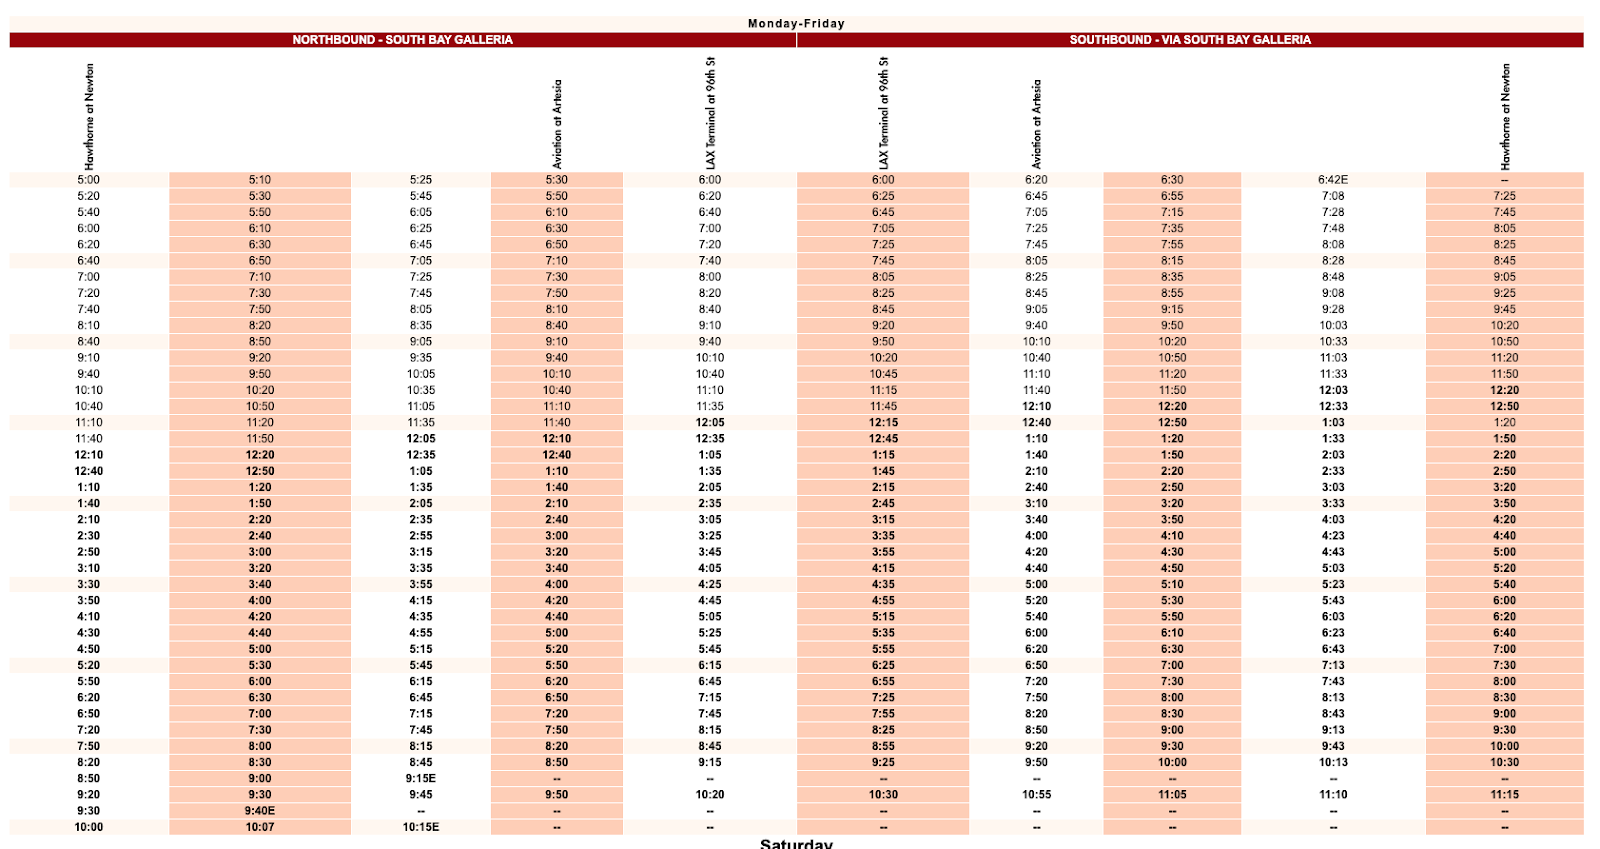
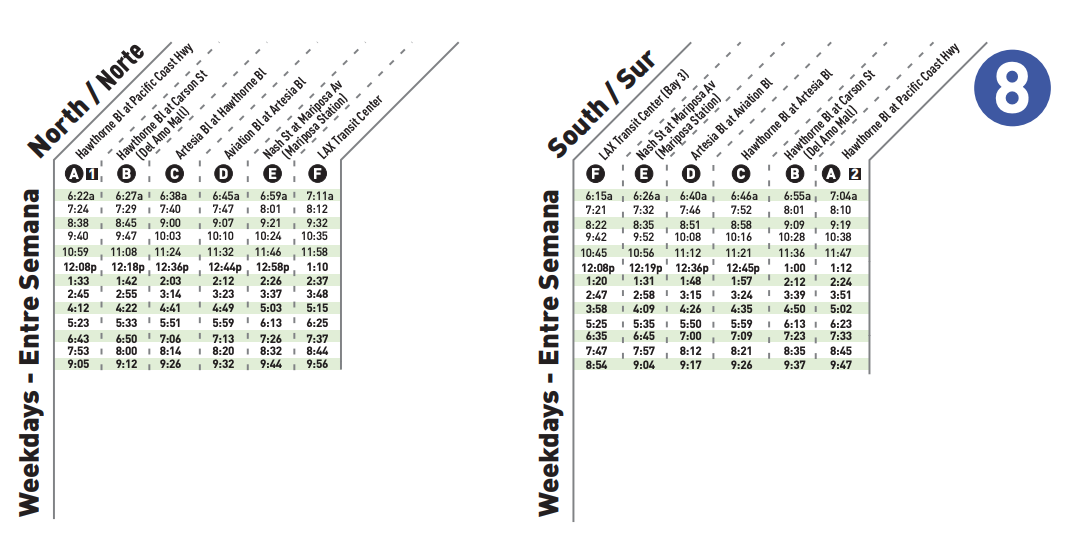
When we purchased our home in the late 1990s, we researched bus lines, bike commutes and USGS geologic maps. We really liked that the Torrance 8 bus ran between our home, daycare, workplace at 30 minute frequency throughout the day and even more often during peak commute hours. Those buses were well-used by people who worked in El Segundo and lived along the route in Torrance, North Redondo Beach and Hawthorne.
Over time, the service degraded noticeably and wasn't reliable any more. That's the main reason why I ride my eBike during the day and drive at night. Transit isn't viable for me any more, even if I want to take a bus to dinner and then walk home (burn off dessert) or catch a ride home with my dinner companions. Even during peak hours, the buses are infrequent and often get canceled at the last minute.
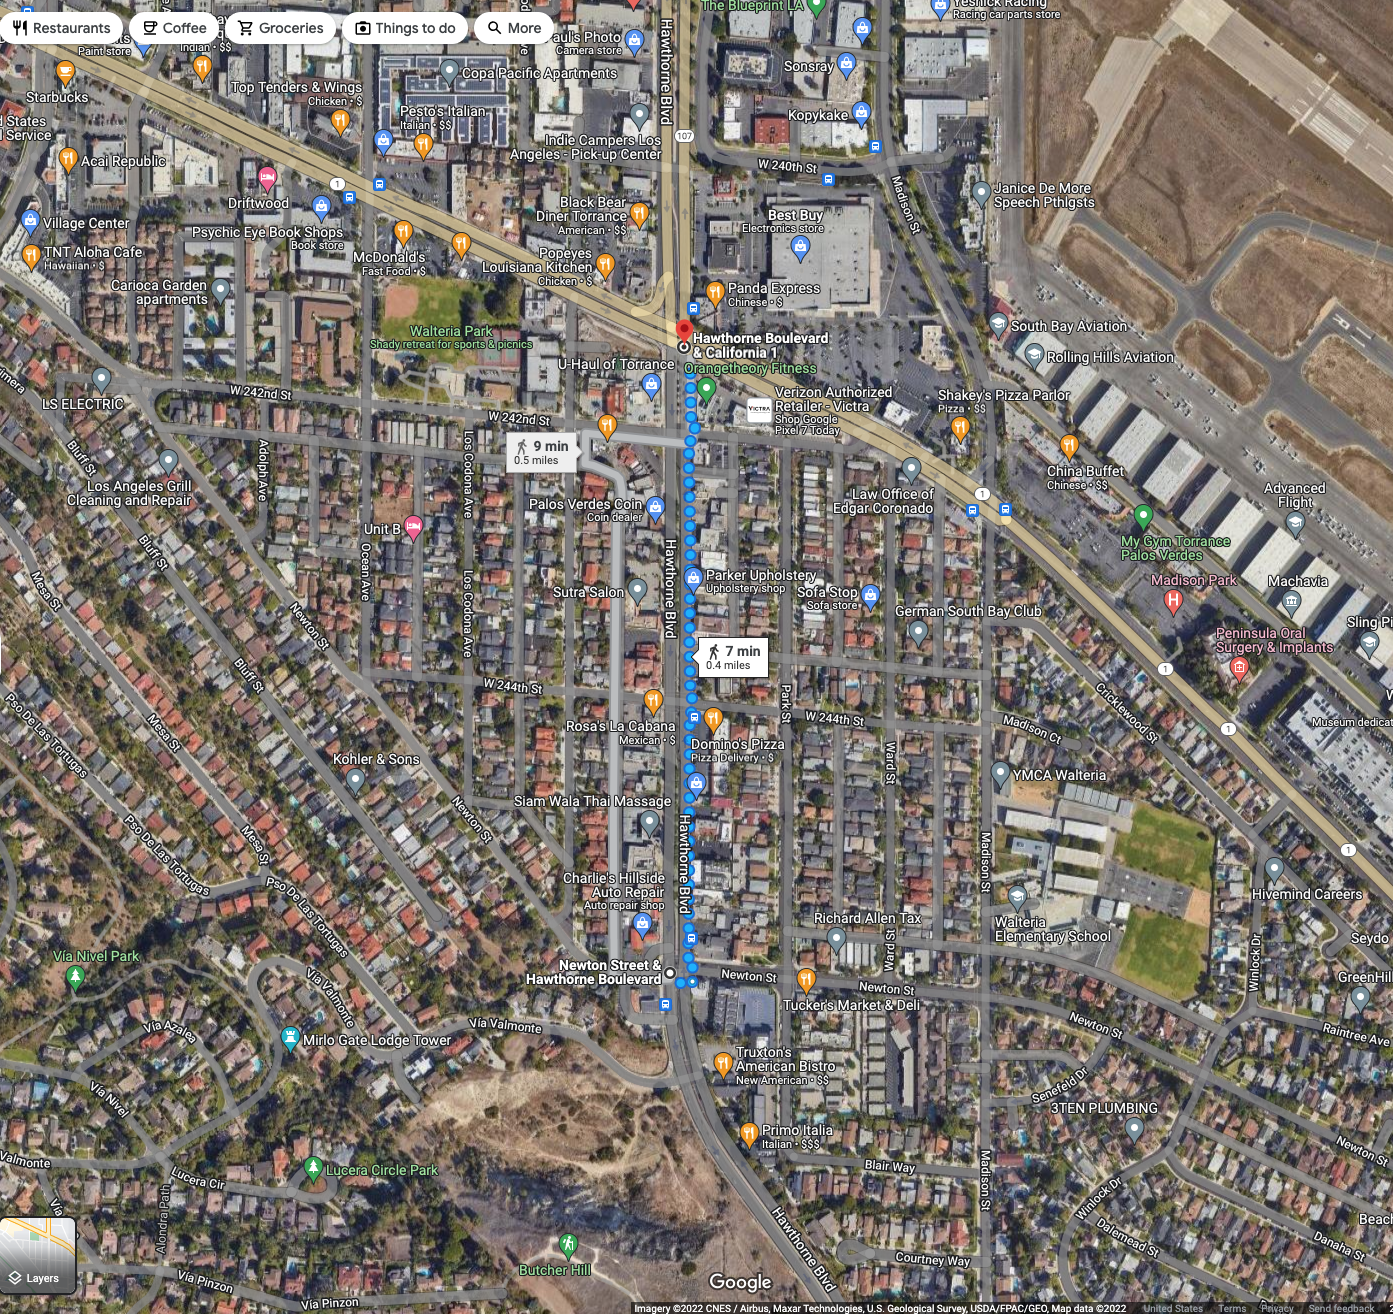
Moreover, the southern terminus of the route used to be at Newton St and Hawthorne Blvd, a short walk from hundreds of homes. Now the route has been shortened to end at the intersection of two state highways, Pacific Coast Highway (CA1) and Hawthorne Boulevard (CA107). To reach the stop, people have to walk farther from their homes and cross wide highways with 7-9 lanes of deafening traffic.
When I regularly took the bus, they were well-utilized. Most seats were occupied at peak hours. Even after peak, about half the seats were taken by people out shopping or going to their retail/service jobs.
Buses operate at a loss. That's why we pay taxes to subsidize them. But roads and parking lots also operate a loss and we never question whether or not they are necessary. Fuel and registration fees cover only about half the costs of roads; the rest comes from general funds.
The cost of "free parking" is borne by customers or tax payers, including those that didn't drive there. The subsidy is flowing towards drivers, not bike riders. In fact, pedestrians receive the lowest subsidy, then bike riders (cost of bike racks), then transit riders, then drivers.
But I digress. Let's get back to poor bus service. The seniors I talk to all want frequent buses that run near their homes. They would prefer the buses to run past their existing homes, but are willing to move to a condo or apartment complex within their communities if that is the only way they will get high-quality transit.
Sounds good. Let's pick some areas to serve intensively with transit, and then build lots of homes there. The more transit riders there are, the better service we can maintain; it's a virtuous cycle that serves seniors aging out of driving well.
Not so fast, building housing is politically toxic throughout the southland. Today's seniors have elected (for decades) local leaders running on platforms of preserving the "neighborhood character" of their "unique community", and fighting "overbuilding" and "Sacramento overreach".
Elected leaders are suing the state of California about whether they should be exempt from state housing law (like the Housing Accountability Act) and questioning both the legality and the numbers in the Regional Housing Needs Allocation.
The State of California's Department of Housing and Community Development (the CA analog of the Federal Government's HUD), tells each regional planning authority how many homes their region needs to build to provide for existing and future residents. Each region decides for themselves how they want to allocate those homes based on their goals and values.
The formula is a product of our professed values. We claim to value opportunity, so we assign more housing near where the jobs are. We claim to value clean air and want to lower Greenhouse Gas (GHG) emissions, so we place homes in HQTAs. We claim we want to address inequality, so we assign more low income housing to places that traditionally have not provided lower income residents.
Conversely, it assigns more higher income housing in poorer communities that can benefit from the tax base provided by higher earners. It's not forced gentrification or ghettofication. It's just trying to level the playing field to help everyone succeed. The goal is to work together with neighbors to solve regional problems like pollution, congestion, and the housing crisis.
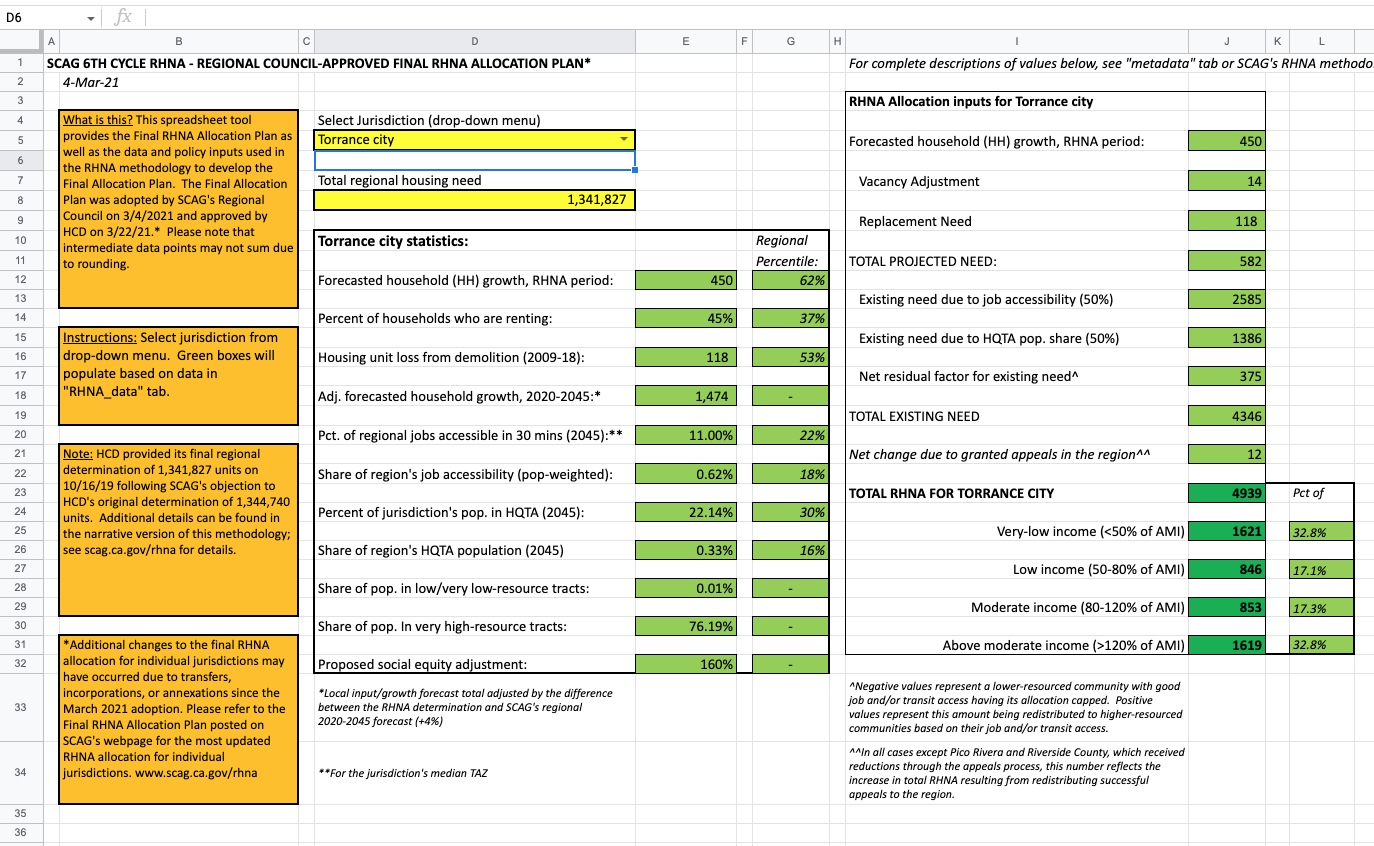
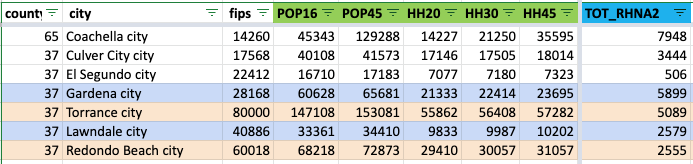
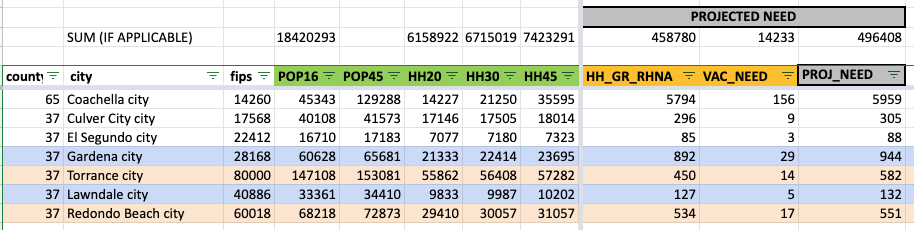
Just select your city of interest in cell D5. Here's Torrance, the city that runs Torrance Transit and presided over its demise. Torrance is big mad at their 6th Cycle RHNA "quota" of 4,939 homes over the next ~8 year RHNA cycle. They have never been given such a high allocation before. Their 5th Cycle allocation was 1,450, and they didn't even meet that.
I paired Torrance with their neighbor, Gardena; and Redondo Beach with neighboring Lawndale. Notice how the smaller cities are given higher RHNA allocations than their larger and more affluent neighbors. They are assigned 2-3x as many homes per capita.
Is it because of job access? Look at the SCAG GIS map of Job Centers. Torrance is smack dab in the middle of one of the largest job centers in Southern California, with ~129,000 jobs.
Both loudly-complaining cities, Torrance and Redondo Beach, have more jobs and easier access to jobs than Gardena and Lawndale, hence they were assigned more homes in the Jobs column.
What explains the big differences then?
Go back and look at the HQTA map. It's all based on existing population in the HQTAs within each jurisdiction.
The more people already living inside the existing HQTAs used in the planning formula, the higher their HQTA-based RHNA allocations. Most cities like jobs (with the possible exception of pre-pandemic San Francisco) so they don't play as many games with that.
Cities know that the way to finesse lower RHNA housing allocations is to minimize the areal coverage of HQTAs in your city, and then to minimize the number of people who live in the HQTAs.
This is how El Segundo, home to LAX and the 121,000 jobs in the LAX job center,
and with 3 light rail stations inside of their cities and one just over the border at LAX, got allocated just 1 home due to HQTA. Yes, just 1 home!
When El Segundo fought to avoid permitting homes east of PCH, this is the subtext. They gave up land to Hawthorne to avoid having homes in their jurisdiction near a rail station.
Sorry to be the bearer of bad news, but South Bay seniors who want to live in wheelchair accessible home with viable public transit will have to move away. Transit sucks now and will not be added back if it will expand HQTA coverage area. No new homes will be built in HQTAs if local officials can stop it.
(This is also why California enacted laws to preempt local officials to force them to permit home building in HQTAs.)
It's all connected to the decisions made by the people we elected and the incentives they operate under. When they talk about preserving the "neighborhood character" of your "unique community", and fighting "overbuilding" and "Sacramento overreach", they collect donations and win elections.
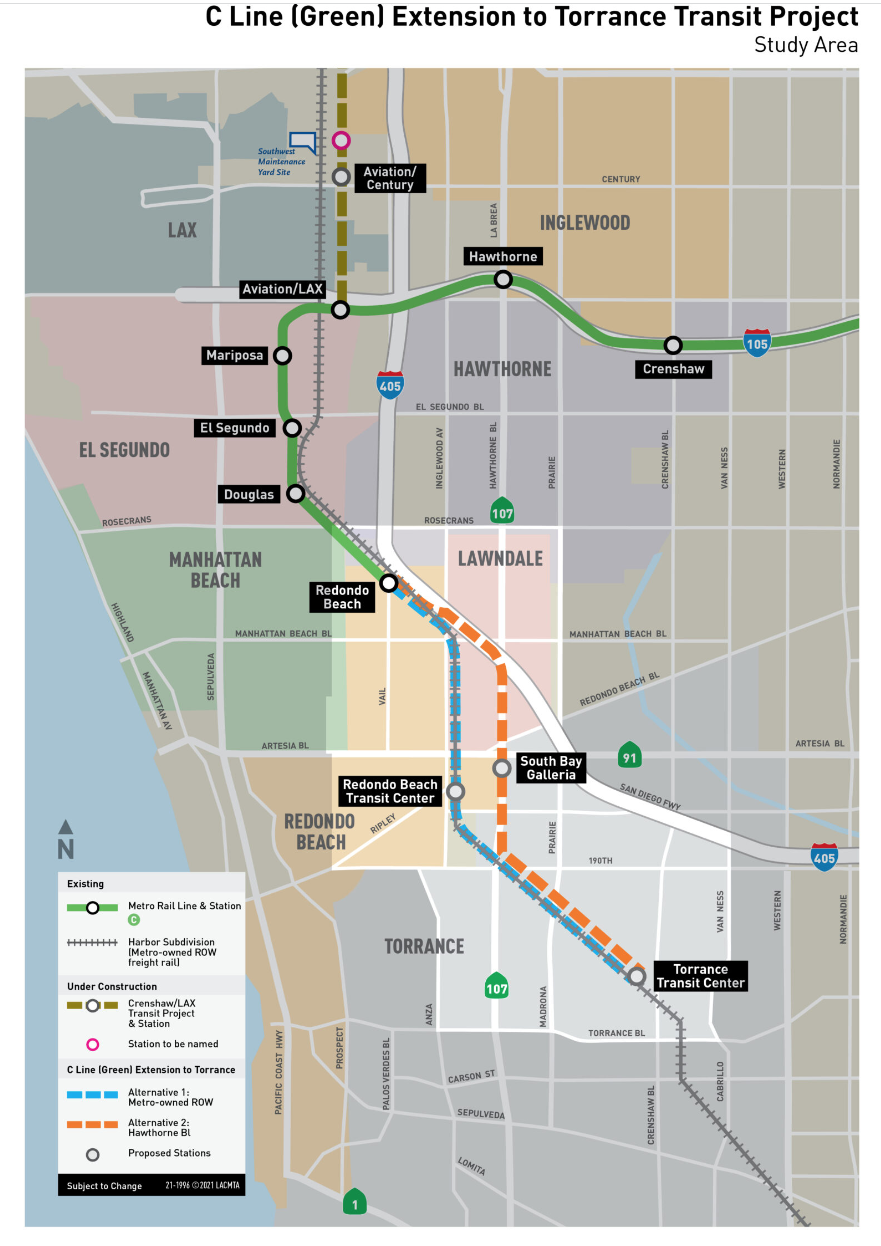
They don't tell you that they will never allow expansion of HQTAs within their jurisdictions if they can help it. This is a large part of the subtext of the fight over Metro C line extension routing. Your elected officials are fighting to ensure you don't get access to rail transit (which is harder to cancel/decrease than bus lines) so that they won't have to build housing.
They don't even want to build in existing HQTAs lest it expose them to higher RHNA allocations in future cycles. So instead, they talk about shadows and view sheds, impose high parking minimums. These all serve to reduce the number of homes that can be built and the number of people in the homes.
They don't tell you that the kind of low-density zoning they are protecting will only every yield townhomes with stairs, built on top of car garages. Low density zoning and height limits makes building accessible apartments with elevators prohibitively expensive to build. They hope developments don't "pencil out" (can't be built profitably), so that the developers go away.
What homes do get produced will be very expensive because they have to cover the parking and land. If you can build 2 stories of housing over 1 story of parking, they have to charge a lot more than if they built 4 stories of housing over the same parking structure on the same land. To maximize affordability, they could even stop requiring parking since seniors and the disabled are much less likely to drive or own cars anyway. Parking is another proxy war to suppress housing.
If you want to solve a problem. then you solve the problem. You don't spend decades screaming the problem doesn't exist. You don't enact ordinances that make the problem even worse. You don't sue people who point out that the problem exists. You don't defund researchers who collect data and evidence on the problem.
This applies to climate change and our regional housing crisis.
Enough, tonight. I just want to point out that it's all related.
Enjoy the Metro C Line (Green) Extension to Torrance Project Simulation Video. Think about how you want to live as you or your parents age out of driving. Think about where you want your children and grandchildren to live as the planet gets hotter and hotter. Do you want them on the cooler coast with you? Then make room for them.
I know that I will fight for a light rail route that is closer to my home. And I will also fight for a 7th Cycle RHNA allocation that can't be gamed by climate arsonists.
Even if we get a higher RHNA allocation based on light rail routing, California law gives us local control about where we place that home growth. We can and should spread it out, particularly as our area ages. The medical industry jobs in Torrance keep growing, and South Redondo Beach is very close to those jobs.
Aside:
Coastal Los Angeles Communities are facing a Silver Tsunami of aging residents and a dearth of younger families. Housing is so expensive, our children move far away. (A few may live with us.) The SCAG RHNA formula projects future housing needs based on demographics of existing residents. If you have few current residents of child-bearing age, then you won't have many births or future residents to house.
Since we have moved homes affordable for young, families so far into the inland deserts, they were assigned higher RHNA allocations than older communities along the coast. I included the data for Coachella in my comparison table.
Coachella has 14,277 Households in 2020, while Culver City has 17,146. Yet, Household Growth in Coachella is projected to be 5,794 while Culver City's is only 296. That's a 20-fold difference!
If you push young people out of your city, you will be assigned lower RHNA numbers. But then, who will help you change your senior diapers? How often will you see your children and grandchildren?
Anyway, stop fixating on "winning" a game of foisting housing elsewhere. Plan for a better future for yourself by planning for a more inclusive future in your community.
I hear so much vitriol spewed against building low income housing, predicting all sorts of negative outcomes. Crime! Blight! Traffic! Ghettoization! Gentrification!
Your children's teachers are listening. I've been advised to use color pictures to spice up the tables of data. So I pulled this photo off the website of Washington Elementary School, the ES with the highest concentration of Title I students in RBUSD.
UCLA Professor John Rogers told the League of Women Voters of Los Angeles County at one of our meetings that the 10th percentile (in earnings) public school teacher in California needs to pay an astronomical portion of their income in rent if they wanted to live in a 1 bedroom apartment in the county where they teach.
Insert horror face emoji.
I looked up some statistics for Los Angeles and Redondo Beach and he is horrifyingly correct.
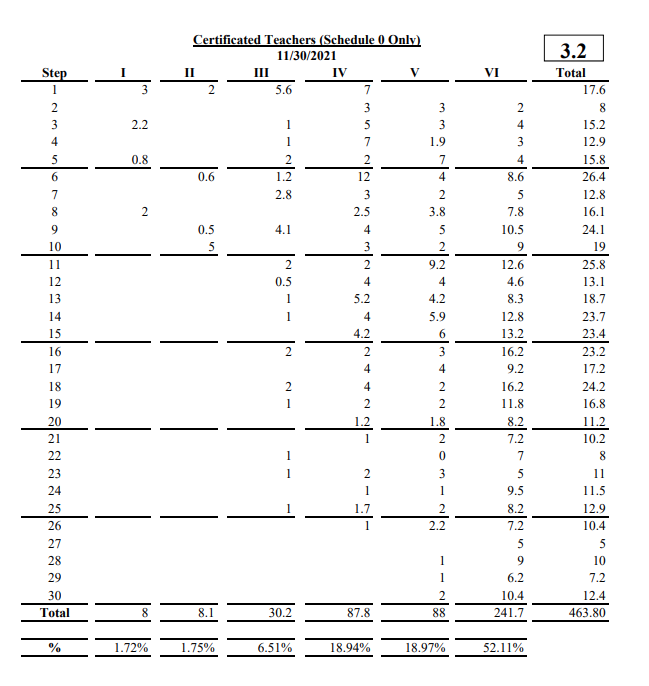
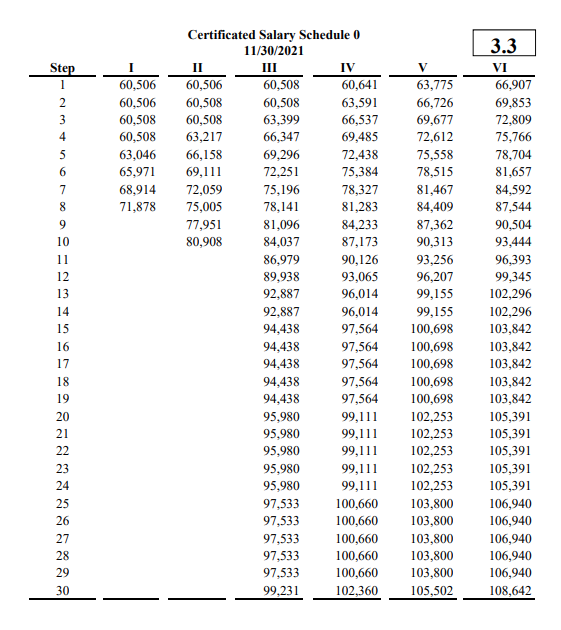
Here's their list of certificated teachers (doesn't include non-certified teachers' aides). There are 463.8 Full-time Equivalent certificated teachers. Some work part-time schedules.
Here's the salary schedule for each classification and step (years of experience). The 10th percentile teacher is an early career elementary school teacher, earning in the low $60,000s, possibly still paying off student loans for a bachelors plus 1 year of grad school.
That sounds like a pretty good salary, right? Consider the 2022 HUD Income Limits for California. Scroll down to Los Angeles County. Each column represents limits for # of people in the household. So a single teacher would be in column 1, and fit in the low income category (below $66,750).
That young, energetic teacher that your child loves so much? They are the very people you are excluding when you block low income housing.
Qualifying for low income housing is much easier than securing it.
Consider that Redondo Beach's Section 8 program has 4,260 people on the wait list as of September 2022. It was last opened to the public (briefly) in 2015. (7 years ago!)
441 households enrolled in the city’s Section 8 program
117 families
324 seniors/disabled
In the quarterly briefing
6 people got new contracts for housing+vouchers
4 people were permanently off the program (died, moved away, earned too much)
119 households signed contract renewals
Demand for housing assistance is so high, RB's Section 8 program is limited to only Very Low Incomes (below $41,700); Low Income households like teachers do not qualify.
Some private landlords of new properties have to set aside a certain number of homes at Below Market Rate (BMR) in a negotiation with cities referred to as Mixed-Income Cross Subsidies (typically 10-20% set aside as BMR). They typically also prioritize public sector employees working in the city. That's helpful for attracting and retaining teachers who have a choice of school districts to work in.
You have to build homes in order to have BMR units. Because Redondo Beach builds so few homes, and approves almost exclusively townhomes (no apartment buildings), they have produced a total of 2 subsidized units in the last decade according to one study I read.
That leaves Redondo Beach school teachers--and most workers--out in the open market.
Someone earning $60,000/yr can afford 30% for rent, about $1,500/month.
Rentcafe.com says that there are no apartments for rent in RB below $1,501/mo. Only 5% of them are below $2,000/mo. The average apartment is 825 sq ft and rents for $2,939.
HUD publishes Small Area Fair Market Rents by zip code for Los Angeles County. They are set to approximate a 40th percentile rent in a zip code--typically older, no-frills housing. The High School is in 90277, but inland 90278 is slightly cheaper. The columns are for studios, 1, 2, 3 & 4 bedroom homes.
If our benchmark young elementary school teacher rented a studio in 90278, they would pay 39% of their gross $5,000/mo salary to rent a shabby studio for $1,940/mo--if they could find one. They would then join the ~80% of Los Angeles County renters that are rent-burdened, spending more than 30% of their income on rent.
If they didn't want to be rent-burdened, say if they also need to eat after paying off student loans, they could get a studio apartment in Inglewood, or a 1 bedroom apartment in Lennox. But, then, they would need to get a car and factor in car payments, gas, insurance and maintenance. Those costs could easily run $500-$750/month, so teachers might be better off with a more expensive apartment near work that they can bike to.
Teachers are very smart. They are listening. They are trained to process, analyze, and interpret information. What take-away message do you want them to hear?
I'm not a lawyer, but I will say as a scientist that it is claptrap.
So much nonsense was spewed that would fly under the radar of people not in the trenches of housing policy. I suspect that using the need for street trees to push through a more expansive policy is designed to make infill housing (eg ADUs*enabled by SB 9) harder or more prohibitively expensive to build.
But, I want to push back on the pernicious myth that carbon sequestration through urban trees is better than building infill housing.
Let's do the math!
A mature urban tree can absorb about 20 kg of CO2 per year. MIT Climate Issues rounded that to about 50 pounds. (Click through to read how they debunk some of the 'nature-based solutions' talking points.)
The largest employers in my city are Northrop Grumman (next to a light rail station) and our local school district (dispersed around the city, not served well by transit). Since school teachers cannot afford the median house price of $1,587,500
or even the median condo price of $1,007,000
teachers drive in from elsewhere. The only places in LA County actively building new apartments and condos in substantial numbers is Downtown LA (DTLA) or Old Town Pasadena.
It would take a mature tree more than a year to sequester the carbon emissions of just one day's commute for a teacher commuting in from where they can find housing that they can afford.
I looked up more data.
California requires 180 school days/year. There are a few additional teacher prep and in-service education days, but let's use the lower 180 number.
I looked up the RBUSD budget and see that there are 463.80 Full-Time Equivalent (FTE) teachers in the district.
I can't ensure that all infill homes will go to teachers in the community.
I do know that teachers have to live somewhere, so they need homes. It would be great if they could live close enough to participate outside of school in the communities where they teach, and if they didn't need to drive a car to work.
The benefits of workforce housing:
Planet (fewer climate-wrecking CO2 emission)
Community (the teacher can be more present)
Public health (fewer car miles = less air/water pollution)
Teacher health (long driving commutes have well-documented detrimental health impacts)
Now substitute teacher for any other job in our city. This includes store clerks and caregivers to the elderly or young children that make just above minimum wage. They take care of us. We need to take care of them. We won't be able to build enough ADUs to fill the need. But, we can build enough apartments and condos, in a thoughtful way, to reduce the need for climate-destroying and space-gobbling automobiles.
Asides:
ADU = Accessory Dwelling Units or Granny Flats or In-Laws' units. ADUs generate a little extra density in single-family neighborhoods, create homes without generating much external impact. In fact, when used to house caregivers or those needing care, or local essential workers, they reduce car traffic or Vehicle Miles Traveled (VMT) overall.
Keeping low-density existing homes is NOT better than replacing them with higher density housing, even accounting for embodied carbon. But, I'll cover that myth in another post.
I hear lots of chatter about preserving or increasing urban tree canopy in order to combat the urban heat island effect. That's a good idea. I'm all for trees. In fact, we bid aggressively on both our home purchases because they had more trees compared to other homes in our budget/area. More on that later.
I got asked this again and decided to publish this as a blog post instead of in an email because this is such a common misconception.
First, read Vacancy Truths from September 2021 for background. There's a link to Darrell Owens' explanation about why home might be vacant and what we can learn from US Census Data. If a rental changes tenancy every 2 years, and it takes a month to clean/rehabilitate/lease out the rental. Thus, a 1/48 or 2.1% vacancy rate can mean essentially no open homes available.
As housing stock gets older, it takes longer to rehabilitate the units. Supply chain issues are also increasing the amount of time it takes to build new homes or spruce up old ones. It's not unusual to spend 2-6 months remodeling. A major SoCal developer announced to investors that home building is taking 6-8 weeks longer due to lack of materials and/or workers, citing kitchen cabinets as a major pain point.
The particular question from yesterday was from new homes in Pasadena, CA. She was sure that the new buildings in Pasadena are vacant and that developers get tax breaks to keep them vacant.
In 2010, Pasadena had 59,551 homes (4,281 vacant) and 137,122 people
In 2020, Pasadena had 61,643 homes (3,659 vacant) and 138,699 people
This means that Pasadena added more homes than people in the last 10 years. This is not a failure in planning. This reflects the general trend of households (HH) trending smaller and older people staying in their homes longer, even if they don't need all that space. Younger people can't afford the single family homes (SFH) or don't have the down payments required to purchase SFHs or condos, so they end up living in the apartments downtown.
It's possible that some of the new infill homes in central Pasadena are vacant, but they may still be under construction (lack certificate of occupancy), rentals being readied for a new tenant, or be for-sale condos waiting for a buyer. (For-sale homes are vacant longer than for-rent homes.)
Let's look at the data from the SCAG Local Profiles for communities in the 6-county (Ventura, LA, OC, Riverside, San Bernardino, Imperial) SCAG region. I pulled these charts from page 12 of the Pasadena Local Profile, 2018. They are derived from building permit data. Some of them are rebuilds and do not produce net new homes. (Likely source of discrepancy between the SCAG and Census data.)
Pasadena has done a better than average (for the region) job of building new homes in the downtown area. That is also why so many young people live there. New people (young people forming households, newcomers to the area) will flock to where the open homes are.
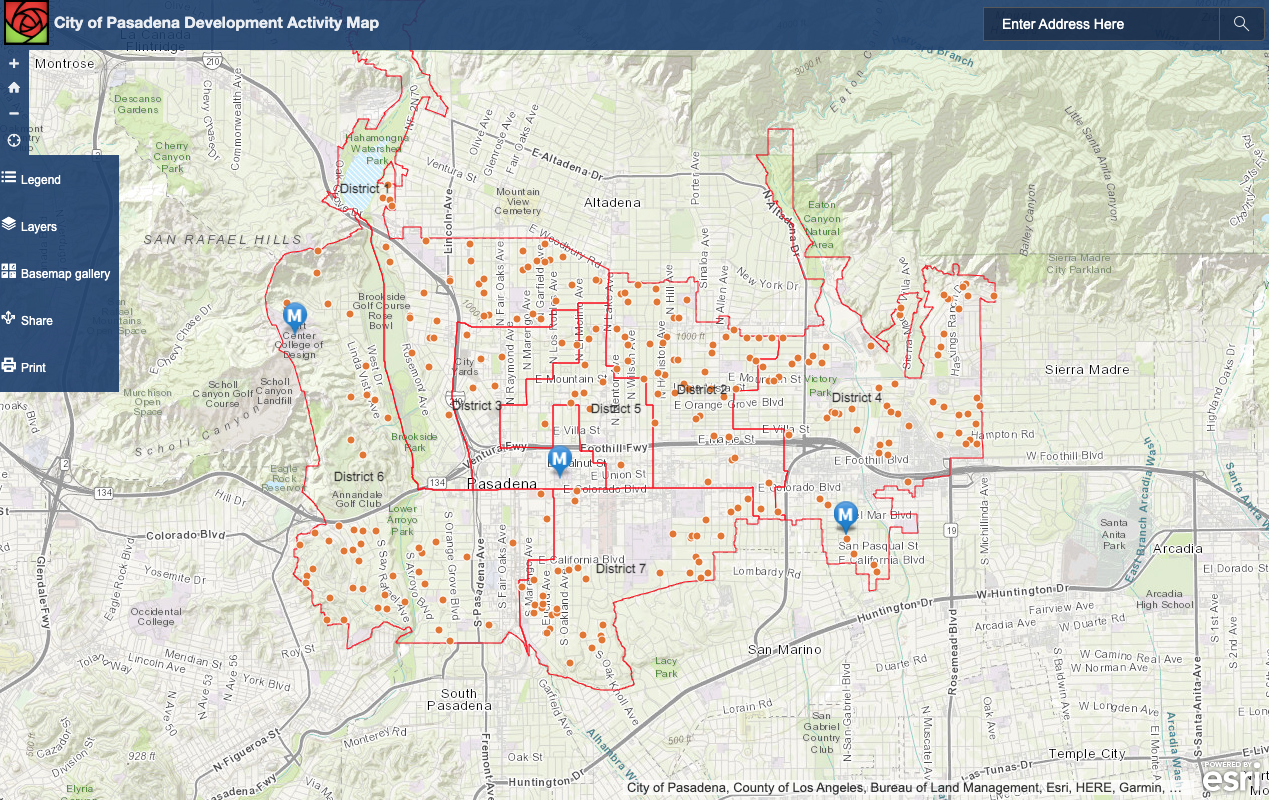
It may seem like there is a lot of construction, especially downtown, but it's a sampling bias. The City of Pasadena Development Activity Map shows building permits distributed throughout the city, but many of them are remodels or ADUs. The big construction projects are downtown, along major streets and freeways, because that is the only place cities allow them to be built. If we are driving around on the major roads (as most of our driving should be) we'll see more of the major projects. Explore the map; click on the orange dots to view data on each building site.
I checked Apartments.com and there are 164 apartments available for lease in Pasadena with next day occupancy (June 14, 2022). I checked Zillow and it shows 218 homes for sale and 152 for rent. I checked hotpads.com and it shows 279 apartments for immediate lease. Anyway, that's well under 1% of rental homes truly vacant, looking for a renter. Sounds like a very tight housing market.
Rate.com says that Pasadena has a 1.2% homeowner vacancy rate and a 2.9% rental vacancy rate. I found it informative to compare Pasadena and Redondo Beach. That "little old lady from Pasadena is real; 27% of Pasadena residents are seniors. But 25% are 20-34.
Pasadena has 53% working age population (20-64) supporting 47% elderly (65+) or youngsters (0-19) for a dependency ratio of 0.89. Redondo Beach has 44% working age population supporting 56%, for a dependency ratio of 1.27. If you don't provide for young people, then your children will have to move elsewhere, and that can socially isolate the elderly as they age out of driving. My home town of Redondo Beach is facing the Silver Tsunami with no plan.
In 1950, California voters passed Proposition 10 that became Article 34 of our state constitution which bans construction of publicly-financed low-income housing unless a majority of voters approve.
Guess how many were approved in higher income, whiter areas?
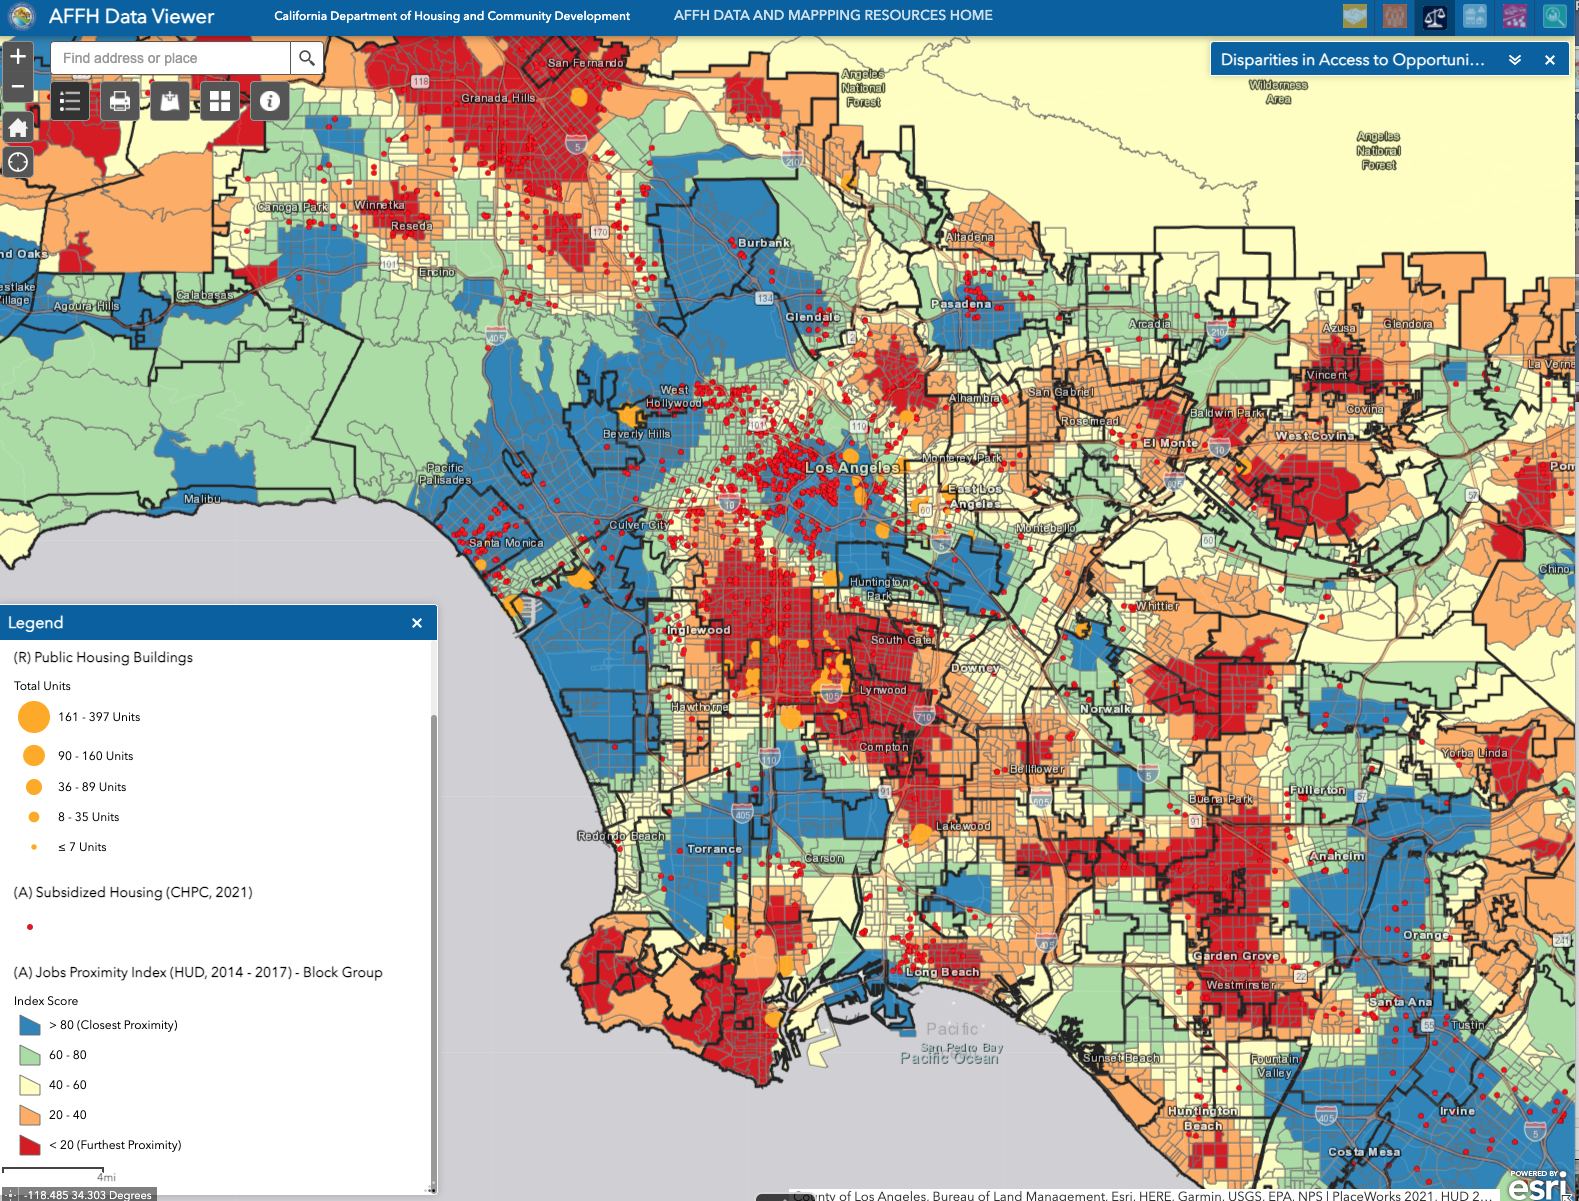
You don't have to guess, because California has created the Affirmatively Furthering Fair Housing Map, so you can see exactly where they are. Not surprisingly, Public Housing (the publicly-owned ones targeted by Article 34) are rarely in the wealthy suburban areas of Los Angeles County, where the excellent schools and abundant jobs are.
Notice how many of them are clustered around Freeways. Funny how areas with poor people attract freeways and how the only places that don't encounter NIMBY opposition to low-income housing is next to freeways.
But, didn't I write in the last post that there were subsidized homes in Redondo Beach? Yes, but there are different types of subsidized homes. The ones I showed last time are part of a mixed-income community, cross-subsidized by other residents of that complex--not the government. They don't even show up on this map because they don't use public funds (except some minor administration).
If we visualize government-Subsidized Housing, funded by HUD and LIHTC, you can see that they are more broadly dispersed, but still concentrated in certain areas.
HUD (yellow) = Housing and Urban Development, funding directly from the Federal Department of Housing
LIHTC (red) = Low Income Housing Tax Credit, a Reagan-era program created in 1986 that substitutes direct federal dollars with tax credits for private developers. It's very complex, but it's the biggest program in use today.
Click on each red or yellow dot to learn more about each development.
My mother lived in a LIHTC home for a few years after maintaining her old house was too much for her and before she needed assisted living. We submitted paperwork each year to requalify her for below-market-rate (BMR) rent. (In Silicon Valley, paying $2200+/mo for a 1 modern bedroom apartment is considered a great deal and worth giving her landlord an $800/mo tax subsidy over full market-rate rent.)
To create any kind of subsidized affordable units, you have to build in the first place. If you block all new housing, you can block subsidized housing without explicitly saying that is your intent.
The map below shows the percentage of rentals in each census tract that are rented using Section 8 vouchers. Click on each Census Tract to get details of how many units that represents. If you have only one rental 4-plex building in a census tract, but it is all Section 8, then that shows up as 100% and dark brown. If you have 3000 rentals in another census tract, and 400 of them are Section 8, then it shows up in a lighter color. But the second tract is providing more affordable homes.
People can't use Section 8 vouchers in your neighborhood if you block apartments from being built in your neighborhood.
That brings us to the biggest impediment in my area, the lack of units whose rents are low enough to qualify for the program. After all, the government should subsidize basic, not luxury homes, right?
The HUD Fair Market Rent is set on a regional level, so it's supposed to be an average of Los Angeles, Long Beach and Santa Ana. But, that regional average rent doesn't stretch to the rents in most high opportunity areas. Try finding a 2 bedroom apartment in southwest Los Angeles County for $1330-1708/mo in 2021. This is another reason there are no or very few Section 8 beneficiaries in many census tracts.
If you have more time to kill, explore the AFFH map further. Click on the squares at the upper left to expose menus of datasets you can layer. For instance, select Jobs Proximity Index. The blue areas have the best access to high numbers of good-paying jobs. The red areas have the least access (by both car and transit). Notice how comparatively few subsidized homes are in the blue areas?
If we are going to reduce Greenhouse Gas (GHG) emissions and air pollution, we need to move people closer to their jobs. No, that does not mean shipping jobs to the desert. It means that we densify the already developed areas. Unfortunately, this is considered intensification of land use and is very hard to do under existing law.
Do we change the human laws or do we ignore the physical laws that govern climate change?