Showing posts with label Sustainability. Show all posts

Friday, March 03, 2023

True Cost to Own

This post was inspired by a Twitter exchange with a Culver City resident who was able to shed one of her family's two cars due to the Move Culver City Project to reallocate space from cars to transit (bus lanes), active transportation (walking/biking) and micro-mobility (scooters, wheelchairs). 


Culver City's city council balance changed from 3/2 in support of this street space reallocation to 3/2 opposed. The new city council wants to reverse the street space allocation and give 100% of the public space to cars again despite the city's own data that transit and bike use grew explosively while car use declined.  Read the Move Culver City Mid-Pilot Report.  


I think reversing Move Culver City is a big mistake for many reasons, but I will just get into the financial angle in this post. 

Car ownership is so normalized in US society that I think we stop paying attention to how much it's really costing us. When AAA published their annual report "How Much Does it Really Cost to Own a New Car 2022", it surprised many people. [2023 Update is even grimmer, $12,182/year]


There were the usual arguments that not everyone buys a new car. But, this assumes the average new car sells for $33,301 when Kelley Blue Book reports that the average car price set a new record in December 2022 at $48,681. Car and Driver reports that Los Angeles drivers pay $681/year more for car insurance than the national average.  

$10,728 is an underestimate for the cost to own a car in Los Angeles. That price also does not include the cost of a parking spot, which you are paying for whether it's a line item in your budget or not.  Everyone seems to complain about parking, even though Los Angeles has more homes for cars than for people

If households with multiple cars can shed one car, they can save $10,728/year. 

Median Culver City household income in $97,540 with a marginal tax rate (CA+Fed) of 33.3%. 

Owning a car costs $16,084/year pre-tax. 

If that money were put in a tax-deferred retirement savings account every year for 30 years, that household can accumulate just under $1 Million! 

I assumed that the money was saved in a Vanguard Growth and Income Mutual Fund (VGIAX) earning about 6.54% over the last 20 years or 10.78% over the last 10 years. 

The Bureau of Labor Statistics CPI inflation calculator says inflation ran 2.65% over the last 20 years. 

Using a conservative 4% above inflation estimate for VGIAX, the Bankrate Compound Interest Calculator shows that the household that was able to shed a car winds up with $916,300 after 30 years in their retirement savings account. Yes, you do pay taxes as you withdraw that money, but that's a huge chunk of money nevertheless. 


In Summary, if Move Culver City allows families to shed one car, then that is a $1M gift to the families in Culver City. 

Reversing/removing the street improvements--making buses too slow to use and bicycling too dangerous to attempt--forces families into cars again. If they have to own a second car again, then Culver City families lose $1 M. 

Elected officials should think long and hard about whether they want to force car dependency and costs onto their residents. It's not good for residents, it's not good for the planet, it's not good for the city. Finally, I don't think it's good for the elected officials' ability to get re-elected. 


Monday, July 18, 2022

So your city has declared a climate emergency

 We are experiencing record heat in both North America and Europe, during a La Nina year (when the planet surface tends to be cooler than average).  The only way to stop this long-term runaway heating is to quit emitting so much CO2 and other planet-warming gases. Yet, our elected leaders, even in deep blue states, are not doing the necessary work.

I am so tired of fighting for substantive changes that I wrote about in Data Driven Climate Action. We know that 44% of LA County's GHG emissions comes from the transportation sector. If you add fossil fuel refining, it's over 50%. Over 2/3 of transportation emissions comes from private light-duty vehicles (cars, trucks, SUVs, minivans).  Much of those miles are "junk miles" in the sense that they are short trips that could be done without a car if the built environment were not so auto-centric. 

I have been a bicycling advocate since graduate school in the 1990s, when I was studying gas-phase chemical physics. We knew it was cars back then, and it's still true today. 

Global Atmospheric CO2 was 360 ppm (parts per million) when I volunteered for my first Boulder BikeWeek. 

CO2 was 367 ppm when I volunteered for my first El Segundo Bike to Work Day Challenge in 1998. 

CO2 was 369 ppm when I went to my first Beach Cities Bicycle Network Community Outreach meeting in 1999.  Community outreach took forever. My 21 year old daughter wasn't even conceived yet, which was why I had time to attend the meeting. 

CO2 was 392 ppm in 2011 when the South Bay Bicycle Master Plan was adopted. Cities pledged that they would add the bike lanes when they repaved or did work on any of the streets in the network. Over time, the network would be completed. A few cities did the bare minimum, striping in door zone bike lanes or stenciling sharrows when they repaved streets. Others, just ignored the plan. 


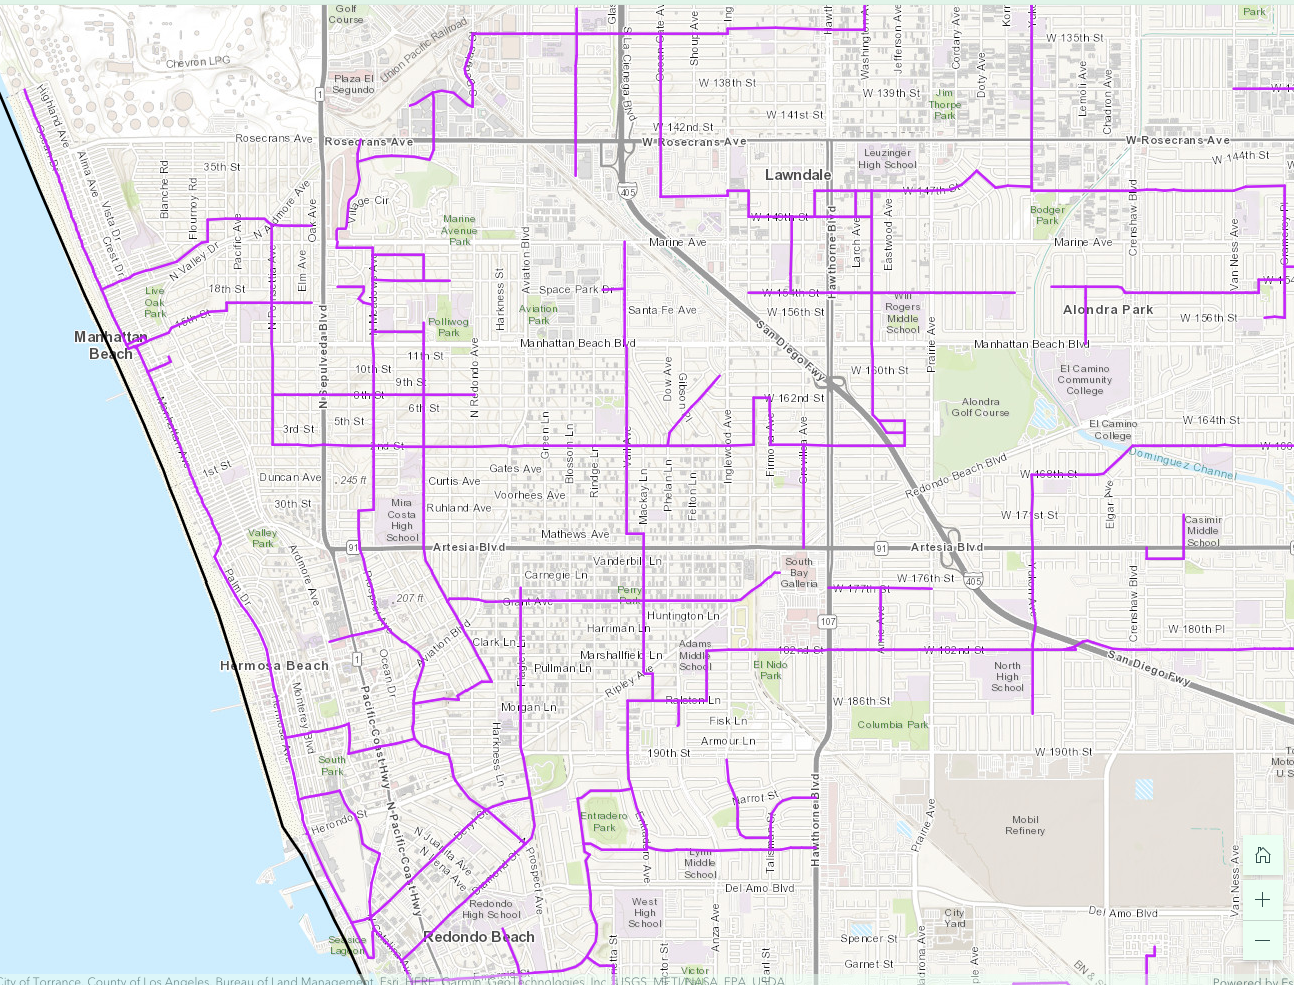
CO2 is 428 ppm in mid-2022.  Here are the existing bike lanes in the Beach Cities. Transportation planners are still expecting people to drive to the beach and ride along the Strand as recreation, not as every day transportation.


Here's the innovation in 2022. Those promised bike lanes will become a Local Travel Network, LTN, suitable for use by all sorts of low-carbon vehicles such as electric golf carts, eBikes, eScooters, motorized wheelchairs, skateboards, etc. They plan to start delivering this network in 2024. Notice how much less ambitious it is than the 2011 plan. It will not include anything other than sharrows and a few beg buttons at existing traffic signals. Unlike the 2011 plan, there will be no new traffic signals to allow cyclists to cross busy arterial streets. 

These purple lines are streets/roads where speed limits are 35 mph or less and are not truck routes. But notice how few of them cross the 405 Freeway or any of the high-traffic arterial roads/state highways. 

Not only are the legal crossings few and far between, necessitating long detours, but some of those purple streets are one-way. Going in the reverse direction will require an even longer detour. I can't make anything this ludicrous up. 

Consider the case of a student in North Redondo Beach who attends Mira Costa High School on an inter-district transfer. (The bus from North RB to RUHS in South RB is jammed and leaves kids stranded at the bus stop. To avoid this, some families beg for an inter-district transfer to the closer MCHS.)

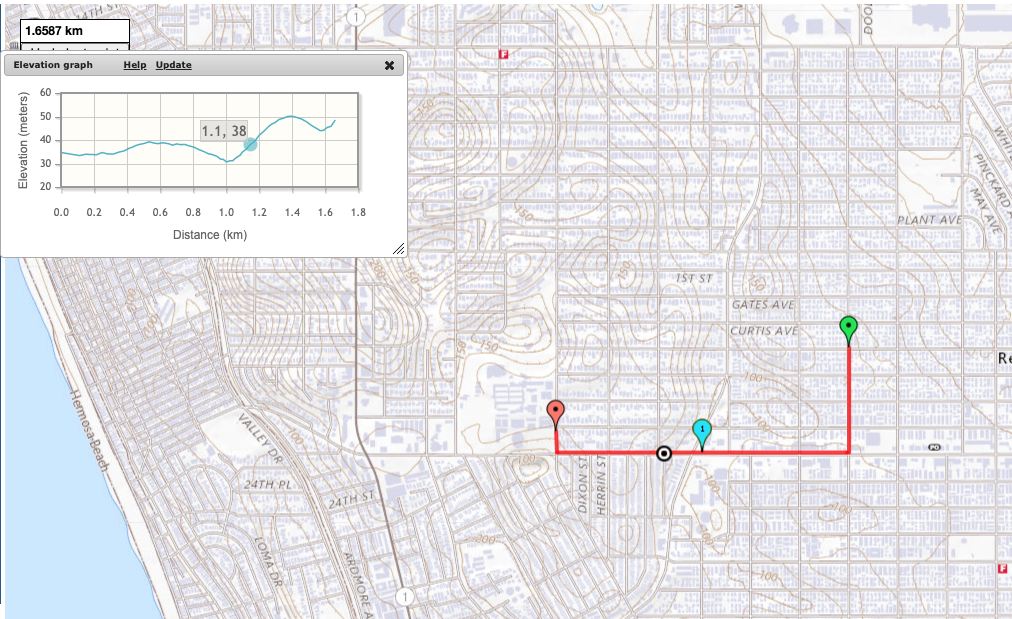
If they had delivered on a bike lane along Artesia Blvd when they repaved it, students could take a direct route with a maximum grade of 5%. Not super pleasant, but doable if you had a protected bike lane.  Of course there is no bike lane of any kind because that would have removed free on-street parking.  Which is more important than our kids' lives and planetary health. 

Direct route: 1.6587 km, max 5% grade

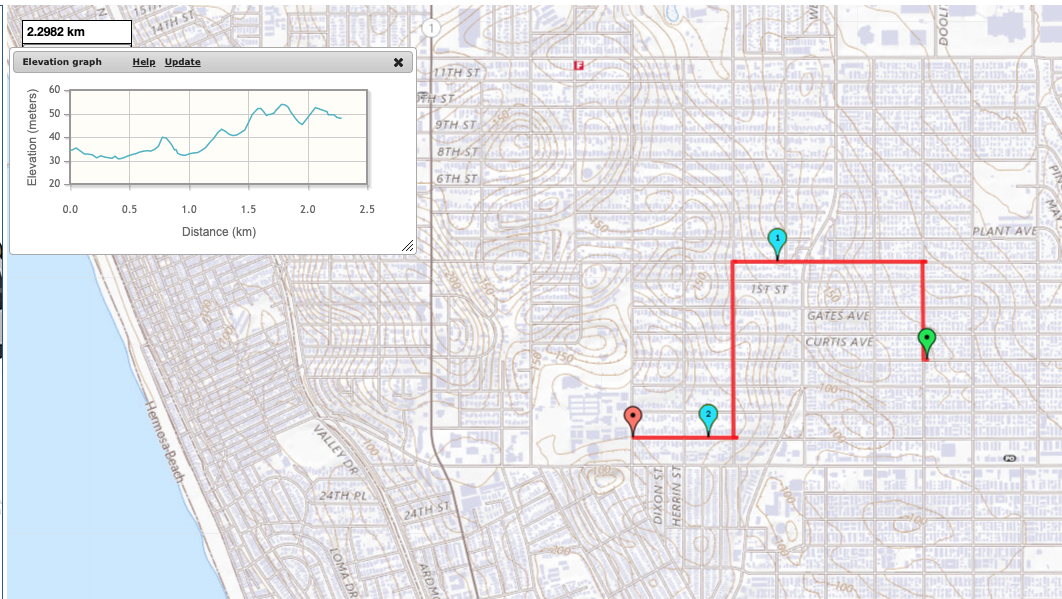
Instead, students must take a roundabout way to an existing traffic light at Robinson/2nd St. 

Westbound detour: 2.2982 km, killer 15% grade short hill

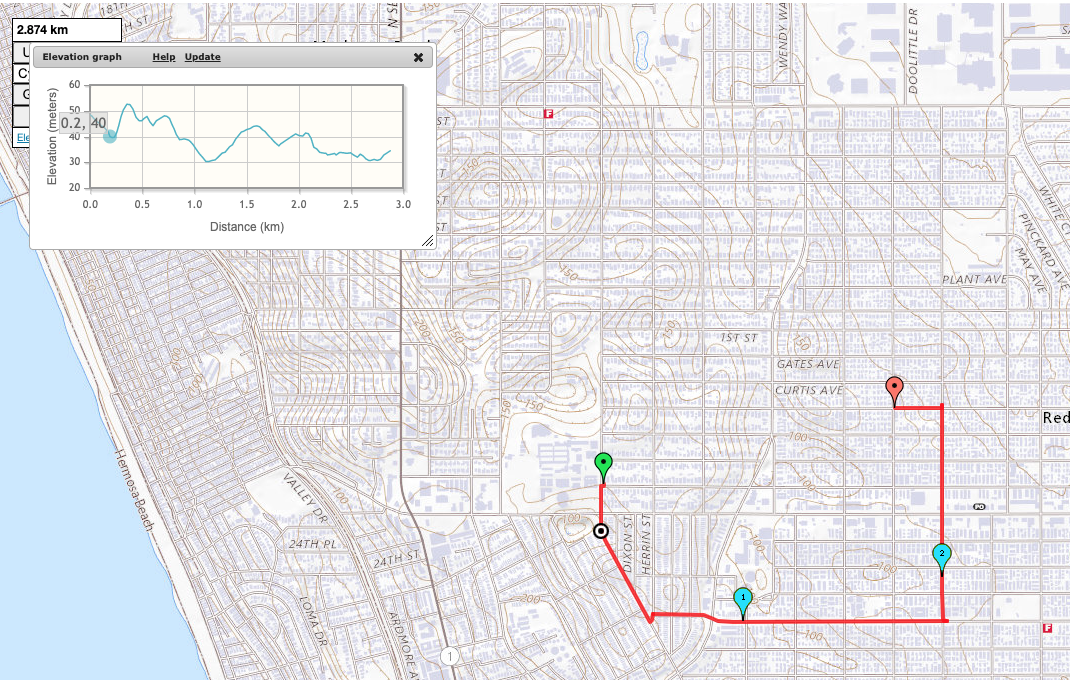
But Robinson is a 1-way street going westbound, and so is Plant, the only other street connected to the east side of that traffic signal. To get home, our student has to take a different detour that crosses Artesia Blvd (CA 91) twice and Aviation at an angled intersection. 

2.874 km, wheelie territory 15+% grade sustained climb

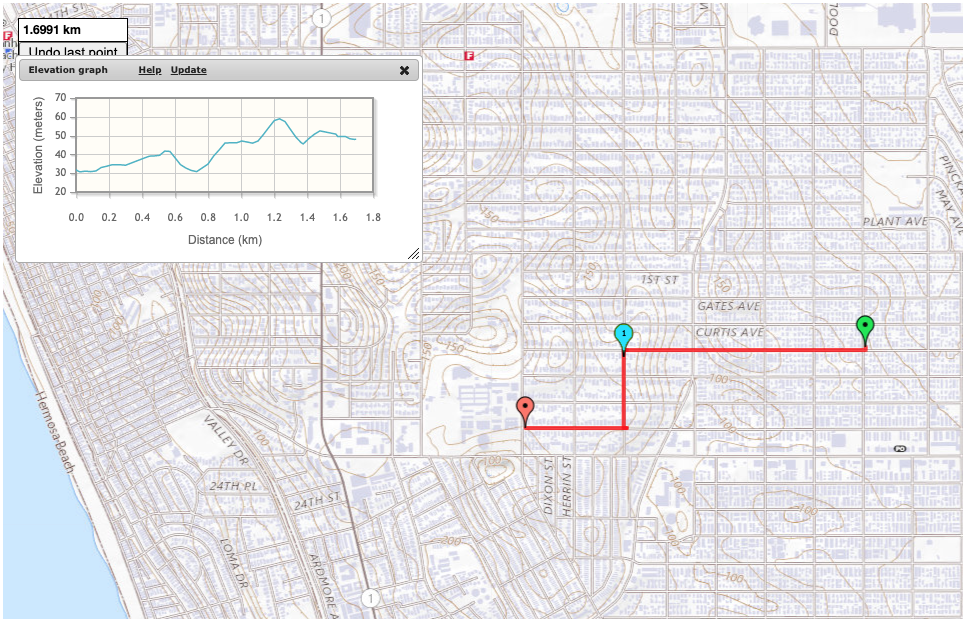
If they had built the 2011 Bicycle Master Plan, with a new traffic signal at Voorhees, our student would have had a reversible direct route. There's a 13% grade climb for half a block. But it's doable with an eBike or a very low gear or if they dismount and walk that section. 

1.6991 km, max 13% grade

(I used mappedometer.com in metric to make calculating grades easier. )

In what world do we expect people in an automobile to take a detour that adds 75% more length to their trip and steepens climbs from 5% to 15% grade? That's just abusive. 

It's late, so I won't dissect why kids are riding eBikes in all sorts of unsafe ways. Spoiler, it's because the streets are hostile and don't allow them to take more direct and safer routes. 

This LTN will not make any difference when completed. 

2024 will look a lot like 2022. Only CO2 will be higher still.  And we'll have more dead kids*. 

* "the crash may have been a result of misaligned crosswalks due to the single diagonal cut handicap ramp, rather than two separate ramps aligned with the crosswalk." 
I have written before about the danger of single diagonal curb cuts.

Tuesday, March 22, 2022

World Water Day 2022: Groundwater

We've circled the sun one more time to another World Water Day. This year, the theme is Groundwater. 

I co-organize a monthly (Zoom) series for the League of Women Voters of Los Angeles County that grew out of a one-time water walking tour I led in the Beach Cities. We record and post all the Water and Infrastructure Group (WIG) lectures along with the slides. Occasionally, I add articles about what we learned or add further information on each month's subject. 


Mr. Matthew Hacker is a registered geologist in California and is currently a Senior Resource Specialist at the Metropolitan Water District of Southern California. He has more than 27 years of experience in water resources planning and local resource development in the areas of groundwater, stormwater, and water recycling. Currently, he is striving to create a more resilient water future for Southern California through innovative new projects such as Metropolitan’s groundbreaking Regional Recycled Water Program. 
His prepared talk is under an hour, half the video is Q and A. 

One fascinating thing I learned is that Metropolitan stores imported river water in the vast LA coastal aquifer. That water we pump out, treat, and deliver to our homes, may have originated in Northern California or Colorado. 

You can learn more about that by watching the Who Fills Your Taps? Video or reading the Who Fills Your Taps? Slide Deck. This is a marathon one that is better ingested in two bites. WIG co-organizer, Kathy Kunysz, is a scientist & planner who has had a long & varied career in water. She knows so much, it's an honor and an education to co-host this series with her. 

Monday, January 03, 2022

Dark Money Greenwash Wokewash

If you consider yourself an environmentalist and live in California, odds are high that your inbox has been bombarded with misinformation from a certain group that purports to speak for small solar rooftop owners combatting climate change. 

They call themselves The Something Rights Alliance.  Notice their rhetoric focuses on Individual Rights vs Collective Responsibilities.  This Libertarian framing is then wokewashed with faux concern for the poor to argue for policies that actively harm the poor. 

This Dark Money group is so effective at Flooding the Zone with Misinformation that I'm not going to name them for fear of their web sniffers and the mobs they unleash. But pay attention to the loaded, emotional language that they use in order to short-circuit critical thinking. 

I've been taking a lot of heat from this group and was going to lie low. But, this morning, I read Skeptics Say, ‘Do Your Own Research.’ It’s Not That Simple. written by Nathan Ballantyne and David Dunning (yes, that Dunning) and decided that I have to speak out against armchair environmentalists and the Dark Money manipulators weaponizing them.

It's bad enough that we are dealing with Covid & Climate Change deniers, but now we have to worry about Regulatory Capture by Big Solar as well? 

Let's start with Dark Money.

“Dark money” refers to spending meant to influence political outcomes where the source of the money is not disclosed. Here’s how dark money makes its way into elections: 
Politically active nonprofits such as 501(c)(4)s are generally under no legal obligation to disclose their donors even if they spend to influence elections. When they choose not to reveal their sources of funding, they are considered dark money groups.

I looked up this group in Charity Navigator to find out more about them. They are unscored because they won't disclose information. Hmmm. Then I looked up their 990s on the IRS website. They reported ZERO income in 2017, the last year 501(c)(4)s were required to disclose their donors in a supplement. New grassroots organizations may start with no money and a bunch of volunteers, then grow slowly (both members and $), but this organization's funds grew overnight and then stayed flat. 
IRS 990 for 2018, showed they went from $0 income to $215,017 income, but did not file a (now purely optional) supplement to show who gave them the money. Meanwhile, the board shuffled a bit, but kept the same executive director. He earns his keep by being very active on the bird app and always in your inbox stoking outrage for Straw Man claims that no one is seriously proposing or considering.
In 2019, they report $215,027 in income and their board changes slightly again with the addition of more minorities to bolster their wokewash credentials.
 

Enough about the Dark Money, let's talk about the lies. I wrote an entire fact sheet debunking the wild things they say in their mass emails. It all sounds so physically plausible, until you pick up a physics textbook and calculator. 

The kerfuffle is over Net Metering, the methodology where we credit rooftop solar owners at retail rates for excess electricity that they export onto the shared grid. It made sense when the goal is to nurture a nascent industry, but it becomes a problem when the industry is mature, per panel costs have come down over 90%, and a lot of homeowners are trying to do the same thing. 

When CA passed the first Net Metering law back in the 1990s, lawmakers were worried about the day when residential rooftop solar would be ubiquitous enough that Net Metering would cause a cost-shift from solar owners to non solar owners.  They wrote in the legislation that they would periodically examine the cost-shift and readjust incentives as necessary. This Dark Money group wants to subvert the law. 

This is further exacerbated by the fact that (with few exceptions) you have to own your home and have enough home equity to swing a loan to install solar panels on the home. Guess who has the money?  It's generally older, wealthier and whiter people than the general population.  Over half of Californians are renters. Add in the people who live in condos/townhomes, whose smaller roof area per resident constrain their ability to generate excess electricity to export. 

According to the vast majority of energy experts in academia, national labs and industry; that cost-shift is happening, costs CA electricity customers without solar over $3 Billion per year (and rapidly climbing), and is a very inefficient way ($ and materials) to decarbonize California's grid.  I'm not going to belabor the points, it's already covered in my Fact Sheet. The main point is that people who have  larger systems, and fewer residents/users, export the most electricity to the grid and benefit the most under the status quo NEM 2.0. 

This Dark Money organization tried to stop the regulatory reform process by claiming it was rigged.  When that failed, they turned to organizing a mob to lobby Governor Newsom to either veto the proposed decision or to appoint new California Public Utilities Commissioners that are friendlier to them. This might work because the CPUC was led by an environmental justice rock star, Martha Guzman Aceves, who has been tapped by the Biden administration to head up the EPA for Region 9, which includes California. 

There will be two openings on the CPUC, so this is where they might actually succeed. The vote is scheduled for January 27, 2022 and there might be new commissioners, or the vote can take place without two stalwart defenders of poorer Californians. This is why I'm writing about it here. I'm hoping you will learn more, and then help vaccinate the population against the lunacy.  They are going to flood the governor and the CPUC with their talking points. So I want to get mine out as well. 

I want to talk about the Straw Man claims vs the actual California Public Utilities Proposed Decision. The Dark Money group is using wildly inflated numbers for the Grid Participation Charge. The math doesn't even work out right on their claims.  If you don't want to read the 204 pages of the Proposed Decision (PD), then at least read the CPUC NEM Fact Sheet: Modernizing California’s Net Energy Metering Program to Meet Our Clean Energy Goals Proposed Decision for Proceeding R.20-08-020. 

Simply put, the Grid is a support system that binds all of us together.  We depend on our neighbors and they depend on us. That is the rationale for the Grid Participation Charge, GPC. 

The Grid is a complex and expensive system to build and maintain.  It's also extremely creaky, with many system components from the Rural Electrification Act era, over 80 years ago. If we are not going to burn coal or fossil gas, for which we already have plants close to the users, then we need to build out a twenty-first century national grid to move renewable energy around from source regions to use regions. 

Transmission losses are inversely proportional to voltage; high-voltage interstate transmission lines that bring New Mexico evening wind energy to Los Angeles can lose as little electricity to transmission loss as from a neighborhood substation to a home in the suburbs (a few % each).  That's all taken into account in the Avoided Costs Calculator that NEM 3.0 uses. 

People without solar pay for the grid through volumetric rates ($ per kWh) and a very daily fee.  Rooftop owners push/export electricity to the grid during midday and then pull/import from after sunset.  They are heavy users of the grid, but their volumetric bill can be effectively zero. So they are not financially supporting the grid even though they are heavily reliant on the grid.

In order to encourage conservation, we set volumetric rates so that, the more you use, the more you pay.  That makes intuitive sense, as long as everyone is paying into it.  But, suppose all the heavy users, who also happen to be the wealthiest, install privatized systems--rooftop solar. With volumetric rates, they buy a lot less electricity, which means the (~9/10) non solar customers have to pick up the slack to support the grid.  

The fewer people paying for the Grid through volumetric rates, they higher the volumetric rate (cost per kilowatt hour) needs to be to pay for the Grid.  Under the current Net Energy Metering 2.0 program, rooftop solar owners get paid the retail rate for electricity they export, which is about 5 times as much as the avoided cost (generally wholesale cost of utility-scale solar plus transmission & reserve capacity).

This retail rates have to go up to cover this overpayment, which then generates even higher payments to the rooftop solar owners.  This is a positive feedback mechanism, also known as a runaway train.

Net Metering Reform is about countering this runaway train effect. 

It's long, it's complex, the ruling (proposed decision) is 204 pages for a reason. But I want to counter two BIG LIES. 

The first is that the Grid Participation Charge will hurt low-income solar owners (or which there are very few).  Nothing could be further from the truth. 

Remember earlier when I explained that the Grid is a social contract?  Well, we acknowledge some people have more needs and less resources than others.  We subsidize the vulnerable.  Low income and disabled people (their entire households) will be exempt from the GPC.  The GPC will phase in slowly over 5 years, with a Market Transition Credit to soften the landing. Low income households will also get the MTC so they will get a negative GPC. 


In contrast, NEM 2.0 is paying low income homeowners with solar LOWER prices than for much wealthier solar owners.  Why? Because low income people pay 18-35% lower retail electricity rates.  So, the wealthier you are, the more you are earning under NEM 2.0. 

The second lie is that the CPUC is doing the bidding of the utility companies and designing NEM reform to kill their competitor, roof top solar.  Utility companies are regulated monopolies. They can wish for the sky, but the CPUC tells makes the rules. 

The CPUC has an obligation to keep the Grid in good working order (capacity and maintenance); ensure a safe, reliable and affordable electricity supply for all users; decarbonize the Grid in a cost-effective way as fast as possible, using roof top solar as one of their many tools; and to sustainably promote roof top solar.  It's a tough balance, which is why they studied the issue for so long, listened to many arguments, examined a lot of data. 

The CPUC isn't trying to kill off an industry they are tasked to support.  They are just trying to do it within the constraints of the other things they must also ensure--like affordable rates and a robust grid for everyone.

The second lie is related to the resilience argument.  Currently, the CPUC and the public who pays for NEM 2.0 has no say in where new rooftop solar is installed and subsidized.  Adoption is much broader in wealthy communities. That leaves a lot of poor communities vulnerable to rolling blackouts and Public Safety Power Shutoffs.  Rooftop solar + batteries/storage help insulate people from power outages. If your community has a lot of solar power, and it is set up to run in island/micro-grid mode, then you may be able to access some intermittent power off the micro-grid. But it's not reliable.

Under NEM 2.0, the resiliency benefits of rooftop solar accrue to the owners, and a little bit to their neighbors.  If you are so worried about access to reliable electricity for the medically fragile in the era of frequent Public Safety Power Shutoffs, why not just give solar systems with batteries for the disabled?  Or build Community Resilience Centers in poor neighborhoods where people can come for air conditioning, electricity, wi-fi, hot showers, etc?

That's the beauty of proposed NEM 3.0.  It would raise and disburse $150 Million each year to fund solar installations with storage (batteries) for those in highest need.  We would swap a horribly inefficient subsidy system, NEM 2.0, for a new subsidy that identifies those in highest need and directs the largest subsides to help them. Disabled people who are on SSI (and their households), regardless of income, will be exempt from the GPCs. 

It's about efficiency with our dollars. It's about directing help to those in need instead of waiting for trickle-down solar to work. It's about helping renters and multi-family residents instead of single family home owners (who have a larger rooftop/person ratio).

Please, please, please, don't feed the outrage machine.  Read the Proposed Decision yourself (the conclusions of law starts on page 175 and the order starts on page 179), or at least the CPUC NEM Fact Sheet


Sunday, April 04, 2021

LTN: One possible solution to decarbonizing transportation

Bad Dad and I were featured in A Local Travel Network for the South Bay Story Map* riding my Ebike and an Escooter we bought for combining with transit just before the March 2020 lockdown.


Click through to see the full wide picture that also includes a BMW electric car.  I have mixed feelings about this project.  I think it is a reasonable baby step, but the South Bay Cities Council of Governments does not appear inclined to offer more than sharrows.  In fact, their South Bay Bicycling Master Plan counts roads with 50+ mph traffic and a sign on the shoulder saying it is a bike route as a bikeway.

The Story Map makes some good points about the South Bay region of Los Angeles County.  This area is home to roughly 1 Million people and 750,000 cars.


70% of South Bay trips are less than 3 miles, yet we do most of them by car. It's both a problem of habit and the built environment. We don't provide safe spaces for people out of cars, so people make trips in cars, even if they would prefer to do otherwise. Spend some time exploring pedestrian and cyclist data using UC Berkeley's Transportation Injury Mapping System


In 2009-2020, there were 100,000 collisions involving pedestrians and cyclists, including ~3100 deaths,  in Los Angeles County.


This is just the people that braved the streets outside of cars. This doesn't even represent the suppressed active tranportation trips that people took in cars or forwent out of (quite rational) fear.

I'll take allies where I find them.  I am accepting the LTN (if they actually build it) as a down payment, but not as payment in full, for the safe streets that we deserve and need as we decarbonize local transportation.

* We were told to be near the intersection of Pacific and 10th street in Manhattan Beach, CA one Saturday morning to film.  We bike through that area on our way to the beach several times a week.  It's one of the most expensive neighborhoods in the region.  The organizer wanted a quintessential South Bay setting with the ocean.  But, I would not have selected a neighborhood that aggressively protects Single Family Home Zoning to preserve the affordability of $30,000,000 ($30 Million) dollar homes.  We have to quit showing SFHs as if they are normal or representative. Nothing could be further from the truth.

Friday, April 02, 2021

Batteries don't grow on trees

This video came across my Twitter timeline and I retweeted it. Rice geophysics professor Cin-Ty Lee explains why nickel and cobalt laterites are found in the areas where biodiversity is greatest. It's pretty heartbreaking.


I knew that batteries were very toxic, and that the Cobalt used in them came from DRC*, often using slave or child labor, but I had believed the stories that alternate sources of Cobalt had been found and that would be a nonissue as soon as the alternate sources came online. 

Professor Lee's video made me realize that the most economically viable Cobalt deposits are all in the tropics: Congo, Papua New Guinea and Queensland, Australia.  You reach the deposits either by strip mining in tropical highlands, or mining the oceans.


If you are in the "green-industrial complex" and need to calculate your client's carbon footprint, you end up having to sum the carbon from battery production with the savings that the battery enables.  If battery production includes the carbon released from strip mining tropical rainforests to mine the ore, the potential carbon savings plummets.

I found an open access journal about the Life cycle assessment of cobalt extraction process that gave a picture of the tradeoffs.  Eutrophication means adding nitrogen and silt to waterways from the strip mining.

Highlights

  • The life cycle assessment of the cobalt extraction route is carried out.
  • Blasting and electricity consumption in cobalt mining is damaging to the environment.
  • Eutrophication and global warming are the most affected impact categories.
  • Carbon dioxide and nitrogen dioxide emission are highest from cobalt mining.
  • Alternative energy sources for electricity generation would enhance sustainability.
One way to avoid destroying tropical rainforests to mine ore is to source your ore from the ocean floor.  I found other articles such as, Deep-ocean polymetallic nodules as a resource for critical materials, that show the potential of deep ocean mining metals used in batteries.  You may not release carbon by cutting down tropical rainforests, but you will make the fishing and tourism industries and coral reef ecologists very angry.  You'll also destroy ocean ecology.  Pesky tradeoffs!

Right now, we're in the battery build up phase.  Eventually, we'll have enough that we can keep recycling them, much as we do for lead-acid batteries.  This will end the destruction caused by mining, but cause other problems.

I did a little research to wrap my head around how much we are talking about.

Lithium-metal batteries are about 10-20% cobalt chemistry, but that includes water, so it's about 1-2% Cobalt by weight.

Teslas have 1060-1200 pounds of batteries or about 55-85 kWh (kiloWatt hours)
The new eHummer has 200 kWh
My Ebike has 0.5 kWh
My Escooter has 0.3 kWh**

Electric cars have 100-500x the batteries and toxicity of Ebikes/Etrikes/Escooters. They are also very very spatially inefficient with road space and urban space (parking).  For rural areas where space is not a problem and distances are large, they make sense.  For the 90+% of Californians and Angelenos living in urban spaces, they are a last solution, not a first solution.

I Ebike about 50 miles on the charge used to move a Tesla X just 1 mile.  Do we really need to move a 4000# car with an additional 1000# of batteries to move one person plus groceries?  I can carry 5 days worth of groceries for 3 on my Ebike without a backpack.  I could probably carry 7 days worth with a backpack, but why bother?

This is why I don't support strongly support electric cars, trucks and buses alone.

We have to get out of single occupancy cars as much as possible, especially in the urbanized areas.

We need to decarbonize transportation using every tool, starting with right-sizing the vehicles for the task.  

We need to use road space more efficiently, which means remodeling our urban environments to make better use of transit and active modes (walking/cycling). 

There is no time to waste.  

We need to do it all at once.

Further reading:


* Just because you rebrand a county from Congo to the Democratic Republic of Congo, doesn't automatically make it so. I refuse to use the Newspeak name.


** A research paper showed the CO2 per passenger-mile for a bunch of different transport modes and the statistic that caught all the media editors' clickbait attention was that shared electric scooters are inefficient.  They are inefficient due to their short lifespans (people trash them) and miles driven in cars by the people who hunt them down, recharge them and restock them.  


A subsequent study showed that privately-owned Escooters are almost as efficient as Ebikes, which are almost as efficient as regular bikes-the most efficient mode of travel ever invented.


Monday, March 29, 2021

Plastic

I vent sometimes on Twitter. Earlier this month, I ran a Twitter poll and learned how hard it is to write an unambiguous multiple choice question.


Is plastic petroleum?

Of the 164 votes, 

  • 72.6% chose "Yes, duh"
  • 3% chose "No"
  • 4.3% chose "Don't know"
  • 20.1% chose "Not enough info to answer"
It's a good thing that I don't have to come up with a grading rubric for this question because you can make a valid argument that any of the choices are correct. 

I started to write an explanation for the answer, but it became quite a long thread.  Since it took so much research and time, it deserves to be put up on the blog.

Until 2 years ago, I didn’t know that materials scientists consider plastic a property instead of a material. You can make plastic from all sorts of polymers that are soft when warm and rigid when cooled. Eg potato starch plastic. 2/ 

Most plastics used in the world are made from fossil hydrocarbons, typically ethane. It used to be made mainly from petroleum distillates but is now often made from fossil gas aka natural gas. 3/ 

Worldwide, plastics use is increasing alarmingly. We should question whether we really need to consume so much. But, in the US, our car dependence is a much, much bigger problem. Landfilled plastics are sequestered. Gas tank hydrocarbons get burned and add CO2 to the atmosphere 4/ 

4/ Quote Tweeted this AirQ thread about how CO2 is lower on weekends because people drive less.


I’m not a big plastic user and live in a community that supports reduce, reuse, recycling. Angelenos produce much less garbage than US avg. Many areas, including mine, haul away yard and kitchen waste for industrial composting. Our recyclables are collected, sorted and recycled 5/ 

The rest of our trash is incinerated at SERRF on Terminal Island, Long Beach. It generates electricity for SERRF and feeds the grid. The ports of LA/LB use a lot of electricity 24/7 so this is synergistic. My city diverts 74% of waste (typical for LA County) and burns the remaining 26% 6/ 

(Our regional solid waste stream is also smaller than the US avg due to state/local government policy choices. Our family also made lifestyle adjustments to reduce it even further. The main driver is that government policies support solid waste reduction.)

I’m still using a roll of Saran Wrap purchased 10 years ago. I used Parafilm in lab when I needed it. I have zero guilt about using plastic when I need it. Right now, my trash is full of takeout containers from local restaurants that need our support during the pandemic 7/ 

Try to reduce single-use plastics in your day to day life as much as you can. Carry that refillable water bottle daily, but keep a case of water bottles in your earthquake kit. The American Chemical Society devoted a special issue to plastics recycling 8/ 

In short, mechanical plastics recycling chops up the long-chain polymers and weakens plastic. So, the current methods of plastics recycling, where new and old plastics are mixed together, is not closed loop or sustainable. Eventually, the plastic will be too weak to do its job of holding stuff. You don't want a container that breaks unpredictably.
THE DYSFUNCTION OF PLASTICS RECYCLING Plastics recycling, as it exists today, is a mess. In 2015, the US recycled only 9.1% of the 31 million t of plastics that consumers threw out, according to the Environmental Protection Agency. The vast majority ended up in either landfills or incinerators. In contrast, two-thirds of paper, a third of metals, and a quarter of glass were recycled that year. In the European Union, about 14.8% of the roughly 27 million t of plastic waste was recycled in 2016, according to the European Commission.
But, there's active research into using enzymes to break down plastic back to its pre-polymerized raw feedstock shape. About 40% of it will remain, but it can be turned into low-sulfur diesel fuel--not a bad fuel for long distance trucking or ocean-going cargo ships which operate away from urban areas. 

One of my husband’s former classmates at MIT is working on enzymatic fuel production from plastics and agricultural waste. I am optimistic about the technology, though it is still too expensive. 9/ 

Driving an ICE car is single use petroleum. Using plastic, even if it is incinerated after 1 use, gets 2 uses out of the material. If it is landfilled, it is at least sequestered vs burned and released into the atmosphere 10/

Gasoline accounts for 45% of US petroleum use while all chemical feedstocks (paint, solvents, cleaners, pharmaceuticals, plastics) account for 1.5% https://eia.gov/energyexplained/oil-and-petroleum-products/use-of-oil.php 11/


In summary, that smarty pants state senator is operating on old information. Plastics are made from a variety of sources & petroleum is one of the top 2. Plastics in waterways is a problem, but tire particles are the overwhelmingly major source 12/ 

[oops, I skipped 13/]

EVs, because of their weight, increases tire wear, exacerbating water and air pollution https://greencarreports.com/news/1127424_study-particulate-emissions-from-tire-wear-is-higher-than-from-tailpipes 14/ 

I wrote a detailed blog post about this 15/ Leaf blowers, street sweeping, car tires, fish and you

“Non-exhaust emissions...are currently believed to constitute the majority of primary particulate matter from road transport: 60% of PM2.5 and 73% of PM10.” https://tiretechnologyinternational.com/news/regulations/pollution-from-tire-wear-1000-times-worse-than-exhaust-emissions.html 16/

Under-inflated tires are a huge contributor to tire particles. Remember the Ford Explorer rollover scandal? SUVs are top heavy. To reduce rollover risk, they use special tires that don’t burst when inflated much lower than passenger car tires 17/ 

SUVs and pickups need larger tires, often at lower pressures, so they don’t roll over. Want to know why our regional PM 2.5 just keeps increasing? The answer is almost always cars, especially SUVs. Electric SUVs are greenwash. Electric bikes/trikes in every garage instead 18/fin

I'm not the only one who sees EV-only approaches without remaking our streets to help us move out of cars as greenwash. 

Tackling the climate and air pollution crises requires curbing all motorised transport, particularly private cars, as quickly as possible. Focusing solely on electric vehicles is slowing down the race to zero emissions. 
Only getting out of cars will solve the urban particulate air pollution, road congestion and parking/land use problems. I said URBAN. Rural areas have different problems and different solutions. But, since California is the most urbanized of all US states and Los Angeles is among the most urbanized of all CA and US counties, this is what we need to do right here, right now, where I live. 

10 Million people live in Los Angeles County, 5.6x as many people as Idaho. So I don't want to hear any critiques along the lines of this will not work in Boise or on my Montana ranch. The Netherlands has a bike culture with just 511 people per square kilometer vs 905 for Los Angeles County. 

Sure, NL is flat and LA is surrounded by steep mountains. But that also means we live more densely because most of us live in the flatter broad valleys and coastal plains. Ebikes flatten the hills anyway.  It sure does rain a lot more in NL, though.

Followup 10/1/21 
The US Department of Energy, who runs the National Renewable Energy Laboratory, started a new program to fund research in chemical recycling of plastics.

Thursday, January 30, 2020

Data-Driven Climate Action

I gave an overview talk last Saturday at the League of Women Voters of Los Angeles County Winter League Day. I was the lead batter for a panel discussing the most impactful climate actions we can do in Los Angeles County right now. Enjoy.


I want to convey the seriousness and urgency of this moment, but not induce panic or hopelessness. Whether we constrain Climate Change (CC) at the optimistic 1.5 C or the business as usual 3.5 C, we can still make positive changes that will benefit our region.

CC is happening. We are the cause. This is not up for debate any longer. We cannot undo the damage that has already occurred, but it is not too late to act.

I’m going to take a speed tour of the impacts of CC on our region.
Then we’ll examine our Greenhouse Gas (GHG) emissions and where we can make the greatest reductions.


Terminology: Science speak to English translation
Climate: what you expect
Weather: what you get (short-term fluctuations)
Normal: average over 30 years of statistics, recomputed on the 10s, eg 1981-2010
We’ve already warmed 0.8 C over what would have happened if we hadn’t spewed so much CO2 & the rate is accelerating and the warming is not uniform over the earth.


This is not a model prediction. This is the actual warming we’ve experienced over the last 30 years. U of AK climatologist Brian Brettscheider had the insight that, at the end of this year, we will compute the normals again by subtracting the average over the eighties (the decade of 1981-1990) and adding the 2010s (2011-2020). He took an early look using the first 9 yrs of the 2010s. 2011-2019 - (1981-1990)
The earth has warmed 0.8 C since 1850, but roughly 0.5 C took place in the last 30 yrs. (Climatologists use a longer time average so the results may vary slightly. Nevertheless, 0.5 C warming over 30 years is very dramatic and scary.)


Here’s a closeup. Although we’ve only warmed up about 1 C, the areas from which we draw our water have warmed up to 4 C.


I cribbed this from LAC’s sustainability plan that Kristen Torres Pawling will talk about later. Our County imports river water from the Sacramento-San Joaquin Delta & the CO river basin through Metropolitan Water District. LA City also imports water from the Owens Valley in the southern Sierras through DWP. This is not sustainable or just, even without climate change.


Now I will show a climate projection of likely precipitation changes. Keep in mind that, for every 1 C of warming, the atmosphere can hold 7% more water. Air, plants and soil become thirstier. We’ll also have less frequent rain, especially in the springtime, which leads to longer fire seasons.

What rain we do get, will come in more intense storms, which will make managing runoff more difficult. Less water will wind up in the rivers. Wildlife will need more water to stay cool on a warmer earth. The CO river basin has already dried up 20% since the 1980s and will continue to dry up. Some estimate the flow will reduce to half by the end of this century. Furthermore, federal courts have affirmed that roughly 20% of the CO river water were awarded by treaty to sovereign tribes.


I’ve shown you water scarcity, now I’m going to show water overabundance. Luckily, our region is not prone to hurricanes. But we need to prepare for stronger atmospheric rivers that persist over small areas for longer times. That’s due to irreversible changes in the jet stream due to polar ice cap melting. Notice this brown dot near the Oroville dam breach and Reno’s catastrophic flooding.


Then there is sea level rise. Our sea ports move 40% of our nation’s container ship volume, and much of it will be underwater in the medium CC scenario. Even areas that are above the rising seas will still be affected by sunny day flooding and salt water intrusion into aquifers, thus threatening our local water supplies.

Water insecurity--too much or too little--and the nexus between energy and water, is a huge concern and I hope to hold a future meeting around that.


Longer dry seasons will stretch the fire season. Changes to the jet stream will make Santa Anas more frequent and longer in duration. This leads to increased fire danger and air pollution build up.

To an atmospheric scientist, the pretty sunset in the title slide shows several days’ worth of pollution, stacked up like bathtub rings against the atmospheric lid of a wintertime inversion layer.

Now that I’ve scared you, let’s transition to problem solving.


We’ll start by examining our county’s GHG emissions. We need to bring down our emissions budget down by about half overall. We’re an urban area so there isn’t much direct agricultural emissions. Transportation, ⅔ of which is private automobiles, is the 800# gorilla. If you add up the oil refineries in the energy industries slice, transportation accounts for over half of our GHG emissions. There is simply no way to to achieve a stable and livable climate without drastically reducing our transportation emissions.

California overall is similar with 41% of 2017 GHG emissions from transportation.  It's frustrating that so much attention is paid to electricity generation, which only releases 15% of our GHG total budget, and yet we ignore the elephant in the room.


Responsibility for climate change is highly unequal. I’m showing Rancho Sante Fe (in San Diego County) because I didn’t want to single out any LA County cities. This is a map by household size, not per capita emissions. These green areas in the urban core often have the highest HH size as families struggle to make rent in overcrowded apartments, so the per capita inequality is even more stark. We can choose to eat less meat and better insulate our homes on our own, but the really meaningful change in transportation requires collective action.


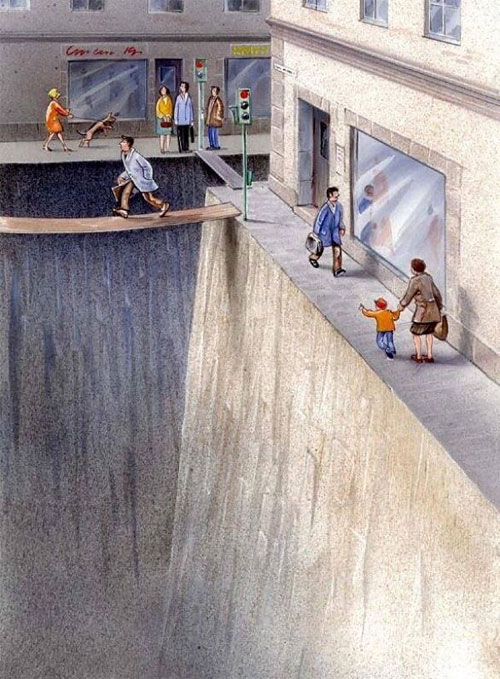
There’s simply a geometry problem in our streets. We give the most space to the most inefficient form of transportation. We let buses holding 80 people sit in traffic behind cars holding an average of 1 person each. We even let people store personal property, in the form of cars, on the streets. Often for free! Then we tell bicyclists to get off the road because there is no room for them.


Parking is another geometry problem. It’s also a chicken and egg problem. The more hellish we make it for people outside of cars, the more we push people into cars. Then we need more space to put those cars. Parking minimums for apartments have doubled from 1 to 2 spaces since 1960, raising housing costs. (Data from Mikhail Chester, Andrew Fraser, Juan Matute, Carolyn Flower, and Ram Pendyala
Parking Infrastructure: A Constraint on or Opportunity for Urban Redevelopment? A Study of Los Angeles County Parking Supply and Growth
Journal of the American Planning Association, 2015, 81(4), pp. 268-286, doi: 10.1080/01944363.2015.1092879)


Look at this lovely mid-Wilshire area apartment building that is not legal to build today.


Parking pushes us apart, making travel distances longer. Buses are slow because they are impeded by cars. Give buses dedicated bus lanes and they can beat private cars. It’s cheap, too. If you speed a city bus up from 9 to 18 mph, you double bus frequency with no additional drivers and buses. All it takes is some paint and enforcement.

Some people say that our region is too spread out for bikes. Traffic congestion and parking time make bikes faster for short trips. Longer trips can be combined with transit. Increasing density along transit corridors so people can live full lives with fewer cars is working around the world and it can work here, too.


Take it from decarbonization expert and CMU professor, Costa Samaras. eBikes are the future. While his research shows that an electric car has ½ the CO2 emissions of an Internal Combustion Engine (ICE) one, an eBike beats both.


I can eBike 50-100 miles with the energy it takes to move a Tesla just 1 mile. Factor in parking time, and eBikes beat cars, even on a normal afternoon on the 405. BTW, cars are a leading source of urban heat. Add the concrete needed to support cars and they are the leading cause of urban heat. The background is the August 2019 SoCal air quality maps from airnow.gov, an EPA website.


In summary, decarbonizing transportation has the highest potential for stopping CC, but it requires collective action. We can’t choose to bike along a street that doesn’t create a safe space for us or take a bus to an evening concert if the buses don’t operate at night. An urban area is precisely where these two modes can excel, if we let them. We don’t need a solution that works in Iowa or New Hampshire or even Fresno. We have the existing density and the weather to do this right here, right now. Let’s paint those streets Green & Red.

Transportation Actions Now

  • Make driving alone the last, not first resort.
  • Reallocate road space from cars (especially on-street parking along arterials)
  • Bike lanes network
  • Bus lanes network
  • Smaller, more efficient cars (both in space and GHG)
  • Vision Zero like you mean it

Housing Actions Now

Help climate refugees...
  • …move closer to work so they can get out of cars
  • …move out of fire corridors & landslide zones
  • …move out of low-lying coastal zones & flood plains
  • …move to cooler microclimates near the coast
and
  • Reduce parking minimums
  • Support laws that speed up housing production (SB 50)

Water Actions Now

  • Educate your communities about the risk
  • Prepare for loss of imported river water
  • Build stormwater capture projects
  • Continue conservation (but diminishing returns)
  • Expand water recycling; legalize potable reuse
  • Consider desalination

Climate Takeaways

  • Move fast, with existing technology
  • Continue research, but don’t fixate on shiny vaporware
  • Don’t replace one injustice with another
Taking climate action now can result in
  • Cleaner air and water
  • Better mobility and public health
  • A more just and cohesive society

Monday, November 04, 2019

Fashionopolis

I read an Advance Reader Copy (ARC) of Fashionopolis: The Price of Fast Fashion and the Future of Clothes by Dana Thomas. If I were a better advance reader, I would time this to come out the week of publication, around September 3, 2019.  But, I wrote it in July, when I read the book, and then set it aside due to anger.  In November, I decided to finish it up and post my thoughts.

This is not an expose about huge Fast Fashion chains that serve the mass market.  Lucy Siegle of the Guardian does an excellent job covering that beat.

Ms Thomas covers the business of fashion and she has fantastic industry access.  I read and blogged about her earlier book, Deluxe, which covers the luxury end of the market. This time, she writes about the Price of Furious Fashion.  Her publisher categorizes the book under: Business, Design, Technology.

It's a good survey of the history of fashion production and the current toll that it takes.  However, the book shines when Thomas takes deep dives with makers that show how to make clothing with smaller environmental footprints.

For instance, I have made my skepticism about organic cotton known.  But, I learned that naturally-colored Foxfibre is also naturally insect-resistant.  The Tannins that give the cotton color, are bitter; insects don't like to eat them.

I don't like the reductive way that Thomas segments the market into organic and "all the rest."  She covers the business of fashion, but she's not a scientist nor was there any evidence in the book that she spent time interviewing scientists.

For instance, Stella McCartney's Environmental Profit and Loss (EP&L) showed that virgin cashmere had roughly one hundred times the environmental impact of virgin wool (page 167).  Therefore, Stella McCartney does not use virgin cashmere in her collections.

How do you put a number on the destruction of an irreplaceable ecosystem I wrote about in The planetary cost of cashmere? Of the extinction of snow leopards in More bad news about cashmere.

McCartney hired a sustainability and ethical trade chief, Claire Bergkamp.  Bergkamp, in turn, hired the accounting firm, PriceWaterhouseCoopers, to audit her business (EP&L.) Accountants do what they do-- place numerical values on stuff.  At the end of the day, the numbers contain the biases of the makers of the model.

The numbers are maddeningly opaque and McCartney, Bergkamp and Thomas felt no need to look under the hood to find how those numbers are derived.  To a scientist, that's very disappointing.

On page 169, we learn that McCartney's EP&L determines that regenerated or 'reclaimed' cashmere is 92% less damaging to the environment than virgin cashmere.  She calls it postmanufacturing waste.  (I call it preconsumer waste and use it for more than half my sewing.)

This allows Bergkamp to throw around numbers like "though cashmere only made up 0.13% of [Stella McCartney's] overall raw material usage in 2015, it accounted for 25% of the company's total environmental impact; after adopting the use of regenerated cashmere in 2016, the impact dropped to 2 percent."

"Luxury fashion should use organic cotton--I don't think there is any excuse not to," said Bergkamp.

You get the idea.  Thomas takes so many claims at face value, particularly regarding natural vs. synthetic dyes and vegan vs. animal materials.

The book is a good survey on what people are trying, particularly at the luxury end of the market. Don't believe any of the scientific claims.  There is no guarantee that nonfiction books were fact-checked.  How do you fact-check a closely-held proprietary EP&L system anyway?

Saturday, November 02, 2019

Car tires, a bigger threat than polyester blouses

I sound like a broken record, but the culprit is almost always cars.

Cars are a death cult. They cause most of our air and water pollution, green house gas emissions, and consume most of the land in the cities with their voracious appetite for parking spaces and road space.

In Heavy Metal in LA, I explained that the biggest source of heavy metal contamination in Los Angeles waters is cars.  Now we learn that cars are the biggest source of microplastics in the San Francisco Bay Area. The biggest likely source of microplastics in California coastal waters? Our car tires
Cars driving over Golden Gate Bridge photo from LA Times
Sewists can quit obsessing over polyester use.  The much bigger problem is all of our cars.
Rainfall washes more than 7 trillion pieces of microplastics, much of it tire particles left behind on streets, into San Francisco Bay each year — an amount 300 times greater than what comes from microfibers washing off polyester clothes, microbeads from beauty products and the many other plastics washing down our sinks and sewers.
I downloaded and read the SFEI report, Understanding Microplastic Levels, Pathways, and Transport in the San Francisco Bay Region.

The methodology section starts on page 30. They collected and sieved microparticles from storm runoff, sewage treatment plants and sediment.  Then they sieved again and again to separate out particles by size.

Particles were further sorted by color, shape and appearance.  Finally, the material composition of 7% of the microparticles were determined by Raman and FTIR spectroscopy.  Not all microparticles were plastics.  E.g. some were glass or organic materials.

Particles found in this study
The most astonishing finding was the abundance of black, rubbery fragments.
A total of 171 microparticles were classified as unknown potentially rubber, which represents 84% of black, rubbery fragments that were analyzed by spectroscopy, or 44% of all fragments analyzed (21% of all particles analyzed). Only one site, Rodeo Creek (a mostly rural site), had zero rubbery fragments.
The discussion explains why they are sure that the black rubbery fragments are tire wear.  They also summarize findings about the prevalence and abundance of tire wear in the environment by other researchers starting on page 55.

I suspect that the results would be the same if the expensive and laborious study was repeated in Los Angeles.

Don't feel bad if you wear polyester blouses or fleece jackets instead of exclusively natural fibers.  Just wash them in the coolest water that still gets them clean, air-dry them, and walk/bike/transit instead of driving.

Those are choices that really matter.

Related Posts: