Thursday, March 31, 2022

Diagonal Single Curb Cuts: I don't care if you live or die

I was walking home from the library and thinking about all the ways that my city doesn't prioritize people trying to make trips without cars.  

Behold, the Single Curb Cut, set at 45 Degrees (on the diagonal) with respect to the crosswalks. It's hard to see underneath the car blocking the crosswalk.


Here's the view after the car made a right turn right in front of me as I approached the crossing. If I were in a wheelchair, or using a walker or shopping (granny) cart to get to the grocery store on the other side of the crosswalk, I would have to step out of the marked crosswalk, make a 45 degree turn to the left, cross in the sidewalk, then pull out into traffic again to go up the other diagonal ramp. 


Notice the dark stain at the foot of the ramp? That's the damp spot left after the recent rain because the Diagonal ramp cut is a gravitational well at the intersection of two crowned roads. People who roll things will always be directed into a puddle with these kinds of curb cuts. 


Imagine yourself in a wheelchair, trying to roll to the grocery store. You have to turn, roll yourself diagonally into the street, slowing yourself down so you don't roll off the sidewalk into speeding traffic.  After you stop yourself, you need to make a sharp turn to get into the crosswalk, then roll outside the crosswalk to approach the diagonal curb cut. 

Turning slows you down, so you could be at a near dead stop. To get back onto the sidewalk, you have to push uphill starting from a dead stop in a low point. Now imagine yourself coming home from the grocery store, laden with food.  Do that in reverse with the extra weight. 

At this intersection, there isn't even a marked crosswalk in the other direction; why direct the ramp towards the middle of the arterial intersection? Omission of a marked crosswalk and a traffic signal across this 35 mph arterial road (40,000 vehicles/day) means you want to suppress people from walking across the arterial at this intersection.  You've already decided to pay for only a single curb cut. So why not align it with the marked crosswalk? 

Wednesday, March 30, 2022

CA Car Rebates and Our Underfunded Active Transportation Program

There's been much hoopla about California's budget surplus and high gasoline prices. So why not use some of that surplus to alleviate pain at the pump? That may be good political messaging when the impetus is the much more mundane Gann Limit on CA public spending. The ghost of Howard Jarvis strikes again. Not content to limit just property taxes, they sponsored and got the electorate to approve caps on overall spending that limit public investment overall.

I don't want to belabor the stupidity of giving people who own cars $400 per car, up to $800 per person, while not similarly rewarding people who are either too poor to own cars and/or care enough about the common good to not own a private car in the first place.

In a world without all the stupid laws that we inherited, we could have fully funded our Active Transportation Program (ATP) to increase the proportion of trips accomplished by biking and walking.  The majority of ATP-funded projects are Safe Routes to Schools--to help children get safely to and from school. Basically, we need to protect kids outside of cars from the cars chauffeuring them around. 

Because of limited funding, ATP grants are extremely competitive

In 2014, cities and counties across the state requested about $1 billion in funding for pedestrian and bicycle safety projects, but there was only $368 million available, meaning about 37 percent of applicants were funded that cycle. Fast forward to Cycle 5 in 2020 when over $2.5 billion in funding requests were submitted for $554 million in available funding, a success rate of about 22 percent. In Los Angeles County, only 14 of 64 applications were awarded even partial funding, or 22 percent total – demoralizing, yet consistent with the statewide average.


The 2023-24 ATP budget is even grimmer. ATP has $147,670,000 to spend that is not already committed to other projects. That means, the 6-county SCAG region of 20 M people (including LA County, has only $31,242,000 or about $1.50/resident. 

In contrast, Governor Newsom's proposed 5-year infrastructure plan will devote $10 B to electric cars and $20 B for roads, roughly $5 B/year (pages 7-8).  This isn't even counting the $ spent on CHP and traffic enforcement. Due to the Gann limit, every $ spent in one place is a $ we can't spend somewhere else. This is extremely discouraging. 

In the mean time, we depend on volunteers and advocates such as Safe Routes Partnership to help communities hone their proposals to improve their odds of winning an ATP grant. "In ATP Cycle 5, four out of the five communities we worked with scored an 86/100 or above." In other words, communities can compete to get technical help to further compete to get funds to improve street safety for school children. 

My community finally won an ATP grant, but the funds allotted are well short of what we really need to remodel our streets.  We're likely to end up with some paint and street signs. Sigh. 

We have so much work to do. Spend some time exploring the California ATP Transportation Injury Mapping System.  (You need to register to create a free account, but it's worth it. UC Berkeley researchers built the system and don't do anything nefarious with your search terms.)

Here's a heat map of the 2017-2021 carnage. 


People who live in the neighborhoods with the larges blotches of red are least likely to own a car but most likely to be killed or maimed by one.  In Los Angeles County, over 5 years, 173 cyclists dead, 1323 pedestrians dead, thousands more injured and maimed. Their lives will forever be marked by pain and disability. (I'm not even counting the effect of air pollution in their neighborhoods.)


The Gann Limit requires CA to give out rebates. I wish that the rebates be used for restorative justice instead of rewarding people for owning cars. Who's with me?


Tuesday, March 29, 2022

Article 34, AFFH, Land Use and Climate Change

 Following up on How Mixed Income Cross Subsidies Work  

In 1950, California voters passed Proposition 10 that became Article 34 of our state constitution which bans construction of publicly-financed low-income housing unless a majority of voters approve.

Guess how many were approved in higher income, whiter areas? 

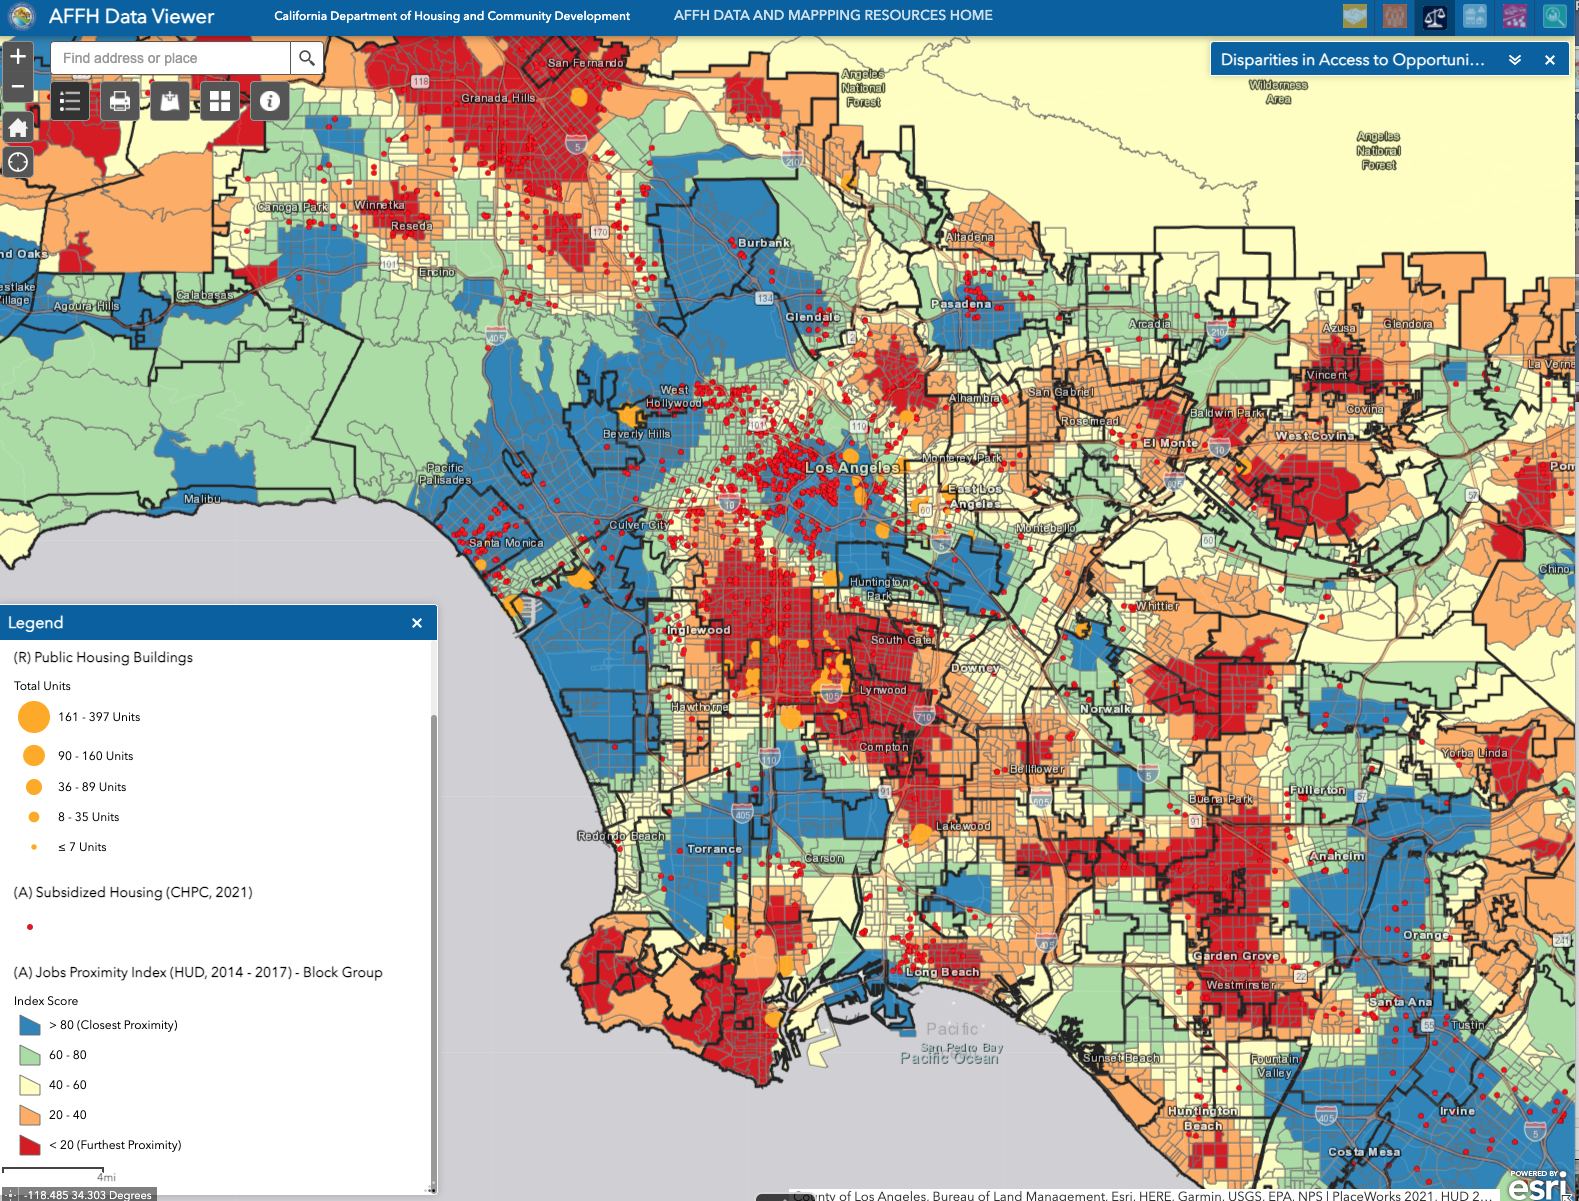
You don't have to guess, because California has created the Affirmatively Furthering Fair Housing Map, so you can see exactly where they are.  Not surprisingly, Public Housing (the publicly-owned ones targeted by Article 34) are rarely in the wealthy suburban areas of Los Angeles County, where the excellent schools and abundant jobs are. 

Notice how many of them are clustered around Freeways. Funny how areas with poor people attract freeways and how the only places that don't encounter NIMBY opposition to low-income housing is next to freeways. 

But, didn't I write in the last post that there were subsidized homes in Redondo Beach?  Yes, but there are different types of subsidized homes. The ones I showed last time are part of a mixed-income community, cross-subsidized by other residents of that complex--not the government. They don't even show up on this map because they don't use public funds (except some minor administration).

If we visualize government-Subsidized Housing, funded by HUD and LIHTC, you can see that they are more broadly dispersed, but still concentrated in certain areas. 

HUD (yellow) = Housing and Urban Development, funding directly from the Federal Department of Housing 

LIHTC (red) = Low Income Housing Tax Credit, a Reagan-era program created in 1986 that substitutes direct federal dollars with tax credits for private developers. It's very complex, but it's the biggest program in use today. 

Click on each red or yellow dot to learn more about each development.

My mother lived in a LIHTC home for a few years after maintaining her old house was too much for her and before she needed assisted living. We submitted paperwork each year to requalify her for below-market-rate (BMR) rent.  (In Silicon Valley, paying $2200+/mo for a 1 modern bedroom apartment is considered a great deal and worth giving her landlord an $800/mo tax subsidy over full market-rate rent.)

To create any kind of subsidized affordable units, you have to build in the first place. If you block all new housing, you can block subsidized housing without explicitly saying that is your intent. 

That gets us to the last line of affordability, Federal Housing Choice Vouchers aka Section 8. Once you secure one (and you can spend decades waiting for your area's waiting list to open and then decades waiting to move up the waiting list to get a voucher), then you have to find a home whose rent is low enough to qualify for the program

The map below shows the percentage of rentals in each census tract that are rented using Section 8 vouchers. Click on each Census Tract to get details of how many units that represents. If you have only one rental 4-plex building in a census tract, but it is all Section 8, then that shows up as 100% and dark brown. If you have 3000 rentals in another census tract, and 400 of them are Section 8, then it shows up in a lighter color. But the second tract is providing more affordable homes. 


People can't use Section 8 vouchers in your neighborhood if you block apartments from being built in your neighborhood. 

If there are apartments, landlords used to be able to discriminate and refuse to take Section 8 voucher holders. But, laws have changed. 

That brings us to the biggest impediment in my area, the lack of units whose rents are low enough to qualify for the program. After all, the government should subsidize basic, not luxury homes, right? 

The HUD Fair Market Rent is set on a regional level, so it's supposed to be an average of Los Angeles, Long Beach and Santa Ana. But, that regional average rent doesn't stretch to the rents in most high opportunity areas. Try finding a 2 bedroom apartment in southwest Los Angeles County for $1330-1708/mo in 2021. This is another reason there are no or very few Section 8 beneficiaries in many census tracts. 

If you have more time to kill, explore the AFFH map further. Click on the squares at the upper left to expose menus of datasets you can layer. For instance, select Jobs Proximity Index. The blue areas have the best access to high numbers of good-paying jobs. The red areas have the least access (by both car and transit). Notice how comparatively few subsidized homes are in the blue areas? 


If we are going to reduce Greenhouse Gas (GHG) emissions and air pollution, we need to move people closer to their jobs. No, that does not mean shipping jobs to the desert. It means that we densify the already developed areas. Unfortunately, this is considered intensification of land use and is very hard to do under existing law. 

Do we change the human laws or do we ignore the physical laws that govern climate change?


Friday, March 25, 2022

How Mixed Income Cross Subsidies Work

There seems to be a lot of confusion about low-income and affordable housing in California and beyond. I was similarly confused, but learned a few things when I signed up to be a League of Women Voters volunteer and attended housing meetings at the regional and local level. 

I keep saying that I am not an expert, but people I consider to be true experts say I know more than 99% of CA voters. So I'll blog about a few things I learned, in no particular order except that it was at the top of my mind for some reason (usually answering a recent question). 

In 1950, California voters passed Proposition 10 that became Article 34 of our state constitution which bans construction of publicly-financed low-income housing unless a majority of voters approve. This helped fuel a rush of incorporation amongst small and midsize cities so that locals won't be overwhelmed by voters of a larger city. Why it’s been so hard to kill Article 34, California’s ‘racist’ barrier to affordable housing (LA Times link) does a good job of explaining the situation.

The wording of the Proposition binds our hands:

No low rent housing project shall hereafter be developed, constructed, or acquired in any manner by any state public body until, a majority of the qualified electors of the city, town or county, as the case may be, in which it is proposed to develop, construct, or acquire the same, voting upon such issue, approve such project by voting in favor thereof at an election to be held for that purpose, or at any general or special election. 
For the purposes of this Article the term “low rent housing project” shall mean any development composed of urban or rural dwellings, apartments or other living accommodations for persons of low income, financed in whole or in part by the Federal Government or a state public body or to which the Federal Government or a state public body extends assistance by supplying all or part of the labor, by guaranteeing the payment of liens, or otherwise. 
For the purposes of this Article only there shall be excluded from the term “low rent housing project” any such project where there shall be in existence on the effective date hereof, a contract for financial assistance between any state public body and the Federal Government in respect to such project. 
For the purposes of this Article only “persons of low income” shall mean persons or families who lack the amount of income which is necessary (as determined by the state public body developing, constructing, or acquiring the housing project) to enable them, without financial assistance, to live in decent, safe and sanitary dwellings, without overcrowding. 
For the purposes of this Article the term “state public body” shall mean this State, or any city, city and county, county, district, authority, agency, or any other subdivision or public body of this State. 
For the purposes of this Article the term “Federal Government” shall mean the United States of America, or any agency or instrumentality, corporate or otherwise, of the United States of America.
This guarantees that no new subsidized rentals can be built in wealthier, higher opportunity areas. It also explains why public housing in CA is so old. We have to hang on to old, decrepit and dangerous subsidized rental housing because we can't offer modern replacements. 

HUD used to help fund modest market-rate apartments (until about 1970) that have become "naturally affordable" as they rotted and became less desirable. That downward "filtering" of homes to lower income households no longer works with our severe housing crunch. Even older apartments can command high rents. This is why you now see families headed by two working PhD rocket scientists squeezing into 2 bedroom apartments built in 1969. My area has slowly become whiter and more affluent. (Anyway, this is getting off-topic and I'll save it for a separate blog post.) 

Today, low and moderate income housing is likely to be built without public subsidy by non-profits or by for-profit developers who are willing to build a few below market rate units in order to be allowed to build more units overall.  This is called a cross-subsidy. 

In the words of the Family Housing Fund
In strong housing markets, nonprofit or mission-driven for-profit developers who build affordable homes can use profits from the sale or rental of market-rate homes to subsidize the costs of affordable homes. For example, some developers have used the profits from market-rate condominium units to subsidize affordable condominium or rental units for working families within the same development.
Here's an example in North Redondo Beach, along a loud and polluted truck route called Artesia Boulevard. I'm using the satellite view option of a California Property Tax Map, which shows you how much taxes are assessed in a bunch of California urban counties, including Los Angeles County. Click the link to see this area.

Each balloon represents a parcel. A range means that there are multiple properties on the parcel (condos, townhomes). Yellow or black means they pay near average taxes. Red means they pay higher than average. Green means they pay lower than average. Proposition 13 allows people to pay much lower than average taxes, as exemplified by the single family home at the top center paying around $1,346/year while adjacent townhomes pay $4,490-$10,525 each (3-5 homes on the same size lot).

On the commercial side of the block, several lots were combined for a mixed-use project of commercial on the street level with 3 stories of housing above. There is a 2-level parking garage below and behind the commercial offices. 


Click the bubble with a range on that building and a spiral with all the assessments becomes visible. Note the 9 green bubbles among the 39 black ones? When the developer built this complex, they offered to sell 8 units below market rate and the buyers of those 8 units promised to sell only to income-qualified buyers at below market rate prices. 

It looks like one of the original 40 market rate homes is now paying lower taxes, perhaps an older person who sold another home and used Proposition 13 portability of lower taxes. Unlike the original 8, that unit does not have any limitation on who they can sell to and at which prices. (I'll explain that later because that is another mind-bogglingly inefficient and stupid system we use because we fetishize home ownership over affordable rentals. This is also rife for fraud and abuse.)


From the National Housing Conference's Policy Guide:
Under strong housing market conditions, the market-rate share of a mixed-income development can generate more income than is necessary to cover costs for developing these units. These profits can fill the gap between income and expenses for the portion of units that are rented or sold at affordable (below-market) rates. This “pure” cross-subsidy model is likely to be viable only in strong markets, where rents and/or home prices are high enough to generate profits to cross-subsidize the affordable units. 
As the federal funding available for affordable housing has declined in recent years, communities and developers have sought more cost-effective and market-based strategies for increasing the supply of affordable homes. The inclusion of market-rate units within a mixed-income development or community can make the development more financially feasible and less reliant on public subsidy through cross subsidization.
Anyway, the 30-second elevator pitches is that developers can sell a few homes as loss-leaders if they can command high-enough prices for the other homes to "pencil out".  How many homes is determined by their costs and the prices they can command for the other units.  The higher the prices in that local market, the more loss-leaders they can create.  

These mixed-income cross-subsidized developments require no public money for construction, which is why they can be built under the conditions of Article 34. But they do mean that new residents who share the building will have to pay higher prices than they normally would have (or the developer takes a lower profit). Usually, it's a bit of both. The higher the inclusionary minimum (more cross-subsidized homes), the higher the costs borne by the market-rate inhabitants of the new housing (who may be themselves housing-burdened). 

But, local governments can raise their costs by throwing impediments at developers until they can't afford to do so. This is why streamlining the development process is so important. If something can be built "by-right" without any additional permitting processes other than normal health and safety ones that apply to everyone, then CEQA challenges aren't possible. 

Tuesday, March 22, 2022

World Water Day 2022: Groundwater

We've circled the sun one more time to another World Water Day. This year, the theme is Groundwater. 

I co-organize a monthly (Zoom) series for the League of Women Voters of Los Angeles County that grew out of a one-time water walking tour I led in the Beach Cities. We record and post all the Water and Infrastructure Group (WIG) lectures along with the slides. Occasionally, I add articles about what we learned or add further information on each month's subject. 


Mr. Matthew Hacker is a registered geologist in California and is currently a Senior Resource Specialist at the Metropolitan Water District of Southern California. He has more than 27 years of experience in water resources planning and local resource development in the areas of groundwater, stormwater, and water recycling. Currently, he is striving to create a more resilient water future for Southern California through innovative new projects such as Metropolitan’s groundbreaking Regional Recycled Water Program. 
His prepared talk is under an hour, half the video is Q and A. 

One fascinating thing I learned is that Metropolitan stores imported river water in the vast LA coastal aquifer. That water we pump out, treat, and deliver to our homes, may have originated in Northern California or Colorado. 

You can learn more about that by watching the Who Fills Your Taps? Video or reading the Who Fills Your Taps? Slide Deck. This is a marathon one that is better ingested in two bites. WIG co-organizer, Kathy Kunysz, is a scientist & planner who has had a long & varied career in water. She knows so much, it's an honor and an education to co-host this series with her.