Wednesday, October 18, 2023

The allies we have

I took down a tweet that was getting a lot of traction for reasons I want to explain here. This whole phenomenon and the complex politics around it, deserves more than microblogging. 

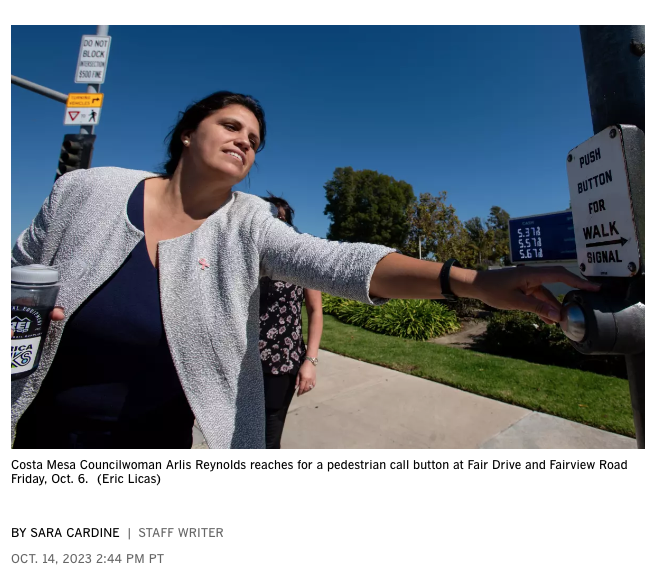
It all started when I linked to this article in the LA Times/Daily Pilot about local elected officials participating in the "Week Without Driving" challenge. Costa Mesa Councilwoman Arlis Reynold said, "I haven't been on a bus in, like, 30 years." 

On the fifth day of Reynolds’ week without driving, the councilwoman was joined by Mayor John Stephens, Thomas and transportation services manager Jennifer Rosales.
[snip]
Stephens, who’s lived in Costa Mesa for 30 years but cannot recall ever taking the bus, said he was stunned to learn how many denizens rely on the local transit system.
I tweeted at how awful it was that elected officials who vote on transit issues don't use it. 

That resonated with a lot of people, and got much attention, retweets. However, I also received comments that it hurts the cause to criticize elected officials who have been allies for safer streets and who agreed to do this experiment and invited the press along to write an article about it. 

They further pointed out that these particular officials don't vote on transit; decisions are made by the Orange County Transit Authority (whose board is made up of elected officials from cities or the county board of supervisors). 

These are valid points and I took down my critical tweet. 

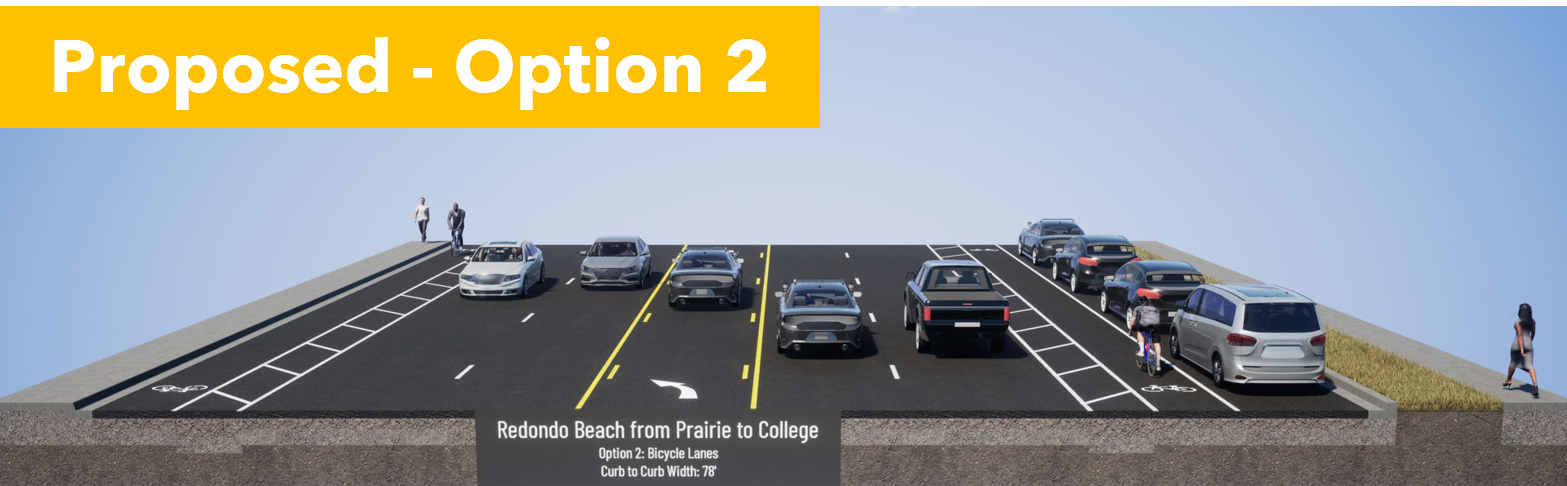
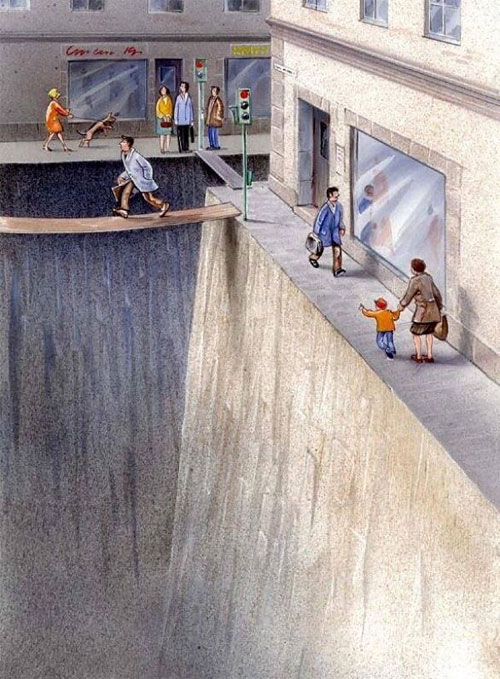
However, I just want to point out that city officials are responsible for the lack of amenities at bus stops, e.g benches, shelters, trash cans, bike racks, way-finding. Bus stops are notoriously hostile places sitting right next to traffic on the busiest and most polluted stroads (street+road). 

Waiting for a bus is literally bad for your health due to air and noise pollution and exposure to car violence.  Drivers have rammed through bus stop benches on both Artesia and Aviation Boulevards near me with enough force to break concrete benches and even pushing one bench (with a woman sitting on it) through the glass windows of the store behind it. 

Cities will use eminent domain and spend $$$,$$$ to buy land to widen intersections for new turn lanes, but they won't do the same to buy a few square feet to move bus stop benches further from the street edge. They don't install plexiglass sound barriers to block wind and dampen noise. They won't install air filters like they do in Korea to protect bus riders from tire and asphalt particulates. 

In conclusion, I'm glad that these particular allies spent a week understanding the challenges of those traveling without cars.  I wish it was mandatory for all elected officials and candidates.  Actually, I wish it was required for everyone, including drivers. 

I am deeply saddened that people are so scared to lose the few allies that they have in Orange County, that they don't feel free to note that officials should have been riding the bus, walking and biking around their cities regularly all along. 

Read the whole article, Costa Mesa councilwoman walks the walk during ‘Week Without Driving’ challenge. In case you can't get past the paywall, the closing is good. 
“I was surprised that [buses] were pretty well packed with people,” he [Stephens] said Tuesday. “We don’t usually walk through the neighborhood like this when we don’t have campaign literature in our hands — whenever you do something like this you become more aware.”

Reynolds, who officially concluded her week without driving last Sunday, is already thinking of improvements for transit riders, first by evaluating all the city’s bus stops to ensure they meet the same standards and adding vital shade and seating where they are currently lacking. And that’s just the beginning.

“I’m interested in looking at broader routes. What I haven’t done is zoom out and see the whole network,” she said in a debriefing Tuesday. “I think there’s an assumption transit can never work in Orange County, but, actually, it could.

“I’m two days past the campaign, and I’m walking still.”
Earlier this year, I read Human Transit: How Clearer Thinking about Public Transit Can Enrich Our Communities and Our Lives by Jarrett Walker. I borrowed an electronic version from the public library and highly recommend it. Jarrett Walker's Human Transit Blog is also good for learning more. 


Wednesday, August 30, 2023

When too much water leads to water scarcity

 Like clockwork, every time we have a big rainstorm, I read news stories and hear people talk about all the "wasted" water running out to sea or out of the arid area. I understand the frustration, but want to highlight some of the complexities. 

For instance, Southern California received quite a bit of rainfall ~10 days ago as the remnants of Hurricane Hilary swept through. We received 2.5" according to my backyard rain gauge. I'll write more about that in a later post (already started drafting it). 

But, I thought it would be interesting to show what happened near Palm Springs, where Interstate 10 was washed out after the area received half of their annual average rainfall in 6 hours. Interstate 10 was shut down for miles due to flooding and mud

One of the surprising things to water neophytes is that less water is captured in torrential rainfall events than in more normal, smaller and slower rain events. 

This is why water professionals are so worried about climate change. Climate models forecast, and our recent experience verifies, that SoCal will get about the same average annual rainfall as in the past--but it will come in fewer and burstier storms like we experienced in August and January/February 2023. 

In arid climates, it makes more sense to store the water underground to minimize evaporative losses. Palm Springs exists due to a large aquifer and faults that allow the groundwater to seep to the surface. After unsustainable groundwater pumping, the Coachella Valley developed percolation ponds to spread imported river water to refill the aquifers. In this way, the aquifer has stabilized. 


This land works remarkably hard precisely because of it's geology. It has the surface to aquifer connection that allows it to function as a percolation pond. But it's also a transportation corridor because it has the surface water needed by overland travelers. 

Can you see the percolation ponds, wind turbines, solar farm, Interstate 10, and the railroad tracks in this aerial photo? That's five uses, not counting housing and related services. 


You can also see wind turbines in this photo from another percolation pond just to the south of this one. 


The transportation corridor is here because of water, but it's also at risk because of water. You can see the Site of the Original Palm Springs RR Depot in this aerial photo, along with Whitewater Canyon, which feeds the Whitewater River that eventually drains into the Salton Sea. 


It's more dramatic in the terrain contour map. 


The people are here because the water is here. 
The water is here because the mountains are here to squeeze the water out of the sky. 
The mountains are here because the faults are here. 
The water reaches the surface because the faults are here. 

It's all interconnected, but I'm digressing again. 

This is about why we couldn't capture most of the water from bursty rainstorms into the aquifer. 

Turbidity and Water

You know how lake beds have very fine soil impermeable (or only slightly permeable) to water? This allows them to hold the water. Watch Who Fills Your Taps as Kathy Kunysz explains how, when water comes pouring off the mountains, the larger gravel falls out first, and then the finer silt settles into clay layers (aquitards). If you don't keep the finer particles out of your spreading basin/percolation pond, they clog up and cease to function. 


If you don't have time to watch this 75 minute video, you can view the slides


In order to preserve the percolation pond, they had to redirect the muddy runoff AWAY from them, so they didn't capture most of the runoff. This happened in January 2023 and again in August 2023. 

If the rain comes too fast, and the water contains too many fine particles, then you can't capture it in percolation ponds. More and more of our rainfall is going to come from these bursty storms. 

The good news is that they water was diverted around the percolation ponds and sent downstream to feed the shrinking Salton Sea. If we preserve and restore coastal wetlands, that silty water can replenish the marshes, build up the coastline, and help protect us from sea level rise and storm surges. The bursty flows can scour out the waterways, remodeling/refreshing wildlife habitat. 

It's all good. 

Waste is in the eye of the beholder. If you look at it in terms of what's valuable to humans, you aren't seeing the whole picture. 

But, it also means we have to work harder and and spend more money to capture the same amount or less water, due to climate change. The people who told you that we couldn't do anything to stave off climate change because it was too expensive played the American public for chumps and we fell for it. 

Wednesday, August 23, 2023

The ghost of wells past

Remember when I wrote that I wasn't that worried about PFAS chemicals in my drinking water? I'm still not worried about it. But several things stood out when I looked at the 2022 Hermosa Redondo Water Quality Report


I expected to see small (but safe) amounts of Uranium from the imported drinking water purchased from Metropolitan Water District (via West Basin Municipal Water District). That's a blend of Colorado River and Sacramento-San Joaquin Delta water. For myriad reasons, water from the 4-corners states in the Colorado River Basin contains Uranium and Radium. 

But, why does my local groundwater contain more Uranium than the water imported from the states where we used to mine Uranium, and make and test bombs? I posted that question on the social media platform formerly called Twitter and had my answer in minutes. 

I found a map of active water wells from LA County Dept of Public Works. Unfortunately, I couldn't figure out how to download the map and combine it with other data so you'll just see a screenshot. Look at the 3 aqua balloon pins near the right of the map, just west of Inglewood Blvd. 


Now look at the map of Oil Wells (Inside LA County) from City of Los Angeles GeoHub


See the old oil wells that used to operate in the vicinity of the active water wells? 

EPA: Radioactive Waste Material From Oil and Gas Drilling

Rocks in and around certain oil- and gas-bearing formations may contain natural radioactivity. Drilling through these rocks or bringing them to the surface can generate waste materials that contain radioactivity.
I'm drinking a blend of local groundwater and imported river water with an average of 2.3 pCi/L and 1 pCi/L of Uranium respectively. 

The federal EPA Maximum Contaminant Load (MCL) for Uranium in drinking water is 20 pCi/L (one trillionth of a Curie per Liter; a Curie is a measurement of radioactivity). However, there are measurable increases in negative health outcomes for water above the EPA MCL Goal (MCLG) of 0.43 pCi/L. 

This is concerning but not panic inducing (at least for me.) Reverse Osmosis (RO) reduces contaminants in water, including Uranium and PFAS chemicals. RO also reduces the calcium salts responsible for Water Hardness. Anything above 300 ppm (parts per million) is considered hard water. Imported river water is semi-hard, at ~200 ppm, but the groundwater here is 380 ppm. 

I would be happy to pay for RO treatment of household water. The small extra expense would reduce wear and tear on my home's plumbing and my housecleaning time. It's a worthwhile tradeoff. 


[The EIR for West Basin's abandoned plans to build a desalination plant estimated that the RO-treated ocean water would have saved customers an average of $300/year in reduced plumbing and appliance replacement expenses. Coastal NIMBYs enjoying 100% imported river water blocked the plant despite support from inland communities using very hard groundwater like mine.]

Today's LATimes features an excellent profile about Adel Hagekhalil, general manager of Metropolitan Water District of Southern California. He talks about the existing three pipelines that bring water from the Delta, Owens Valley and the Colorado River. He advocated for developing our "Fourth Pipeline" of local water sources. 

I fully support that vision; it's an achievable goal. But let's not kid ourselves that it will be easier or cheaper. There are tradeoffs for everything, as I learned from the Water and Infrastructure Group lecture series I co-organize. Understanding Drinking Water Quality taught me the limits of conservation. Groundwater 101 and Measure W taught me the difficulty of developing *new* groundwater supplies. San Diego's Pure Water and LA County Sanitation Districts taught me the challenges of water recycling. 

I'm willing to pay a little bit more to stop dewatering faraway places, to honor our treaties with Tribes, for higher quality water, and for more reliable and secure water supplies. We have the technology to do all these things, but financing it is going to be the biggest hurdle. Middle and higher income users will be fine. 

But, I ask you to join me in overturning Proposition 218, which constrains our ability to buffer lower income people from the impact of higher utility bills. We need to figure out a way to spread the costs equitably, which includes overturning Prop 218 and securing State and Federal funds to help low-income users. 

Saturday, August 19, 2023

PFOS/PFOA/PFAS

 I was going to title this post "Why I am not freaking out about PFOS/PFOA" but worried that it would be quoted out of context by people who don't read beyond headlines. The point is I am not worried about my personal exposure to PFOS/PFOA because I did a little research and am reassured that I live in an area where my water is safe. But that is not true for everyone. (PFOS & PFOA are a couple of flourinated compounds in the bigger class of PFAS.)

If you live in California, your water provider has to send you an annual Water Quality Report. It's no longer provided in hard copy with one of your monthly water bills. But the link to the report should be listed in one of your recent bills. For instance, read the California Water Service Rancho Dominguez District Hermosa-Redondo System Water Quality Report 2022

Cal Water is a regulated monopoly that tests for PFOS/PFOA and similar flourinated compounds even though they are not required to. From page 10 of my report for Hermosa & Redondo Beach:

In March 2023, EPA issued a proposed national primary drinking water regulation for certain PFAS. The proposed regulation calls for a maximum containment level for PFOS and PFOA of 4 ppt each. Four additional PFAS—PFNA, PFHxS, PFBS, and GenX— would have a combined hazard index limit of 1.0; the hazard index calculation would determine if the levels of these PFAS as a mixture pose a potential risk. 

Knowing that these were constituents of emerging concern, Cal Water proactively tested active sources in our systems for these PFAS years ago. Although not required, we believed it was the right thing to do. In any areas across the state where detections were above levels at which DDW recommends water suppliers take action (the response level), we took the affected sources out of service until treatment was or can be installed. 

None of our active water sources have levels of these six PFAS compounds over current California response levels.

Then on page 16, I can see that my local groundwater has no detectable PFAS and the imported river water (supplied by Metropolitan Water District) has a range of 0-2 ppt (parts per trillion) of PFAS and an annual average of 1 ppt. While adverse health effects can occur with any amount of PFAS above 0, my exposure is very, very small since I drink a blend of groundwater and Metropolitan water. 


 If you live in Hermosa Beach or North Redondo Beach, your water comes from a few wells near Artesia Blvd like this one behind state senator Ben Allen's field office. 


The water is piped to blending tanks behind the new (and fantastic) bakery, Tommy and Atticus


From there, the water is pushed out in distribution pipes to 90278 and 90254. 

What does it mean to take a water source out of service and treat it? 

It means that water from each well is tested and, if it is too high, they stop using that well and serve you cleaner water from another source (uncontaminated well or imported water purchased from MetropolitanWD). 

CalWater found PFOS/PFOA at a well in Montebello (east of DTLA) and took the well off-line in February 2020, and began construction of a facility to remove the contaminants in December 2020. In January 2022, they held a ribbon cutting for the updated facility and returned the well back to service

The technology is simple and well-known. Read the EPA's explainer, Reducing PFAS in Drinking Water with Treatment Technologies

Well water is passed through a bed of Granular Activated Charcoal (GAC), which adsorbs a whole bunch of stuff I don't want to drink (some dangerous, some merely unpleasantly smelly). A regularly refreshed bed of GAC can remove PFOS/PFOA to below detectable levels (ND = none detected). 

But what do you do when the GAC becomes saturated with contaminants?  In the case of a Brita Filter, I toss the old one in the trash, run the pitcher components through the dishwasher to disinfect them, and install a new filter. 

At the water treatment plant, they use a polymer resin to perform anion exchange to pull the adsorbed chemicals off the charcoal. The resin can be incinerated at a high temperature to destroy the PFAS. The charcoal can be reused for years. The resin is expensive and also relies on having access to a high temperature incinerator (which we have in Long Beach with SERRF.) This treatment process adds about $50/AF (acre-foot) to the cost of water, enough for 5-10 people for a year. For a large water system, this is affordable. 

However, PFAS is a problem around the world, including places that can afford charcoal but not the resin. That's why I found so many papers about how to remove PFAS from charcoal using heat so that they can reuse the charcoal. 

Thermal Stability and Decomposition of Perfluoroalkyl Substances on Spent Granular Activated Carbon

Recent advances on PFAS degradation via thermal and nonthermal methods

Thermal destruction of PFAS during full-scale reactivation of PFAS-laden granular activated carbon

I'm happy that all of these papers are open access (doesn't require $$ purchase) because the authors paid for open access. This kind of knowledge should be available to everyone. 

Anyway, back to the LA Times newspaper articles that freaked so many people out  and lacked context. 

Risk of tap water exposure to toxic PFAS chemicals higher in Southern California cites a USGS study that sampled 700 public and private wells around the country. They modeled the characteristics of the sampled wells and estimated that 45% of US wells are contaminated with at least one PFAS chemical.  SoCal wells are more likely to be contaminated due to urbanization (industrial facilities, domestic wastewater) and past foam retardant use (fighting wildfires and at airports). 

Since there is no requirement to test for PFAS, your water supplier may not test for it. So I may not be panicked about PFAS because I have been reading my annual water quality report, but most people never bother to read it. Many people don't even know who their water supplier is, but that's a whole other story.

If you are among the 10 million people in Los Angeles County, the LA Board of Supervisors recently voted to require all water suppliers to test for PFAS chemicals. This won't change my water, but might change yours. I presume that, if they find PFAS, they will be required to remove it before putting it into the domestic water supply. 

If you live in SoCal, your water supplier buys imported river water through Metropolitan Water District either directly, or from a subregional water wholesaler like West Basin MWD at a cost of $1,400-$1,800/AF. Well water costs about half as much as purchased imported river water, if your water supplier owns permits to pump groundwater. Building a GAC treatment facility at $50/AF is worthwhile because well-water is still a bargain compared to imported river water and we have a convenient and safe way to dispose of the PFAS removed from the water. 

I co-organize a monthly series for the League of Women Voters called WIG, the Water and Infrastructure Group. Upcoming discussion topics/speakers, recordings of past meetings/talks and other educational info can be found on the LWV Beach Cities Natural Resources Page


Hopefully, this will inoculate you against sensationalist newspaper headlines like Brita water filter company accused of false advertising. Have you ever installed a Brita filter wrong so that the water runs right through the gaps on the side of the filter? Do you always change your filter as often as the label on it?  I'm fallible. I'm using the Brita filter just to remove unpleasant odors. I expect it to reduce contaminants, but not to remove them altogether. I am running a home kitchen, not a water treatment facility. But I do expect my water company to supply safe water to my home. 

Read your annual water quality report. There are some smaller water systems that can't afford to fancy water treatment systems and are too remote to hook up to cleaner water supplies. Then there are big water systems like LADWP that politically can't raise water rates so they put off maintenance and upgrades. Look at how bad the LADWP water scores relative to other LA County water systems!  (Data and visualization from the CalEnviroScreen 4.0 Indicator Map of Drinking Water Contaminants.)


If I lived in the City of LA, I would be writing my council members and to the press every week. This is just so embarrassingly bad. (Fortunately, CA drinking water is very clean on a national scale, so you can be in the worst tenth (like LADWP at 90th percentile for CA) and still pass all federal EPA standards. But, for a large water system in an urban area, this kind of water system neglect is just inexcusable. 

Come to WIG on second Thursdays of each month at 7 pm on Zoom. Learn more about water and all sorts of other things that make our area run smoothly. Ask questions and get answers. 

Tuesday, June 06, 2023

We're unprepared for the Silver Tsunami

I was discussing Metro's Traffic Reduction Study for pricing roads (aka Congestion Pricing) to discourage driving. This very unambitious plan is targeting just three areas:
  1. DTLA (cordon area)
  2. I-10 between Santa Monica and DTLA (toll road)
  3. I-405 through the Sepulveda pass, including canyon roads (corridor pricing)
I wrote an analysis from a data-based and science (climate change, pollution) perspective, and encountered a lot of pushback. Everyone in the group is a driver, but I'm the only utility bicycle rider that rides in traffic. Others ride recreationally on the beach bike path or on low-traffic foothills roads. 

The reflexive response was, "What about the low-income (or moderate income) drivers?"

I was making maps using data from Los Angeles County CVA Social Sensitivity Index and was struck by how some areas of LA County are much older than others. That is, the coastal and hill sections have extremely high proportions of seniors.  It's especially dramatic if I map the census tracts by how many standard deviations they are from the mean. 


Darker magenta areas have more people over 65 years old than average. Bluer areas have fewer seniors. 

By implementation time for congestion pricing, today's 65 year olds will be > 73 yo. How long do you think they will be able to drive mountain roads? 

It gets more grim when I divided by transit access. These are high senior population percentage divided by standard deviations from mean transit access (which is already not great in LA County). 


Those are areas where we either need to improve transit and micro-mobility (for electric wheelchairs or sit-down scooters), or we need to move seniors out. Because people like to stay near their community, my preference is to coax them down from the canyons to multi-family housing where they are probably already driving for shopping, services, dining, recreation, or work. 

This leaves some voids in the flatter areas, which can be fixed by street space allocation, improved bus service, and some apartments near bike lanes & bus routes (hello, East Manhattan Beach). 

Anyway, congestion pricing is not going to harm seniors living in the canyons of Bel Air, Malibu, or Brentwood. They will soon age out of driving. It might cost them more to receive senior care in their homes if their caregivers have to pay to drive there. 

On the other hand, if it does improve traffic, then lower income workers will have more time for paid work and less unpaid time sitting in traffic. E.g. they can accept more clients per day because they will spend less time driving. This starts a virtue cycle where they won't have to pad their per visit charge as much, making senior care more affordable. 

You know what would create less traffic? If we let seniors live in congregate settings, where they each have their own small apartments, but caregivers are on site and can simply walk between clients. That would help alleviate traffic, the shortage of elder caregivers, and improve caregiver pay per hour. 

Instead of thinking about changes with fear, look critically at what is not working and how we might improve the status quo. 


Wednesday, May 10, 2023

Guidance for the Metro Active Transportation Corridor: Redondo Beach Blvd Survey from a Local

Urgent Action Alert 

Deadline Extended to May 30, 2023 May 15, 2023 so read on and fill out the survey now 

I need you to fill out a public input survey about a vital active transportation project for Redondo Beach and surrounding cities in the South Bay region of Los Angeles County. This is our chance to reverse some of the damage wrought by past auto-centric road design in North Redondo Beach and allow those who can ride a bike to make school and shopping trips with confidence that they can make it home alive and in one piece. 

There's also a Story Map about the Redondo Beach Blvd Active Transportation Corridor Project with more information. 

Short version if you are in a hurry:

The current street allocation with car parking on both sides and massive SUVs speeding down our streets is not safe or welcoming for cyclists. The proof is in the declining bicycle mode share. 

When filling out the survey, select the options that give a protected bike lane every time. Scroll down past the background info to see my recommendations and why. 

Paint is not protection. Never select an option with a paint-only bike lane in the door zone. If someone opens a door, a cyclist in the door zone will be knocked off their bike and suffer grievous injuries. If they swerve to avoid the door, or are knocked into the traffic lane, they could be killed. No one wants to be killed or have their child killed while riding to school. 

Two-way cycle tracks are a good option, particularly near schools. When kids are arriving or leaving school, there will be a lot of traffic congestion on all modes. But cars are particularly dangerous. The less car traffic they cross while leaving the congested area, the safer they will be. Keep them on the school side of the street, with wide lanes so that there is passing room in the bikeway (keep the kids out of the car traffic lane). 

Plastic poles are not physical protection, but likely the best we can get as a first step.  Plastic poles can be replaced with bollards or concrete barriers later if we allow enough buffer space to install the plastic poles in the first place. Do not let the perfect get in the way of actions we can do right now. 

You can skip the background (but I hope you read it when you have more time).  

Background: The Connection with Schools

The project area below was originally going to be along the old freight route from Redondo King Harbor to the inland rail routes, but Ripley was found to be too steep (several areas with 15% grades) to be feasible for safe cycling. 


A Redondo Beach traffic study determined that 30% of the city's AM/PM peak traffic is the child school run. This travel corridor includes

  • Adams Middle School: 1066 students: 6-8 grades
  • Washington Elementary School: 801 students, K-5
  • Jefferson Elementary School: 509 students, K-5
That's almost 2400 K-12 students arriving and departing each day on this corridor. 

But that's not all, because all students in Redondo Beach Unified School District (RBUSD) attend Redondo Union High School (RUHS) in South Redondo Beach*. Jefferson ES students also attend Parras Middle School south of RUHS. 

Assuming 350/grade at Adams MS and 90/grade at Jefferson ES, 

350*4 + 90*7 = 2030 students cross 190th Street to attend school and return home each day. 

About half of all RBUSD students traverse this corridor every school day.

But that's not all; El Camino College (ECC, 22,000 students, many from the Beach Cities) is on the eastern end of this travel corridor. Some RUHS and MCHS students do concurrent enrollment and take classes at ECC while they are in HS. Due to many factors, including cost and lack of housing at UC campuses, a large number of students are enrolling in grades 13/14 at ECC before transferring to a 4-year college/university. 

When filling out the survey, think about what you would send your kid to school on. Think about what you would be comfortable riding on as you accompany your younger child to school or run your errands. I ride this area 1-2x/week to run errands in North RB or West Torrance. I want better infrastructure for my safety, too. 

Watch this video of the horrifying existing conditions as ridden by two fit MAMILs (Middle-Aged Men in Lycra). Would you ride these steep hills? Next to fast-moving busy traffic?


Here's another video of the area where Kyle, an area father, rides his kids to preschool. 


My opinionated guide for the survey choices and why they matter: 

Every cross-section shown is facing either Eastbound or Northbound.

Q1: For the westernmost portion of the corridor, which alignment(s) do you prefer? 


I picked D because that would give us a 2-way cycle track on Lilienthal and the longest length of protected bike lanes on 190th. 190th St is also the only way to avoid steep hills. 

The problem with B: The first video shows just how steep Ripley is. Notice that the lead cyclist on a light road bike has trouble getting up the hill (and the trailing cyclist with the camera is on an eBike). Going up a 15-16% grade is difficult, but going down them is downright dangerous. Do not send kids on this route. 

A and C are better, but still steep in some sections. Also, if those are the official routes, there will not be likely any road changes except Sharrows, which are shown to be more dangerous than not doing anything

Only Option D along 190th St will yield any road space allocation for cyclists. 

What is a Sharrow? 

Why are Sharrows so dangerous? 

Q2: The proposed street section for 190th St (Alignments C and D) is shown here. How satisfied are you with this proposal?


I picked Very Dissatisfied: These cross-sections are looking towards the east, with Torrance on the Right Hand Side (RHS) and Redondo Beach on the LHS. Cars are coming down the hill from Flagler and often speeding 50 eastbound mph. People drive with the sun in their eyes during the morning and evening commutes. Do you feel safe with just paint and plastic poles designed to bend when run over by vehicles?

I recognize that people living in the apartments in Torrance on the right need overflow parking, but let's swap the bike lane and parking lane. Install a parking-protected bike lane like this one in Long Beach on the Torrance side with breaks to preserve sight lines at each driveway or street crossing. 


On the RB side, I'd like to see real bollards or a curb. Imagine something like these without the parking lane. Images courtesy of National Association of City Transportation Officials (NACTO)


Q3: Select Option 1, the 2-way cycle track on the east side, next to Washington ES. 


Option 1 provides separation from cars, and is wide enough for passing, and allows parents to ride side by side with a child gaining confidence in their bike skills. In 2-way cycle tracks, people riding opposing car traffic are facing approaching cars, so they can see and react to dangerous drivers. It would be better to have solid protection here, but Option 1 gives us room to retrofit with more solid barriers later. 


Option 2 puts kids in the door zone on one side and makes them cross the street to get to school. It's a dangerous situation. 


Q4: Select Option 1, the 2-way cycle track on the east side, next to Washington ES.  


Don't be distracted by the stock visualization image with a tall solid wall. There is currently short solid wall on the parking lot side and a wood and rope fence on the road side. 


Option 1 gives a clear place for kids to ride that is physically separated from cars. The 2-way cycle track would replace the wide grassy area.


Option 2 is sharrows in a place where drivers are more focused on making a turn at Ripley than cyclists approaching from behind them. 

Motorists trying to make a right turn will pull over to the right, trapping cyclists behind them. Small children on bikes and tall, boxy hoods on todays trucks and SUVs mean that parents may not be aware of cyclists in front of them. This has led to an epidemic of frontover crashes where drivers run over people in front of them because they can't see them over their hoods. Or, they look at their screens and forget that there are children in front of them. 

Option 2, sharrows, is a safety disaster. 


Q5 on Ripley: Pick Option 1, the 2-way cycle track on the Adams MS side


Option 1 keeps the kids on the school side as long as possible. It also preserves the car unloading curb space that people are currently using. 


Option 2 puts kids in the door zone, at precisely the time that kids being driven to school are unloading. This is a safety disaster. 


Q6: Grant Ave from Inglewood to Kingsdale; I am very dissatisfied but I selected other and explained why we need solid protection instead of plastic bendy poles


They are proposing paint, a buffered (space separation) and plastic bendy poles. 

This is better than existing conditions, but not safe. Cars pick up speed heading downhill and frequently misjudge the curve, so they end up sideswiping cyclists in the bike lane. We really need a concrete barrier on the downhill (right hand) side. 

I ride by bike to shop at the Galleria and this is the scariest part. I saw a guy almost get killed here. If we want more people to bike through this area, which connects to shopping, the South Bay Transit Center, and the 300 new homes under construction, then we deserve solid protection in this dangerous area. 

I gotta break for lunch but I'm going to hit Publish on this so you can get started. I'll finish after lunch. 

...

I'm back. Stay with me because we are on the home stretch, but the most dangerous one that crosses the 405 Freeway and has the most high-speed traffic. 

Q7: Artesia Blvd from Kingsdale Ave to Redondo Beach Blvd pick Option 2.  

Existing conditions are awful and you see very few cyclists brave enough to ride here. If they do, they are often on the sidewalk, conflicting with pedestrians. 

Option 1 puts cyclists next to vehicle lanes, but protected with a concrete curb. Pedestrians and cyclists would intuitively understand where they are supposed to be, as faster bike traffic is at the street level. However, this would interfere with bus stops. 


Option 2 puts pedestrians next to the vehicle lanes, but also next to the bus stop. Trees would provide shade. There could be some confusion with pedestrians wandering on the bike path, but that can be solved with good signage.


Our community has experience with pedestrian and bikeways next to each other in the North Redondo Beach Bikeway (NRBB). While there is some spillover, people have already learned where pedestrians and rollers have priority on the NRBB. Option 2 will work best for us and we already know how to use it. 

Q8: Redondo Beach Blvd from Artesia Blvd to Hawthorne Blvd. Is a tossup but both Options are so much better than the status quo.


Option 1 pits cyclists against pedestrians, but provides 2-way access to Walgreens and Starbucks. It's not terrible as long as cyclists slow down when passing pedestrians and motorists exiting the parking lots look both ways. 


Option 2 provides a clear separation between motorists, cyclists and pedestrians. Cyclists are curb-protected on the eastbound RB side, and parking-protected on the westbound Lawndale side. However, coming westbound from Walgreens/Starbucks, people will likely bike on the sidewalk until they meet the 2-way cycle track. 


Although you lose a traffic lane, it's not the cyclists' fault. One can just as easily blame the space allocated to free car storage (on-street parking) and a turn lane. Motorists are losing a travel lane to other motorists, not cyclists. Don't forget that. 

Option 1, the 2-way cycle track, provides a better alternative not suggested by Metro for the next section. 

Q9: Redondo Beach Blvd from Hawthorne Blvd to Prairie Ave. I am Very Dissatisfied & propose a better solution. 


Although the status quo is very bad, we shouldn't rush into the proposed door zone bike lane next to high-speed traffic heading to the freeway onramps. It is extremely dangerous. This will greatly reduce the number of people brave enough to ride to Alondra Park and El Camino College. 

If there is enough room for on-street parking, then there is enough room for a parking-protected bike lane. That may require narrowing the car lanes a bit, but that would also inhibit speeding, making that stretch safer and quieter for all road users. 

The freeway onramp is on the north side of RB Blvd. A 2-way cycle track on the south side of RB Blvd would keep cyclists away from the crazy line of cars trying to merge onto the 405 on-ramp. Suggest that in Q11. 

Q10: Redondo Beach Blvd from Prairie Ave to Dominguez Channel. Pick Option 1, the 2-way cycle track on the North side, next to the park and El Camino College. 


Option 1 puts cyclists next to the park and ECC. Although it is shown with plastic bendy straws, it can easily be fitted with bollards or a concrete curb for better protection when cycling to and from evening classes at ECC. 


Option 2 puts cyclists in the door zone, where they can be knocked into fast-moving traffic and killed. Drunk or malicious drivers can also harm cyclists easily with only "paint as protection". 


Q11: Additional Comments: This is where we ask for a protected 2-way cycle track on on the south side of RB Blvd between Hawthorne and Prairie. 

What do you need to be comfortable bicycling this corridor? Tell them!

Keep in mind that younger Beach Cities kids will probably only ride the western side of this corridor, west of Inglewood or Kingsdale. But older teens and young adults may need to ride to ECC or to retail jobs between Kingsdale and Crenshaw. 

There are a lot of children and seniors in Lawndale and Torrance who would benefit from these bike facilities, whether they are riding a bike, trike or mobility scooter. 

We should make this corridor welcoming for ages 8-80. 

Think about who needs to travel through this corridor and at what times. What kind of cycling facilities do they need to get there comfortably and safely?  What about seniors in mobility scooters or electric wheelchairs? Would you like to see food delivery robots in the bike lane or more food delivery by privately-owned cars?

With better bike facilities, I may choose to bike to stores further east than I currently feel safe. Every trip I make by eBike instead of car, I am "sparing the air", not taking up road space in front of you, and not competing with you for parking. 

Another thing that excites me about this project is that it connects us to the Dominguez Channel. In a separate project, LA County Public Works will be extending the bike path along the channel southwards. It currently goes north to 120th St, past Amazon, Space-X, Lowe's and to the Metro Green/C Line. A southbound channel bike path would connect to the Harbor Gateway Transit Center, with very fast connections to the Silver/J Line to USC/Expo Park (15 min) and Downtown LA (20 min). Harbor Gateway TS is already linked up to CSU Dominguez Hills. This is a large step forward for a transportation transformation for the South Bay. 

Bike lanes benefit you even if you don't ride a bike, but your neighbors do. 

Bike lanes will save you time currently spent chauffeuring your kids short distances. 

Bike lanes will benefit your kids because students who get exercise before school do better. 

Bike lanes will benefit you when you age out of driving. 

Bike lanes may allow your family to shed one car, saving you over a million dollars per lifetime

Finally, I want to close with this terrific video of a #BikeBus led by Coach Sam Balto in Portland. 

https://twitter.com/CoachBalto/status/1656353963489501190?s=20

This bike corridor will touch the lives of half the students in RBUSD and can be transformative for the way our community gets around. If half of our households can shed just one car, we would be richer, our street parking and traffic congestion problems will evaporate, our air and water will be cleaner, and we will have done our part to slow climate change. Oh, we'll be fitter and happier, too. 

* A very few students living in North RB attend Mira Costa HS in Manhattan Beach, but only if MBUSD will take them. 

Friday, March 03, 2023

True Cost to Own

This post was inspired by a Twitter exchange with a Culver City resident who was able to shed one of her family's two cars due to the Move Culver City Project to reallocate space from cars to transit (bus lanes), active transportation (walking/biking) and micro-mobility (scooters, wheelchairs). 


Culver City's city council balance changed from 3/2 in support of this street space reallocation to 3/2 opposed. The new city council wants to reverse the street space allocation and give 100% of the public space to cars again despite the city's own data that transit and bike use grew explosively while car use declined.  Read the Move Culver City Mid-Pilot Report.  


I think reversing Move Culver City is a big mistake for many reasons, but I will just get into the financial angle in this post. 

Car ownership is so normalized in US society that I think we stop paying attention to how much it's really costing us. When AAA published their annual report "How Much Does it Really Cost to Own a New Car 2022", it surprised many people. [2023 Update is even grimmer, $12,182/year]


There were the usual arguments that not everyone buys a new car. But, this assumes the average new car sells for $33,301 when Kelley Blue Book reports that the average car price set a new record in December 2022 at $48,681. Car and Driver reports that Los Angeles drivers pay $681/year more for car insurance than the national average.  

$10,728 is an underestimate for the cost to own a car in Los Angeles. That price also does not include the cost of a parking spot, which you are paying for whether it's a line item in your budget or not.  Everyone seems to complain about parking, even though Los Angeles has more homes for cars than for people

If households with multiple cars can shed one car, they can save $10,728/year. 

Median Culver City household income in $97,540 with a marginal tax rate (CA+Fed) of 33.3%. 

Owning a car costs $16,084/year pre-tax. 

If that money were put in a tax-deferred retirement savings account every year for 30 years, that household can accumulate just under $1 Million! 

I assumed that the money was saved in a Vanguard Growth and Income Mutual Fund (VGIAX) earning about 6.54% over the last 20 years or 10.78% over the last 10 years. 

The Bureau of Labor Statistics CPI inflation calculator says inflation ran 2.65% over the last 20 years. 

Using a conservative 4% above inflation estimate for VGIAX, the Bankrate Compound Interest Calculator shows that the household that was able to shed a car winds up with $916,300 after 30 years in their retirement savings account. Yes, you do pay taxes as you withdraw that money, but that's a huge chunk of money nevertheless. 


In Summary, if Move Culver City allows families to shed one car, then that is a $1M gift to the families in Culver City. 

Reversing/removing the street improvements--making buses too slow to use and bicycling too dangerous to attempt--forces families into cars again. If they have to own a second car again, then Culver City families lose $1 M. 

Elected officials should think long and hard about whether they want to force car dependency and costs onto their residents. It's not good for residents, it's not good for the planet, it's not good for the city. Finally, I don't think it's good for the elected officials' ability to get re-elected.