Showing posts with label Economics. Show all posts

Thursday, June 19, 2025

Dark Roof Lobby

I just can't make up as self-serving as the Dark Roof Lobby.  We live in the post-truth society so they are even successful despite having no science to back up their assertions. 

[I learned about this issue, and about Floodlight News from the non-billionaire-controlled social media site, Bluesky. You can find me there under the handle, gspeng.]

Remember in 2012 when we replaced our dark asphalt composite roof with a Cool Roof? It cost no more than the dark color, and was also made of composite materials. Only, the cool roof contained light-colored bits of recycled and tumbled glass instead of dark asphalt bits. Instead of absorbing 70% of incident heat, it reflected 70%. 


It's not a big change in appearance, costs no more, was just as easy and quick to install, and lasts just as long. (Actually, glass is one of the more stable materials and it might last longer than asphalt composite shingles.) Installing a cool roof will make a big difference in your comfort on a warming planet, and on your pocketbook in cooling costs.  How often do you get something that is all upside?

That's a private benefit. The real gains are when it's multiplied at the city level. In Cool Roof 2: Cool Roof, Cool City, I explained mass deployment of cool roofs are the most effective and cheap method of reducing the Urban Heat Island Effect. We're talking dozens of studies using mesoscale modeling including radiative forcing calculations (instead of cheaper parameterizations), in a variety of climates. 

In different climates, Cool Roofs always comes out the top or second most impactful intervention for combatting the Urban Heat Island Effect. They are also the cheapest. Unlike trees, they don't require you to find water in the desert to perpetually water them. 

It's a sign of the times that I am not sure of the veracity of a epa.gov website and if it will be messed with later. As of June 19, 2025, these are factually correct. 

Who could possibly be against replacing a dark roof at the end of it's natural lifespan with a cool roof? 

Enter the Dark Roof Lobby, under the guise of an astroturf group calling themselves Coalition for Sustainable Roofing. 

The Coalition for Sustainable Roofing (COSUR) represents companies who manufacture cool roofs, dark roofs, gray roofs, white roofs, and everything inbetween. Carlisle Construction Materials, Holcim Building Envelope, and Johns Manville are long-standing North American-based manufacturers of a variety of building products. Because they manufacture a wide range of roofing products instead of specializing in just one membrane type, these companies have a unique vantage point from which to offer insights on holistic roof system design and sustainable roof assemblies. COSUR works closely with roofing architects, roof consultants, and roofing contractors to emphasize holistic approaches to roofing solutions, promoting resilience, energy efficiency, and urban heat island mitigation.

What is "holistic roofing?" How is lobbying against Cool Roofs promoting resilience and energy efficiency? Just say it out loud. You don't want to change and you want to milk your old factories for as long as you can without learning how to make different things.  

COSUR has exactly one employee, an operative government relations and equity-focused leadership professional. I am not going to link to her page, but here are screen shots from her LinkedIn. 

It would be comical, except that they were successful in preventing Denver from adopting a cool roof requirement and rolling back Tennessee's requirement. COSUR also stopped  adoption of cool roof requirements in national energy efficiency codes. 

Their lobbying uses talking points that are just blatantly untrue lies. Cool roofs do not wear out any faster, or cause mold problems. They cherry-picked one study from Harvard and ignored dozens of studies from around the world showing that cool roofs are very effective at combatting the urban heat island effect. 

Whether your home lacks air conditioning or if you are among the 27% of US families that struggle to pay their energy bills, a cool roof could be literally the difference between life and death in a heat wave.  

From the Floodlight Article:

But the weight of the scientific evidence is clear: On hot days, light-colored roofs can stay more than 50 degrees cooler than dark ones, helping cut energy use, curb greenhouse gas emissions and reduce heat-related illnesses and deaths. One recent study found that reflective roofs could have saved the lives of more than 240 people who died in London’s 2018 heatwave.

Energy insecurity is borne by renters, though landlords select the roofing material. This is why cool roof mandates matter. Over time, everyone will have access to this life-saving, and money-saving, measure. But we have to stop replacing dark roofs with dark roofs. 

Large roof manufacturers can afford to retool to make cool roofs. They just don't want to. People will die. 

Wednesday, June 04, 2025

The horror of catenary


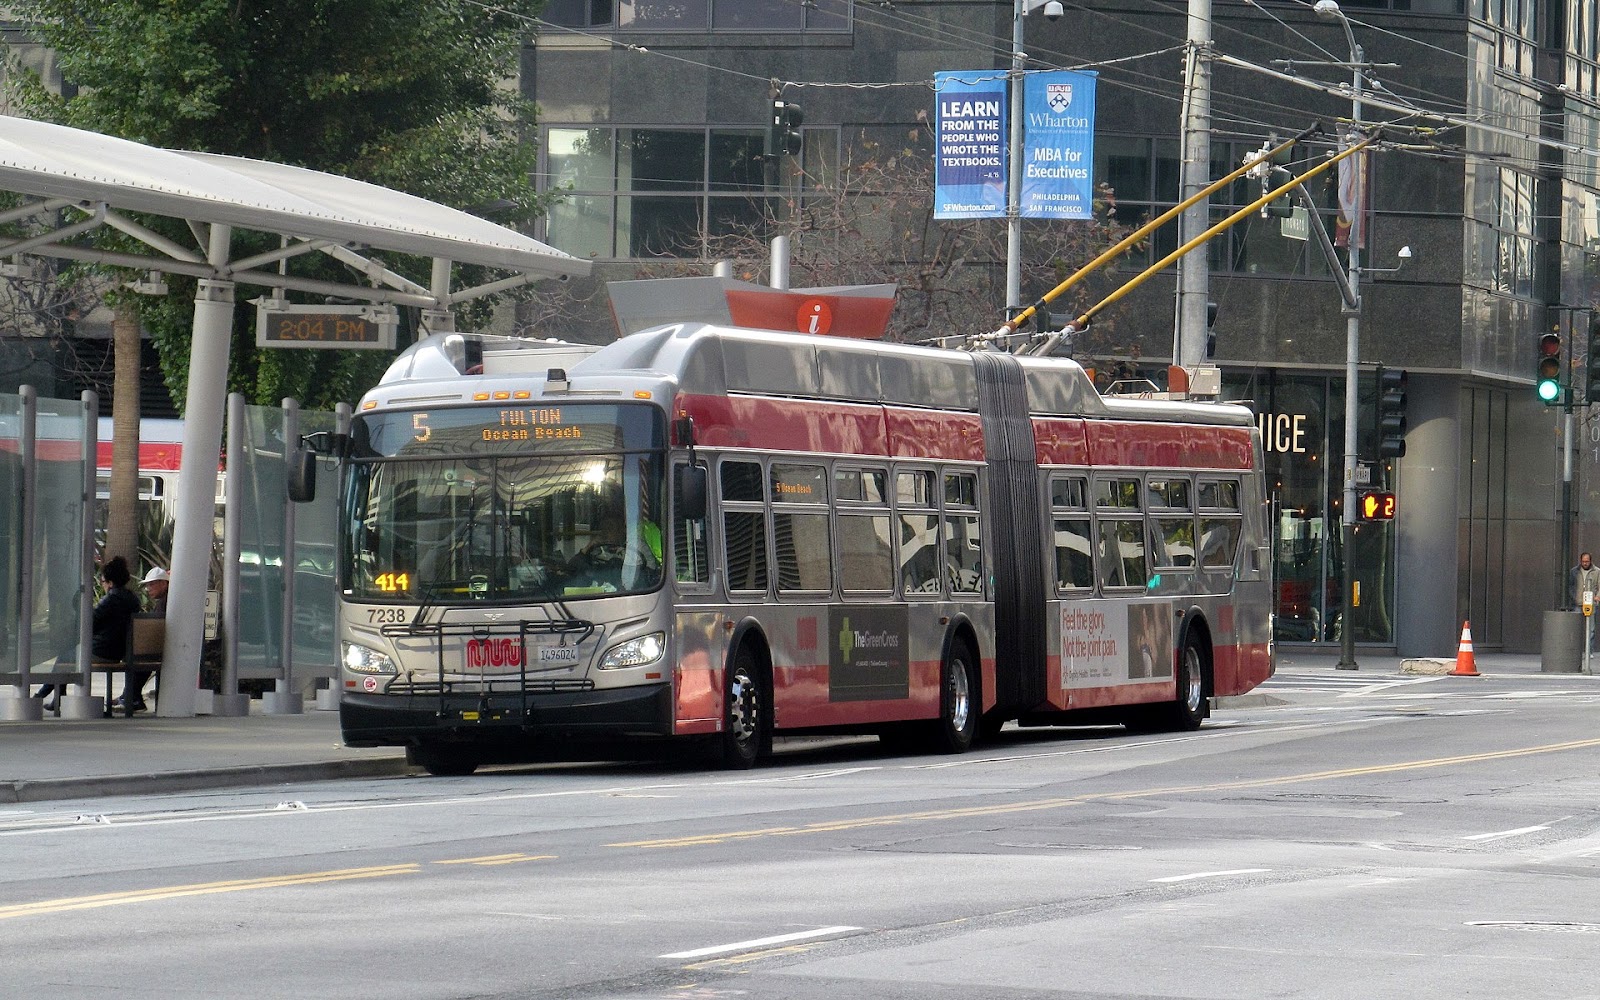
San Francisco Trolley Bus powered by overhead catenary lines.
Photo courtesy of By Pi.1415926535 - Own work, CC BY-SA 3.0, https://commons.wikimedia.org/w/index.php?curid=64552498

I am not a fan of Battery Electric Buses (BEBs) due to their expense and operational difficulties. We need to stop burning stuff that produces greenhouse gases, but we also need to provide the most bus service for the most riders possible. 

Buy American mandates for US transit agencies have them in a bind with too few American BEB manufacturers, all of them in and and out of bankruptcy, and difficulty getting repair parts. In fact, many BEBs have been mothballed despite billions spent on them and specialized charging infrastructure. 

I had always wondered why we didn't utilize the century-old technology of electric trolley buses powered by electricity from overhead lines (called Catenary). In California, only SF Muni still operates them in 2025. 

What is stopping other California agencies like LA Metro from using Trolley Buses? They are cheaper to buy, maintain, power and store. You need fewer of them compared to BEBs, which need to be taken out of service during the day to recharge. Trolley Buses can even be driven off-catenary using small (compared to fully BEBs) on-board batteries. 

CEQA happened. In 1970, then governor Ronald Reagan signed the California Environmental Quality Act into law. 

CEQA requires that any project needs to be evaluated against the status quo. Criteria include Visual Impact Assessment. Since a landscape with overhead wires always scores lower than the same landscape without overhead wires, you can't install them anywhere that doesn't have them. San Francisco still had overhead wires, so they were able to maintain and upgrade their overhead wires without running into CEQA veto points. Los Angeles once had catenary, but had already removed them by 1970s. 

There was no going back--until AB 2503 passed in 2024. Now, electric wires/catenary for buses and trains can be built without running the gauntlet of decades (yes, decades) of CEQA lawsuits. 

In May, 2025, we visited Berlin and took articulated electric buses, some that can run hybrid on and off catenary wires. They ran in dedicated bus lanes, often next to wide bike lanes. It was so easy to get around by bus in Berlin. We loved it. 


Look at the size of that bike lane!

We rode both German and Polish-built buses, which run on different lines. 


Narrower bike lane this time, but that's because road width is tight on a bridge. 

I was so impressed with the Solaris hybrid articulated buses. They can run up to 1/3 of the time off-catenary, can recharge while on catenary, and they never need charging during the day. They can move up to 100 people all day without interruptions of service. This means fewer buses serve more people. So cost-effective and clean. 

Oh, the 100-passenger bus needs only a 700 kWh battery. Compare that to the Tesla Y's 60-80 kWh to move 1 person around. Saves on material costs, too. 

Anyway, they accelerate/deaccelerate smoothly with just a quiet whirr. We really enjoyed sightseeing from inside the buses. I also rode my first double decker bus!

More on Berlin and our April-May Germany trip later. I still need to post pictures of our bicycle cruise on the Mekong Delta in February. My husband jokes that we save carbon by not driving (in Los Angeles!) and avoiding beef, and then blow our carbon budget on international travel. Fair enough. 


Monday, January 27, 2025

Why Building Expensive New Apartments Makes Old Apartments Cheaper

I often hear from people that I normally agree with on other issues that supply and demand don't apply when it comes to housing. I don't know why people who study housing all say one thing, and a corner of the advocacy space says another. I do have experience with Berkeley housing markets (albeit from the 1980s) and that soured me on rent control as the sole method to manage scarcity of an essential good. 

Berkeley has long had a rent control ordinance and a rental registry to ensure compliance. Jeff Baker wrote some Python code to visualize the public data and it is fascinating. As a scientist, I always like to see real world data compared to idealized models of how things work. 

The Rent Board of Berkeley, California maintains an Online Rent Registry with information about apartments and other dwellings under regulation by the city's rent control laws. The Registry lists the initial rent of a rent-controlled dwelling, and all of the subsequent annual adjustments.

The Registry tells us a bit about the city's rental market over time. Using the initial rent of tenancies still active at the present, we can deduce the market price of apartments in the year the tenant moved in. The chart below gives the median initial rent each year 1996-2022, adjusted for inflation to 2022 U.S. dollars, for tenants who are not listed as owners, managers, or any other special class.

Go to his site and read his analysis.  

One surprising thing I learned is that, though rents in rent-controlled units are generally lower than in newer buildings not subject to rent control, they do rise unevenly instead of monotonically rise the maximum amount allowed. Rent-controlled rents plateau during recessions. 

The population of apartments in the above figure are all older buildings, due to the nature of rent control in California. The rents shown are significantly below the advertised rents of the same size apartment in a new building in Berkeley. For example, some new buildings are currently advertising 1-bedroom apartments for around $3000 and 2-bedroom apartments at about $4200. The rents in old, regulated buildings are discounted by about 1 bedroom.
So he took the initial rents for newly-signed leases, and deflated them by the CPI from BLS All items in U.S. city average, all urban consumers, seasonally adjusted using a constant 2022 dollar (when I think he wrote/started this project). 

There's a lot of hand-wringing about how today's building code requiring two staircases results in mostly studios and 1-bedroom apartments with a few 2-bedroom units on corners. So, new construction is heavily weighted towards smaller units. Not too great for families, but fine for 1-2 person households. 

Older units subject to the most stringent rent control have to report the new leases within 30 days of signing the lease. Newer buildings only have to report annually, Each dot represents the average rent for initial leases signed in one month. Note that the dots are really tiny, meaning hardly anyone moves. In a university town of 100,000+ population, less than 20 people move into 1-BR rentals. 

In Dec 2017, 18 new leases for 1-BR apts were signed at an average rent of $2267 (2022 dollars). A bunch of new apartment buildings came online in downtown Berkeley, allowing people to move. That is when the bubbles become larger. By Dec 2024, 27 new leases for 1-BR apts were signed with an average rent of $1950 (2022 dollars). At the same time that the rent stock got more numerous, more modern (new units), it got cheaper in real dollars. 

Remember, older rent-controlled units have to report monthly. Newer buildings can report annually. The bigger circles are from the months that the newer buildings reported en masse, so the average new rents for those months are higher.  In August 2023, a whopping 785 new leases for 1 BRs were signed.

Notice how the small circles are falling faster than the big circles? 

What's going on here? I heard that building new, expensive apartments makes rents in older units more expensive! 

The data in Berkeley shows that new, expensive apartments makes rents in older units decline! Score 1 for the housing economists who say that supply and demand applies to housing. 

There are fewer new 2-bedroom apartments because of the International Building Code (IBC), but the same effect is noticeable in the 2-BRs. 

In Dec 2017, 14 new 2BR leases were signed for an avg of $3124. 
In Dec 2023, 18 new 2BR leases were signed for an avg of $2529. 
In Aug 2023, 275 new 2BR leases were signed, which is less than the 785 new 1BR leases for the same month. (Thank-you IBC.)

IBC hardly ever results in new 3 BR homes. But, when you have too few smaller apartments, people move in with roommates and outcompete families with children for the larger units. Even without building new 3 BR homes, just allowing people living with roommates who would rather live on their own (or in smaller households with fewer roommates), causes the rent for larger homes to stop sharply rising. 
In June 2017, 19 new 3BR leases were signed for an avg of $4534. 
In June 2023, 110 new 3BR leases were signed for an avg of $4728. 

The circles also get larger, meaning that there are more vacancies that allow people to move to something that better suits their needs and desires. That's a win for overall happiness. 

So, rent control provides certainty for incumbent renters, but doesn't allow them mobility if they need a larger or smaller unit. It also makes it impossible for new entrants to the market to find housing. 

Creating new homes, even expensive ones (IBC is expensive to comply with), can lower the rents on older units. 

The economists were right in this instance. 


Monday, October 28, 2024

Vote No on CA Proposition 36

Do you remember when California spent more money on building and operating prisons than on higher education?  I remember.  Those were terrible times for every one involved except for the prison profiteers. 

[We are still grappling with the aftermath as public university tuitions soared, UCs made up lost revenue by admitting out-of-state students instead of qualified in-state students, and student loan balances approached the size of mortgages for their parent's generation.]

Rehabilitation and reintegration into society are hard to explain in a soundbite. They are not as catchy as "3 Strikes and you are out!", but they have more evidence showing that they work and they are more cost-effective. 

I am not going to link to that awful LA Times article about the person who was let out of prison, only to commit a murder. You can always find a few recidivism stories. But, you will rarely find a news story about rehabilitated prisoners who successfully reintegrate into society because they very understandably need their privacy. 

You will also not read stories of the children whose parent came home from prison, possibly on "supervised release" where they wear a GPS ankle bracelet. Even a parent on supervised release can perform childcare so that their co-parent can go to work. This can prevent a family from falling into poverty and repeating the cycle. 

Crime statistics show that crime is going down at the same time that we are using evidence-based principles to decide appropriate punishments/rehabilitation, and to reduce prison populations. This is the time to stay the course. Do not harm families, bankrupt the state, and steal our futures again. 

Criminal justice reform, just like climate change mitigation and adaptation, requires clear-eyed analysis of the complex issues, and consistent practice of evidence-based solutions. It takes time, but it is worth it. 

While you are voting, please reflect upon why it is easier to build prisons than college dorms and vote for people who will help build college dorms and more housing in general. 

Need more convincing? Read League of Women Voters California's recommendation of why to vote no on 36

Read all of LWVC's Ballot Measure Recommendations

Saturday, September 07, 2024

Cool Roof 2: Cool Roof, Cool City

 Los Angeles is in the middle of a record-setting (again!) heat wave. NWS reposts that LAX airport, along the coast, recorded a high of 102 F (old record of 99 F in 2020) while Downtown LA hit 112 F. 

Several people asked about our Cool Roof and Heat Pump. I wrote about replacing our asphalt shingle roof with a composite shingle "Cool Roof" back in 2012. Our roof went from reflecting 30% of solar heat (absorbing 70% of the heat) to reflecting over 70% and absorbing less than 30%. If you look closely at the shingles, they incorporate bits of recycled glass, tumbled to a frosted gray, green or blue. From a distance, it looks like a light-medium gray. You wouldn't even know it was a cool roof unless I brag about it. 

When you install a cool roof, you mitigate the Urban Heat Island (UHI) impact of urbanization. "Georgescu et al. (2012, 2013) reported that summertime statewide warming due to projected urban expansion for Arizona could be reduced by about 50% with the complete integration of highly reflective cool roofs." SoCal would likely be similar. 

So, which should you pick, a cool roof, a green roof, or a photovoltaic (PV) solar roof? The answer turns out to be dependent on local climate and geography. Materials change the radiative impact of buildings. They can reduce the amount of heating during the day, but they can also disrupt the amount of cooling at night. They can heat the air above the city, strengthening the urban heat dome. There are so many variables, it takes a radiative full-physics model and a supercomputer to track them all. 

Take the case of Phoenix and Tucson, studied by Salamanca et al: Citywide Impacts of Cool Roof and Rooftop Solar Photovoltaic Deployment on Near-Surface Air Temperature and Cooling Energy Demand. "In Arizona, cool roofs reduced daily citywide cooling energy demand by 13–14%, while rooftop solar photovoltaic panels reduced them by 8–11% (without considering the additional savings derived from their electricity production)."

But, if you were in London, Brousse et all found that cool roofs would be most effective in reducing extreme heat. Nonintuitively, green roofs wouldn't make much difference overall (but help during the day). Vegetation makes a minimal difference on a city-wide scale. Rooftop solar might have an overall heating effect, as would running AC. But, if the rooftop solar energy was used to run AC, and people could take shelter from the heat indoors, they could be a net benefit. 


Governments can encourage behaviors good for society and suppress behaviors that are detrimental with subsidies/fines. If you were running the government, you would like to find out the cost-effectiveness of different interventions (eg subsidies) and fund what gives you the most bang for the buck. If you had even more money, then fund the slightly less effective but still helpful stuff. 

COOL ROOFS reduce heat experienced inside the buildings and in the urban environment. Require them in new construction. Replace dark roofing materials with cool roofs first. If you have money left over install rooftop solar. 

In 2012, I got a 10% tax credit on the cool shingles we used, but that is only a small amount compared to total cost of installation.  The shingles cost the same as the darker colors in the same product line that absorbed more heat and didn't qualify for the tax credit. I didn't need a nudge of a few hundred bucks to do what I knew would make my house cooler. 

Adding rooftop solar was not on my radar back in 2012 because I figured that the prices were still high and technology was still changing. A few people in our neighborhood installed them, but they were much bigger energy consumers than we are. We hadn't installed a heat pump yet. 

BTW, Lawrence Berkeley Laboratory puts out an annual pricing survey called Tracking the Sun, with useful data on actual installed prices of solar systems. 


DIGRESSION:

When we got our heat pump back in 2020 (or maybe 2019?), people asked why we didn't get solar panels as well. I dragged my feet because the rooftop solar salesmen (and they are always bros) were so sleazy, and I also didn't want to buy anything made with forced labor. I was waiting for the solar supply chain to clean up. I am also waiting until I replace my roof again. The timing just wasn't right. 

Besides, I know that California has an excess of solar power during the day. It used to be worse, but utility-scale batteries have been soaking up the excess solar power so that we need to shut down feed in (curtail) solar farms less than in prior years. For the last month, we have been curtailing solar farms during all the hours rooftop solar would have produced at my location. 


Even during the heat wave this week, we had to curtail cheap solar farm power. 


Yes, even during the hottest day ever (so far) in LA. 


There just wasn't much value-add for society if I add solar panels to our cool roof. 


Thursday, February 01, 2024

True Cost to Own 2

I just heard a cringe podcast where they were discussing lack of street parking near our city's high school. One speaker said that, our region is hilly, and eBikes help with that. But not everyone's family can afford an eBike so many kids have no choice but to drive. 

This is a classic case of car brain where people no longer notice the high cost of car culture and car ownership. 

When our teen daughter was added to our car insurance policy, our premiums when up ~$2,000/yr even without adding another car. If your teen can delay becoming a driver by just one year, you can buy a decent eBike, lock, lights, and panniers. You will also save hundreds of hours chauffeuring your teen. 

Another year, another AAA "Your Driving Costs" report has dropped. It's time to update True Cost to Own. The cost of owning and operating a new vehicle in the US has increased to $12,182 in 2023.  New cars cost 4.7% higher than in 2022, but used cars went down in price. 

Remember, this is an average over the entire US, and Los Angeles tends to have higher insurance and fuel costs (both gasoline and electricity). This is also for the average new car sold which, at $34,876, is significantly cheaper than the typical new car I see in our school district (Tesla Y, ~$45,000-$52,500). 

The typical behavior in our area is for the parent to buy a new car and give their old car to the teen. Then they park the old car out on the street, making street parking even scarcer. It's not more people making street parking scarcer. It's more cars. 


I'm doing the calculation a bit differently this year, inspired by a LA Times article about a Culver City High School teacher that had their students run the numbers on car ownership over a lifetime. I don't get into the messiness of predicting inflation rates or marginal tax rates. 

Suppose you don't buy that new car and save that money instead in a balanced mutual fund. Using the Vanguard Benchmark Returns on Target Retirement Funds, you can expect to get ~8.25% long-term returns 


Using an online Savings Calculator, assuming 
Annual Savings: $12,182
Annual Increase in Savings: 3% (car costs have been going up faster than that)
Returns: 8.25% from balanced funds above
Taxes: 0% (if in tax-advantaged retirement account)

Then you have $1,0983,667.47 in year 24. 

Start when you turn 16, and save a million dollars by 40. 

In 50 years, age 66, the car-free saver will have $11,199,484.63. 

But, wait, you can save $18,264 pre-tax (33.3% combined CA+Fed tax rate) while $12,182 car costs are post-tax. But then you pay taxes on withdrawal from retirement accounts. So the amount will vary, but the message is the same. Living car-free or car-light (my family) is a huge money saver. 

Now I want to talk about the really pernicious part about car ownership, the externalized costs borne by others. 

This is painfully obvious to me every time I go to city council to beg for a bike lane and am turned down because "poor people need a free place to park their vehicles" on the public streets. 

I am charged the same price for my groceries whether I use the supermarket's huge and hugely expensive parking lot. I walk or bike to post of my groceries. I even bike to Costco for some of my trips. Yet, I pay for that parking lot. 

Even though road wear is proportional to axle weight to the 4th power, I am paying property taxes to maintain my city streets even though I get around on a 50# eBike instead of a 4,500# electric SUV. 

A 2020 Harvard Kennedy School study found that Driving is more expensive than you think. "Massachusetts' car economy is roughly $64.1 Billion, with more than half of that coming from public funds."

"Using publicly available data, the authors put the annual public tab at $35.7 billion, which amounts to about $14,000 for every household in the state. Those that do own vehicles pony up an additional $12,000 on average in direct costs."

You might nitpick that Massachusetts is snowy and snow plows are expensive. But, a 2021 Ulupono Initiative study in Hawaii found that "Public costs amount to roughly $15,000 per taxpayer ($24,400 per household), annually, even if they don’t own a car."

Furthermore, "Personal vehicles cost an additional $16,200 per household per year. With the public costs above, each household’s costs total $40,600 per year (or 51 percent of pre-tax income)."

Then there is the opportunity costs of the land. "Land value of public lands dedicated to road, highways, and parking is $3.9 billion, covering about 14 percent of the available urban land in our state."


Next time you see me bicycling for groceries, thank me for subsidizing your roads and parking. And drive carefully and slowly around cyclists. Dangerous road conditions are what's holding back the 60% of the public that is "interested but concerned" about riding bicycles. The more of us that are bicycling; the fewer cars in front of you, competing with you for parking, polluting your air, costing your city big bucks in road repair and climate change adaptation...


“Existing law requires the driver of a motor vehicle that is passing or overtaking a bicycle to do so in a safe manner, as specified, and in no case at a distance of less than 3 feet.

This bill would additionally require a vehicle that is passing or overtaking a vehicle to move over to an adjacent lane of traffic, as specified, if one is available, before passing or overtaking the bicycle.”

Drivers are required to pass cyclists with at least 3 feet of clearance (and that is from the furthest point of my bike, including handlebars and cargo).  If there is more than one lane, drivers are required to change lanes before passing cyclists, just as they would do when passing another vehicle. This is why it makes sense for cyclists to ride 2-3 abreast in a pack instead of strung out in a single file line. Drivers can pass them in a shorter distance, making it safer and more convenient for everyone. 

This is now in California Vehicle Code 21760


Tuesday, June 06, 2023

We're unprepared for the Silver Tsunami

I was discussing Metro's Traffic Reduction Study for pricing roads (aka Congestion Pricing) to discourage driving. This very unambitious plan is targeting just three areas:
  1. DTLA (cordon area)
  2. I-10 between Santa Monica and DTLA (toll road)
  3. I-405 through the Sepulveda pass, including canyon roads (corridor pricing)
I wrote an analysis from a data-based and science (climate change, pollution) perspective, and encountered a lot of pushback. Everyone in the group is a driver, but I'm the only utility bicycle rider that rides in traffic. Others ride recreationally on the beach bike path or on low-traffic foothills roads. 

The reflexive response was, "What about the low-income (or moderate income) drivers?"

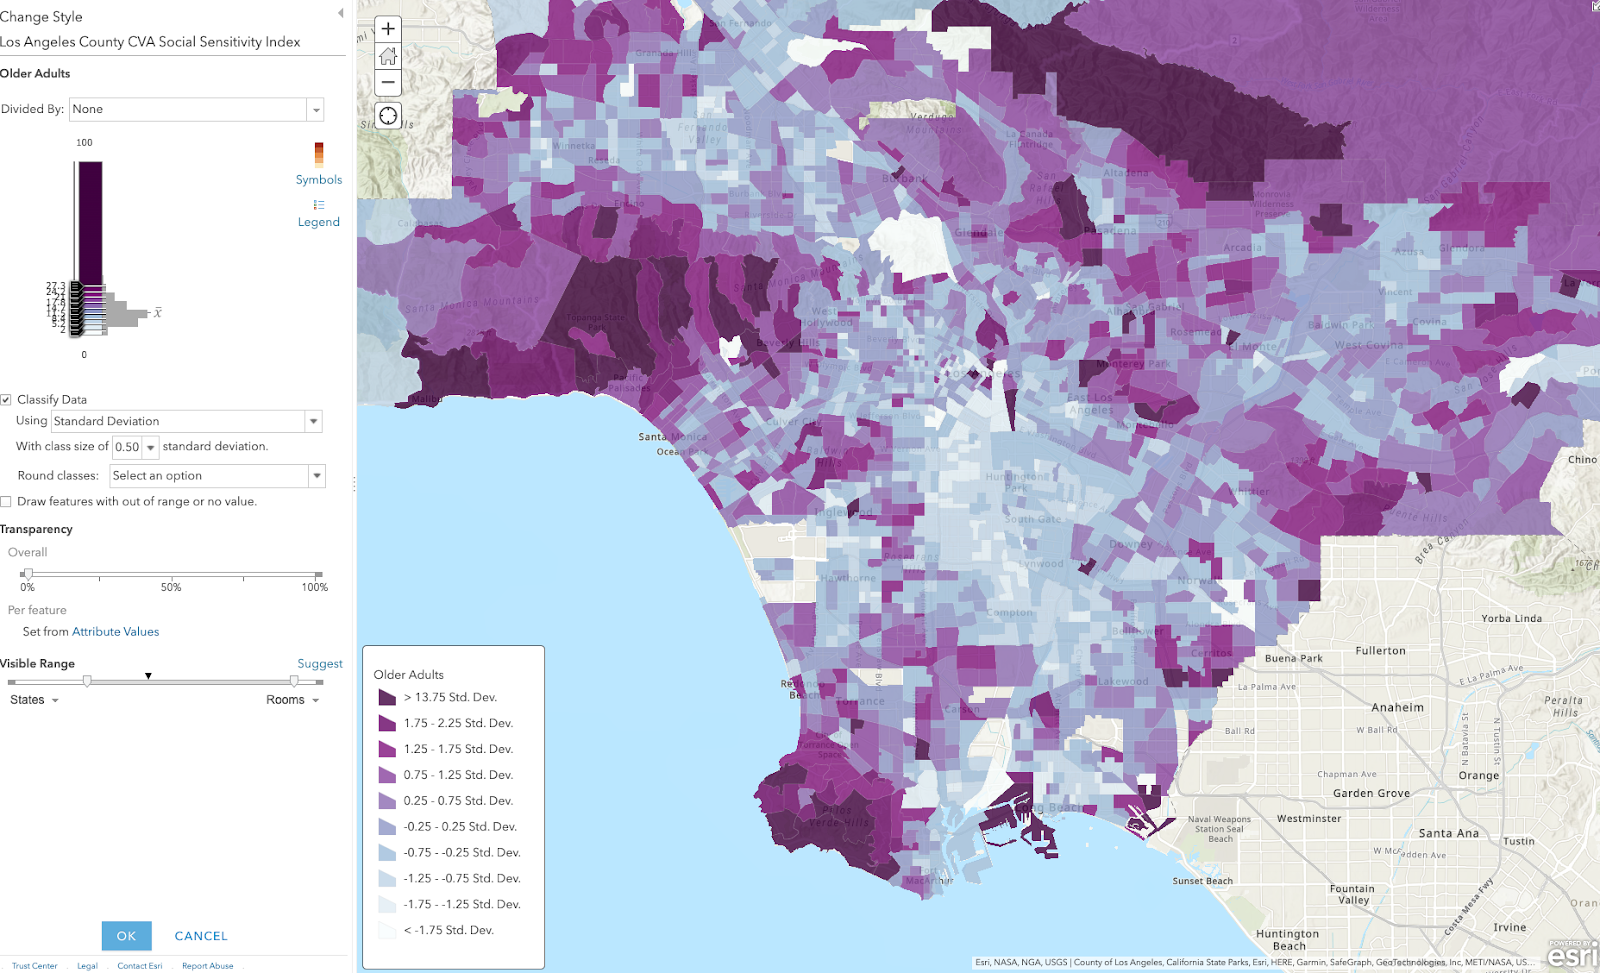
I was making maps using data from Los Angeles County CVA Social Sensitivity Index and was struck by how some areas of LA County are much older than others. That is, the coastal and hill sections have extremely high proportions of seniors.  It's especially dramatic if I map the census tracts by how many standard deviations they are from the mean. 


Darker magenta areas have more people over 65 years old than average. Bluer areas have fewer seniors. 

By implementation time for congestion pricing, today's 65 year olds will be > 73 yo. How long do you think they will be able to drive mountain roads? 

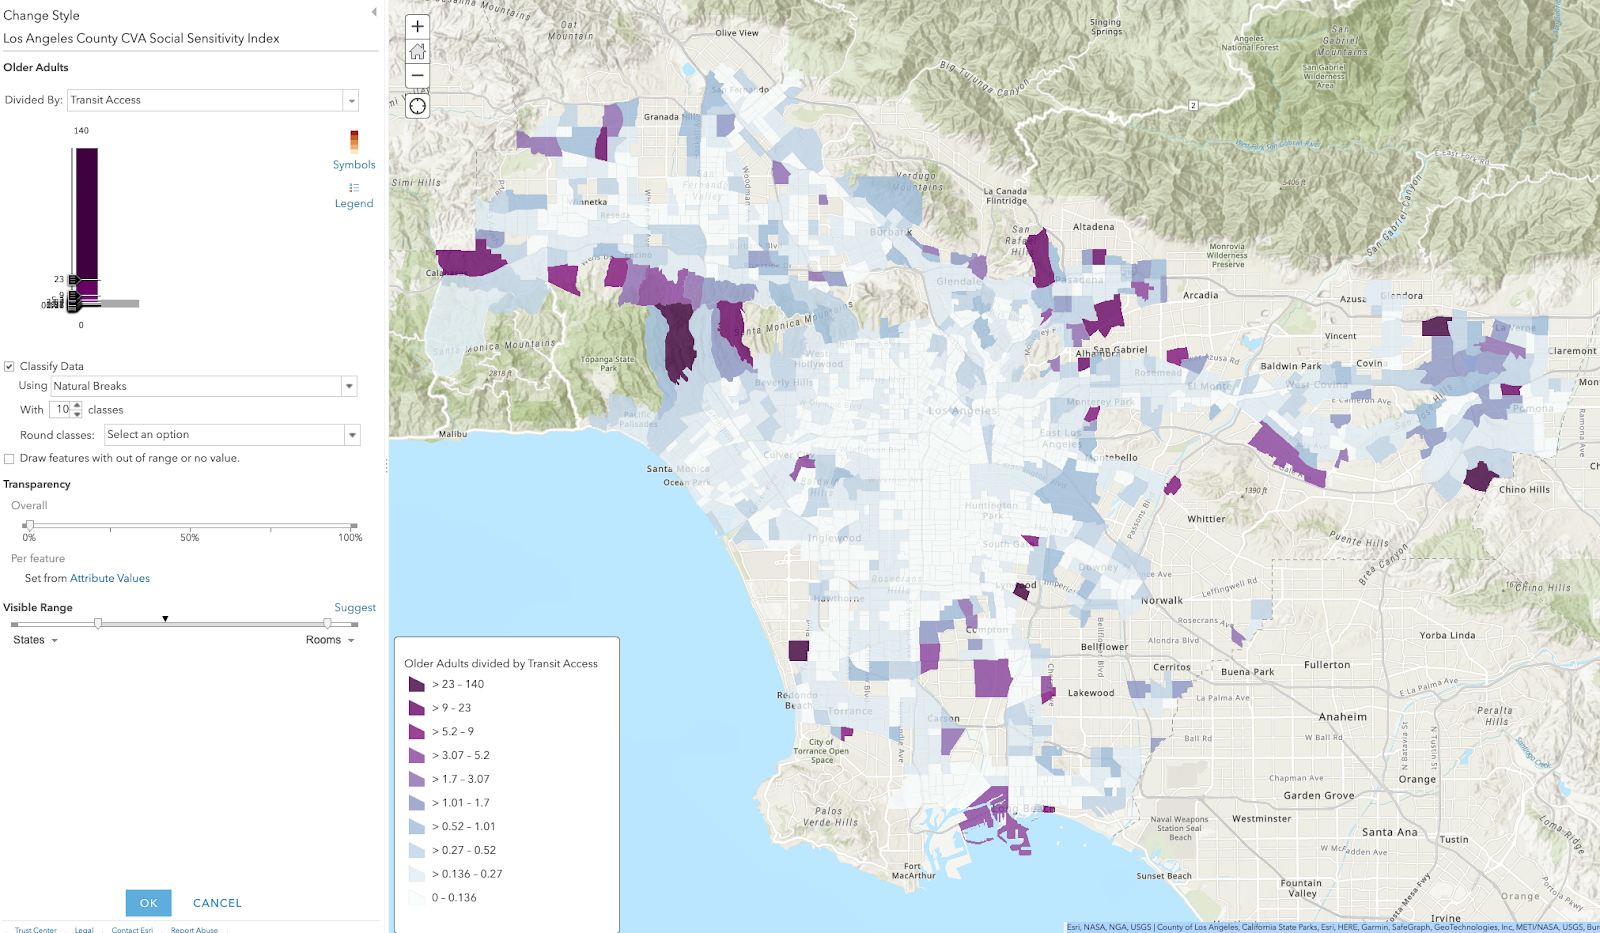
It gets more grim when I divided by transit access. These are high senior population percentage divided by standard deviations from mean transit access (which is already not great in LA County). 


Those are areas where we either need to improve transit and micro-mobility (for electric wheelchairs or sit-down scooters), or we need to move seniors out. Because people like to stay near their community, my preference is to coax them down from the canyons to multi-family housing where they are probably already driving for shopping, services, dining, recreation, or work. 

This leaves some voids in the flatter areas, which can be fixed by street space allocation, improved bus service, and some apartments near bike lanes & bus routes (hello, East Manhattan Beach). 

Anyway, congestion pricing is not going to harm seniors living in the canyons of Bel Air, Malibu, or Brentwood. They will soon age out of driving. It might cost them more to receive senior care in their homes if their caregivers have to pay to drive there. 

On the other hand, if it does improve traffic, then lower income workers will have more time for paid work and less unpaid time sitting in traffic. E.g. they can accept more clients per day because they will spend less time driving. This starts a virtue cycle where they won't have to pad their per visit charge as much, making senior care more affordable. 

You know what would create less traffic? If we let seniors live in congregate settings, where they each have their own small apartments, but caregivers are on site and can simply walk between clients. That would help alleviate traffic, the shortage of elder caregivers, and improve caregiver pay per hour. 

Instead of thinking about changes with fear, look critically at what is not working and how we might improve the status quo. 


Wednesday, May 10, 2023

Guidance for the Metro Active Transportation Corridor: Redondo Beach Blvd Survey from a Local

Urgent Action Alert 

Deadline Extended to May 30, 2023 May 15, 2023 so read on and fill out the survey now 

I need you to fill out a public input survey about a vital active transportation project for Redondo Beach and surrounding cities in the South Bay region of Los Angeles County. This is our chance to reverse some of the damage wrought by past auto-centric road design in North Redondo Beach and allow those who can ride a bike to make school and shopping trips with confidence that they can make it home alive and in one piece. 

There's also a Story Map about the Redondo Beach Blvd Active Transportation Corridor Project with more information. 

Short version if you are in a hurry:

The current street allocation with car parking on both sides and massive SUVs speeding down our streets is not safe or welcoming for cyclists. The proof is in the declining bicycle mode share. 

When filling out the survey, select the options that give a protected bike lane every time. Scroll down past the background info to see my recommendations and why. 

Paint is not protection. Never select an option with a paint-only bike lane in the door zone. If someone opens a door, a cyclist in the door zone will be knocked off their bike and suffer grievous injuries. If they swerve to avoid the door, or are knocked into the traffic lane, they could be killed. No one wants to be killed or have their child killed while riding to school. 

Two-way cycle tracks are a good option, particularly near schools. When kids are arriving or leaving school, there will be a lot of traffic congestion on all modes. But cars are particularly dangerous. The less car traffic they cross while leaving the congested area, the safer they will be. Keep them on the school side of the street, with wide lanes so that there is passing room in the bikeway (keep the kids out of the car traffic lane). 

Plastic poles are not physical protection, but likely the best we can get as a first step.  Plastic poles can be replaced with bollards or concrete barriers later if we allow enough buffer space to install the plastic poles in the first place. Do not let the perfect get in the way of actions we can do right now. 

You can skip the background (but I hope you read it when you have more time).  

Background: The Connection with Schools

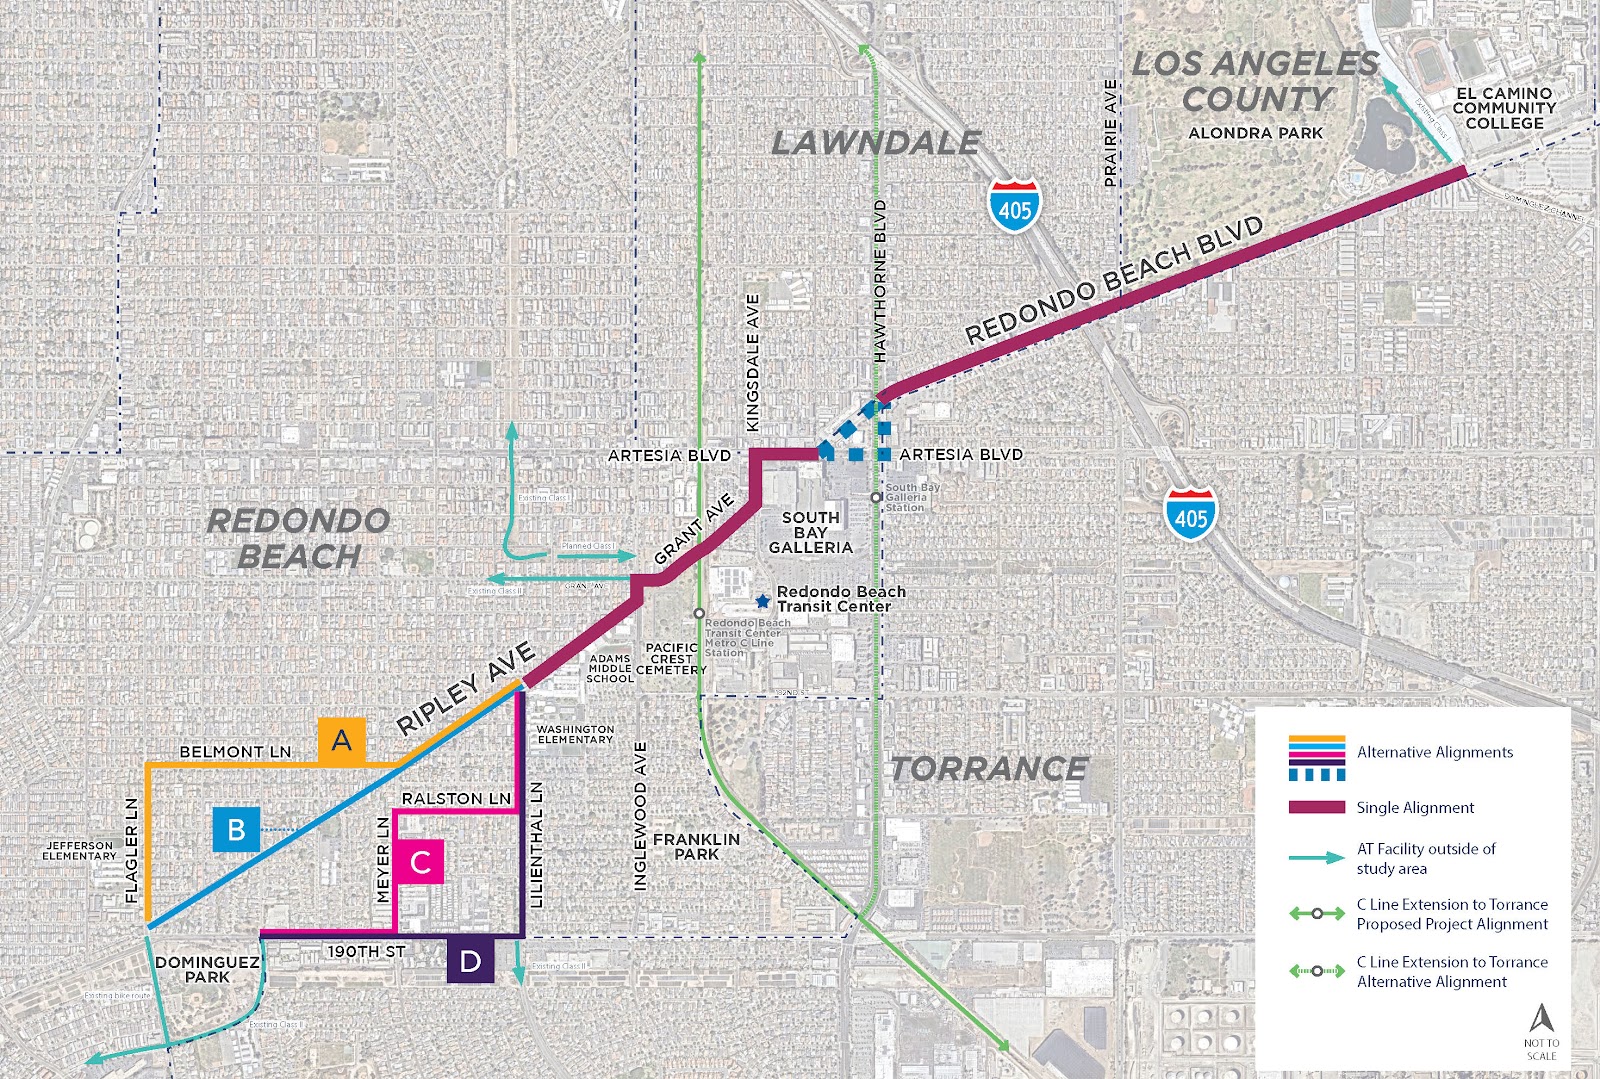
The project area below was originally going to be along the old freight route from Redondo King Harbor to the inland rail routes, but Ripley was found to be too steep (several areas with 15% grades) to be feasible for safe cycling. 


A Redondo Beach traffic study determined that 30% of the city's AM/PM peak traffic is the child school run. This travel corridor includes

  • Adams Middle School: 1066 students: 6-8 grades
  • Washington Elementary School: 801 students, K-5
  • Jefferson Elementary School: 509 students, K-5
That's almost 2400 K-12 students arriving and departing each day on this corridor. 

But that's not all, because all students in Redondo Beach Unified School District (RBUSD) attend Redondo Union High School (RUHS) in South Redondo Beach*. Jefferson ES students also attend Parras Middle School south of RUHS. 

Assuming 350/grade at Adams MS and 90/grade at Jefferson ES, 

350*4 + 90*7 = 2030 students cross 190th Street to attend school and return home each day. 

About half of all RBUSD students traverse this corridor every school day.

But that's not all; El Camino College (ECC, 22,000 students, many from the Beach Cities) is on the eastern end of this travel corridor. Some RUHS and MCHS students do concurrent enrollment and take classes at ECC while they are in HS. Due to many factors, including cost and lack of housing at UC campuses, a large number of students are enrolling in grades 13/14 at ECC before transferring to a 4-year college/university. 

When filling out the survey, think about what you would send your kid to school on. Think about what you would be comfortable riding on as you accompany your younger child to school or run your errands. I ride this area 1-2x/week to run errands in North RB or West Torrance. I want better infrastructure for my safety, too. 

Watch this video of the horrifying existing conditions as ridden by two fit MAMILs (Middle-Aged Men in Lycra). Would you ride these steep hills? Next to fast-moving busy traffic?


Here's another video of the area where Kyle, an area father, rides his kids to preschool. 


My opinionated guide for the survey choices and why they matter: 

Every cross-section shown is facing either Eastbound or Northbound.

Q1: For the westernmost portion of the corridor, which alignment(s) do you prefer? 


I picked D because that would give us a 2-way cycle track on Lilienthal and the longest length of protected bike lanes on 190th. 190th St is also the only way to avoid steep hills. 

The problem with B: The first video shows just how steep Ripley is. Notice that the lead cyclist on a light road bike has trouble getting up the hill (and the trailing cyclist with the camera is on an eBike). Going up a 15-16% grade is difficult, but going down them is downright dangerous. Do not send kids on this route. 

A and C are better, but still steep in some sections. Also, if those are the official routes, there will not be likely any road changes except Sharrows, which are shown to be more dangerous than not doing anything

Only Option D along 190th St will yield any road space allocation for cyclists. 

What is a Sharrow? 

Why are Sharrows so dangerous? 

Q2: The proposed street section for 190th St (Alignments C and D) is shown here. How satisfied are you with this proposal?


I picked Very Dissatisfied: These cross-sections are looking towards the east, with Torrance on the Right Hand Side (RHS) and Redondo Beach on the LHS. Cars are coming down the hill from Flagler and often speeding 50 eastbound mph. People drive with the sun in their eyes during the morning and evening commutes. Do you feel safe with just paint and plastic poles designed to bend when run over by vehicles?

I recognize that people living in the apartments in Torrance on the right need overflow parking, but let's swap the bike lane and parking lane. Install a parking-protected bike lane like this one in Long Beach on the Torrance side with breaks to preserve sight lines at each driveway or street crossing. 


On the RB side, I'd like to see real bollards or a curb. Imagine something like these without the parking lane. Images courtesy of National Association of City Transportation Officials (NACTO)


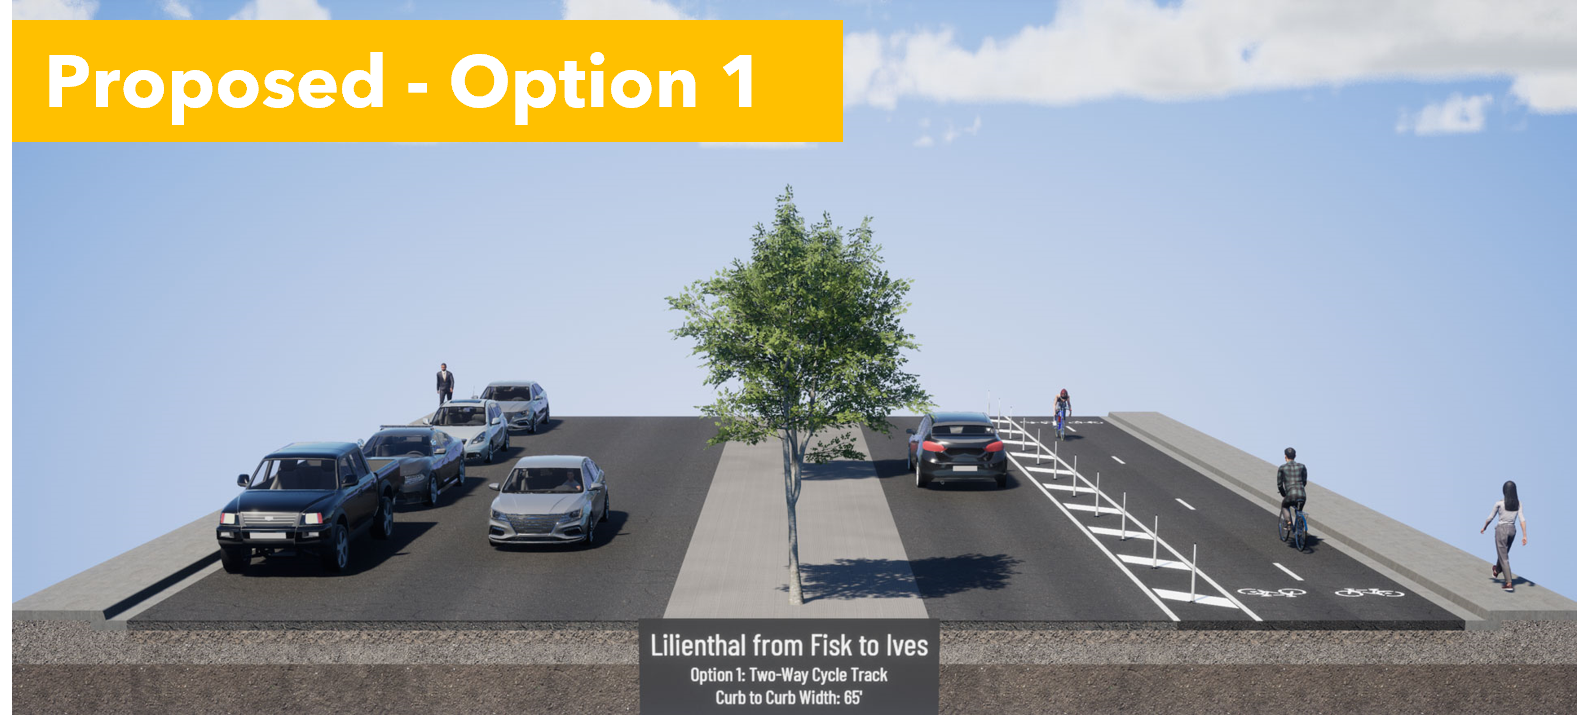
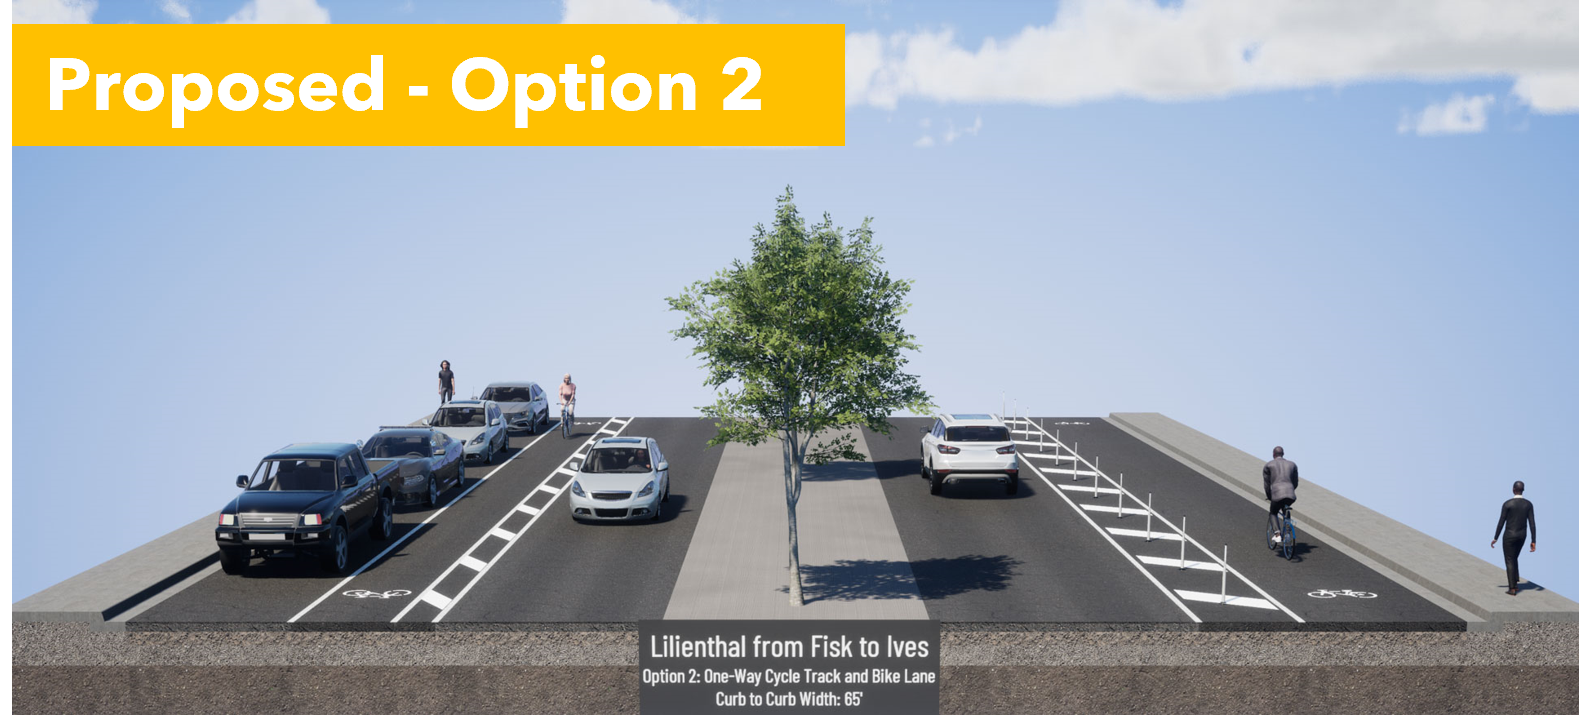
Q3: Select Option 1, the 2-way cycle track on the east side, next to Washington ES. 


Option 1 provides separation from cars, and is wide enough for passing, and allows parents to ride side by side with a child gaining confidence in their bike skills. In 2-way cycle tracks, people riding opposing car traffic are facing approaching cars, so they can see and react to dangerous drivers. It would be better to have solid protection here, but Option 1 gives us room to retrofit with more solid barriers later. 


Option 2 puts kids in the door zone on one side and makes them cross the street to get to school. It's a dangerous situation. 


Q4: Select Option 1, the 2-way cycle track on the east side, next to Washington ES.  


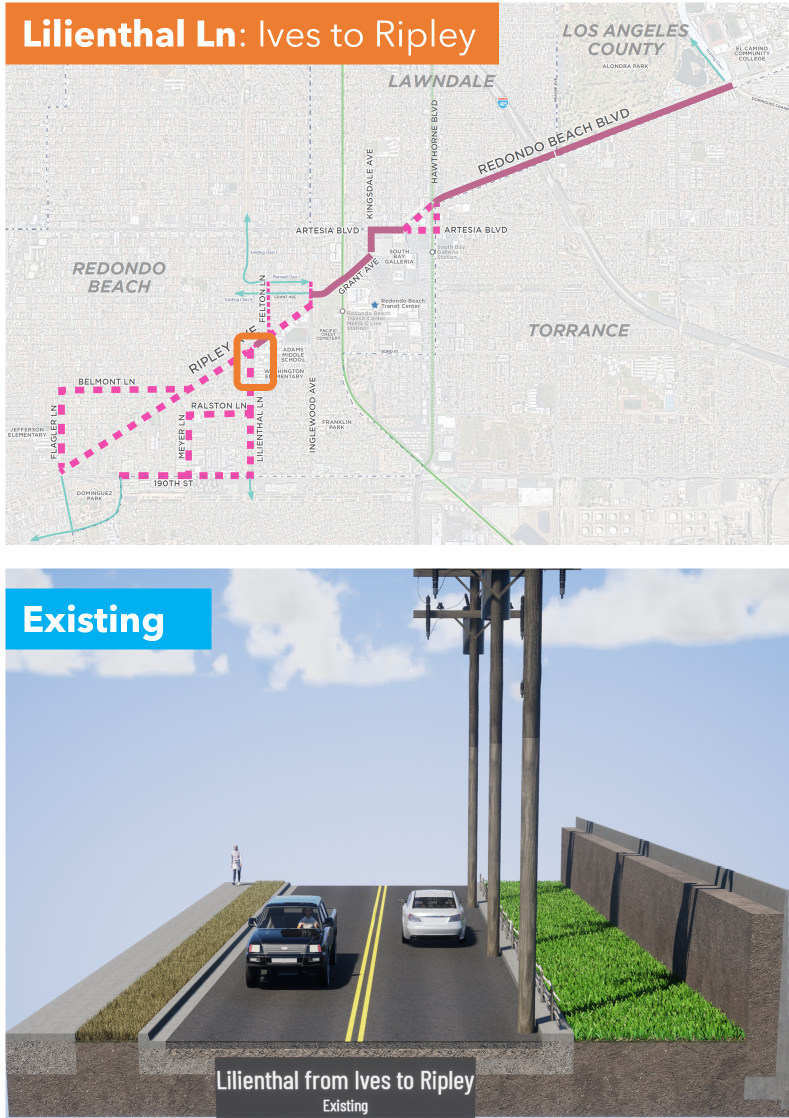
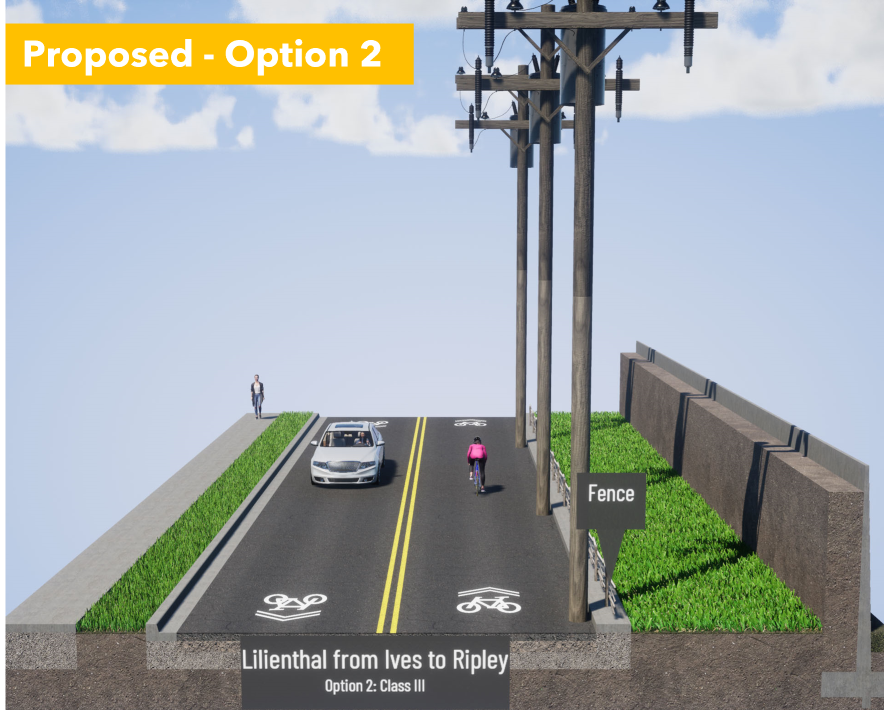
Don't be distracted by the stock visualization image with a tall solid wall. There is currently short solid wall on the parking lot side and a wood and rope fence on the road side. 


Option 1 gives a clear place for kids to ride that is physically separated from cars. The 2-way cycle track would replace the wide grassy area.


Option 2 is sharrows in a place where drivers are more focused on making a turn at Ripley than cyclists approaching from behind them. 

Motorists trying to make a right turn will pull over to the right, trapping cyclists behind them. Small children on bikes and tall, boxy hoods on todays trucks and SUVs mean that parents may not be aware of cyclists in front of them. This has led to an epidemic of frontover crashes where drivers run over people in front of them because they can't see them over their hoods. Or, they look at their screens and forget that there are children in front of them. 

Option 2, sharrows, is a safety disaster. 


Q5 on Ripley: Pick Option 1, the 2-way cycle track on the Adams MS side


Option 1 keeps the kids on the school side as long as possible. It also preserves the car unloading curb space that people are currently using. 


Option 2 puts kids in the door zone, at precisely the time that kids being driven to school are unloading. This is a safety disaster. 


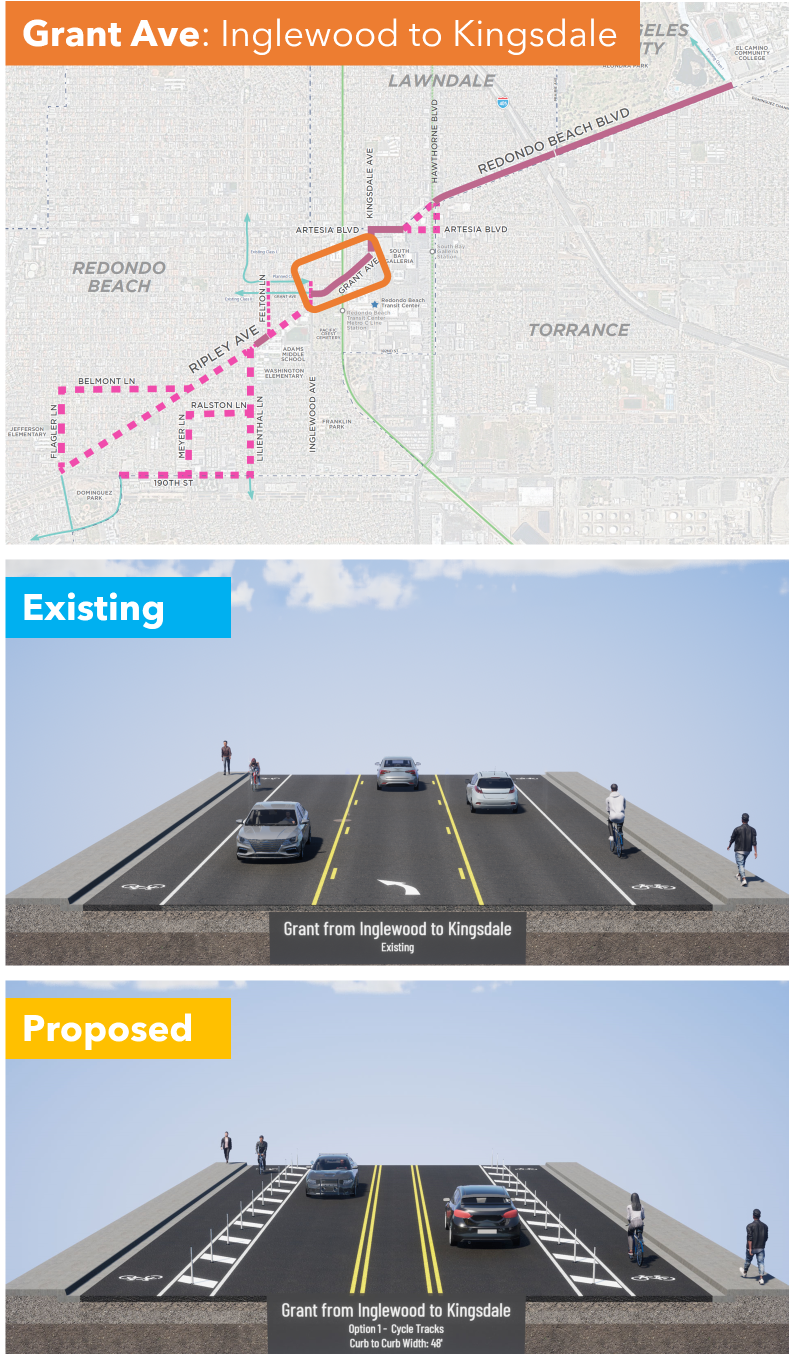
Q6: Grant Ave from Inglewood to Kingsdale; I am very dissatisfied but I selected other and explained why we need solid protection instead of plastic bendy poles


They are proposing paint, a buffered (space separation) and plastic bendy poles. 

This is better than existing conditions, but not safe. Cars pick up speed heading downhill and frequently misjudge the curve, so they end up sideswiping cyclists in the bike lane. We really need a concrete barrier on the downhill (right hand) side. 

I ride by bike to shop at the Galleria and this is the scariest part. I saw a guy almost get killed here. If we want more people to bike through this area, which connects to shopping, the South Bay Transit Center, and the 300 new homes under construction, then we deserve solid protection in this dangerous area. 

I gotta break for lunch but I'm going to hit Publish on this so you can get started. I'll finish after lunch. 

...

I'm back. Stay with me because we are on the home stretch, but the most dangerous one that crosses the 405 Freeway and has the most high-speed traffic. 

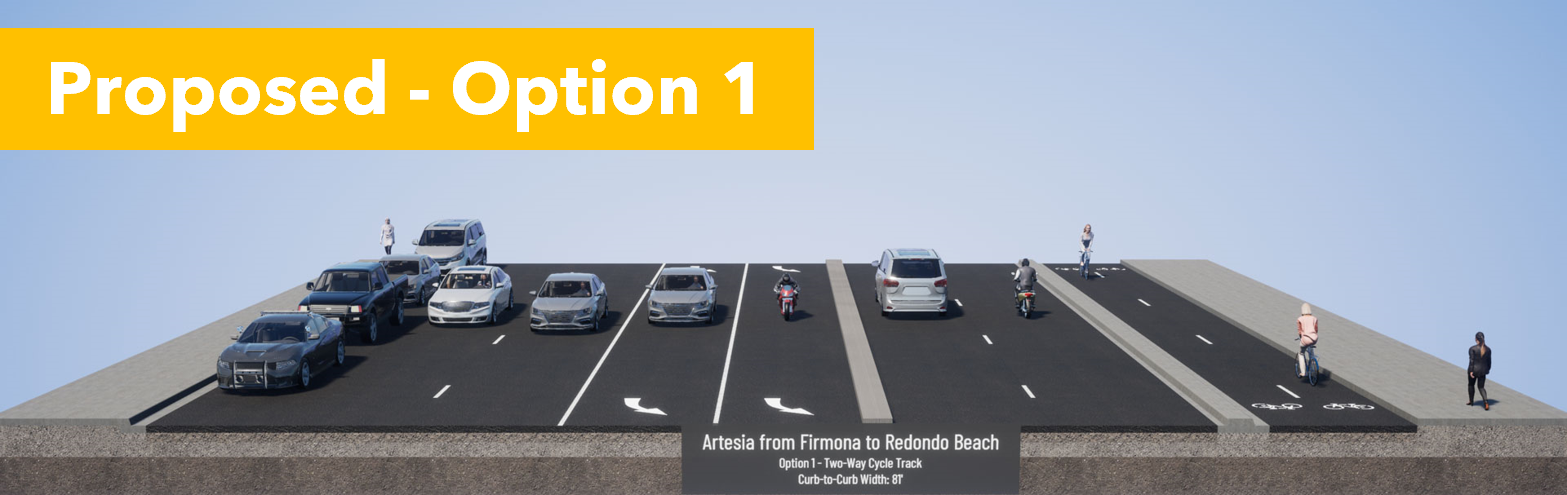
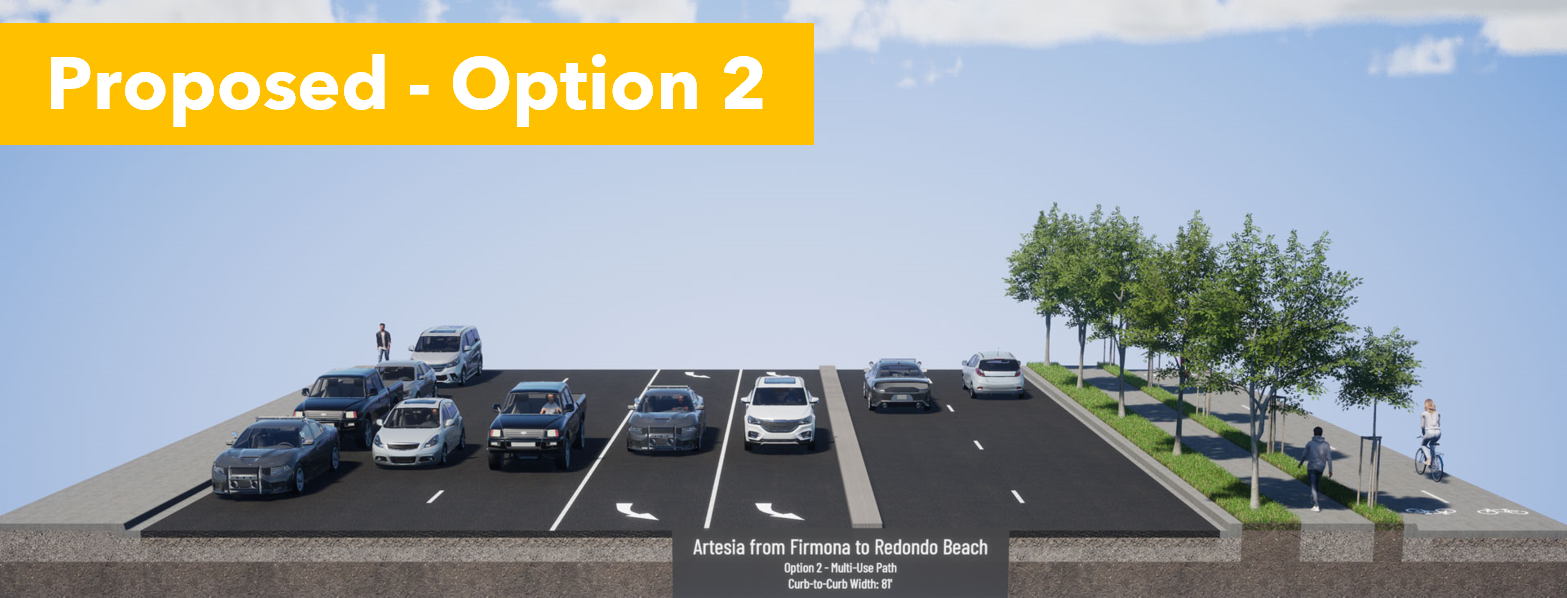
Q7: Artesia Blvd from Kingsdale Ave to Redondo Beach Blvd pick Option 2.  

Existing conditions are awful and you see very few cyclists brave enough to ride here. If they do, they are often on the sidewalk, conflicting with pedestrians. 

Option 1 puts cyclists next to vehicle lanes, but protected with a concrete curb. Pedestrians and cyclists would intuitively understand where they are supposed to be, as faster bike traffic is at the street level. However, this would interfere with bus stops. 


Option 2 puts pedestrians next to the vehicle lanes, but also next to the bus stop. Trees would provide shade. There could be some confusion with pedestrians wandering on the bike path, but that can be solved with good signage.


Our community has experience with pedestrian and bikeways next to each other in the North Redondo Beach Bikeway (NRBB). While there is some spillover, people have already learned where pedestrians and rollers have priority on the NRBB. Option 2 will work best for us and we already know how to use it. 

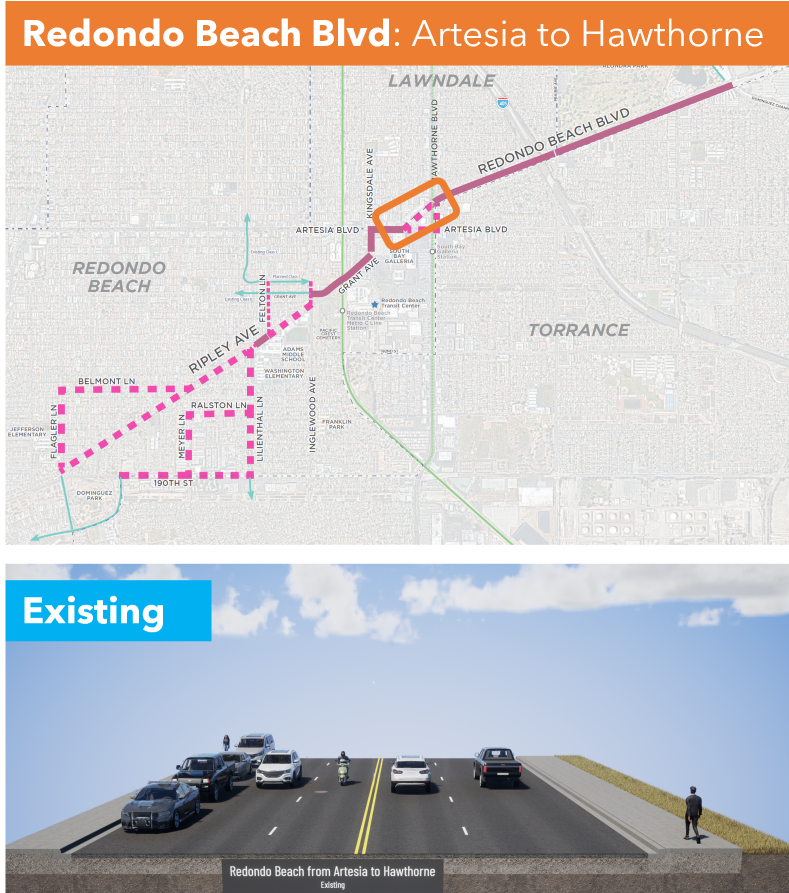
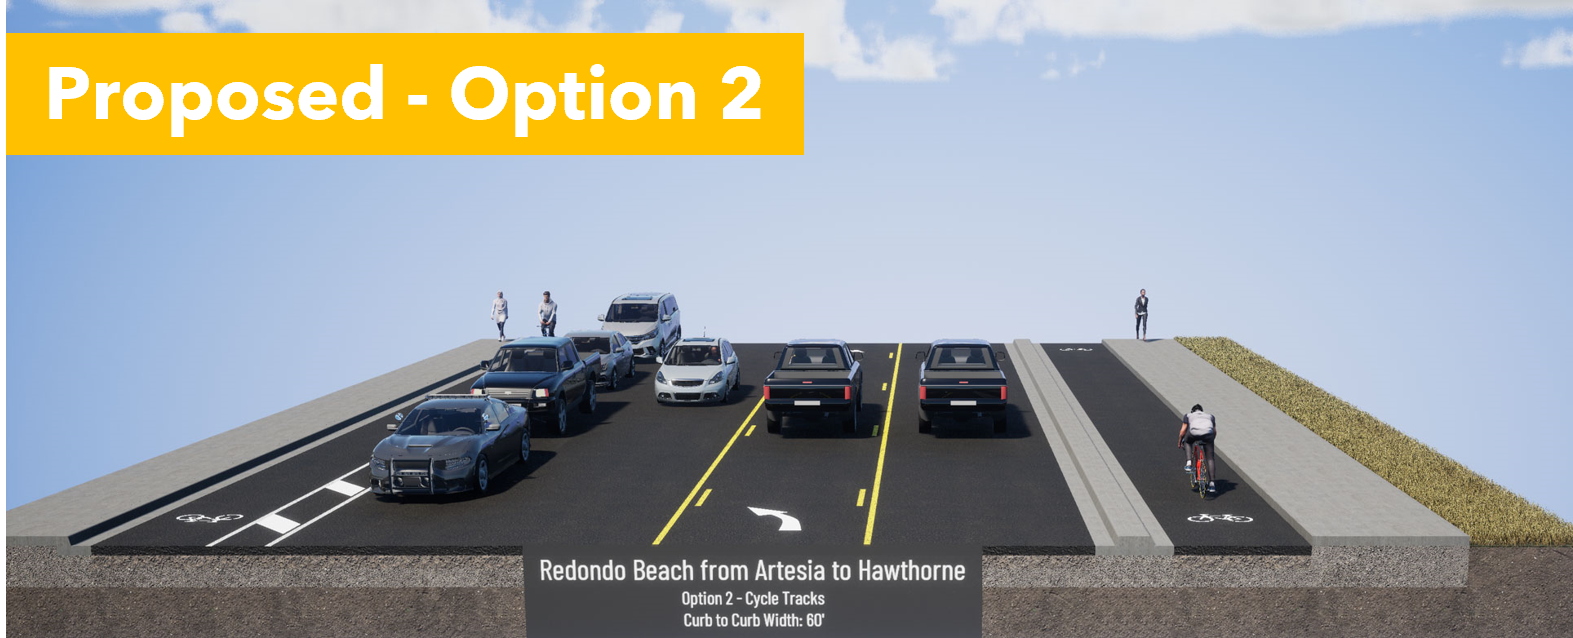
Q8: Redondo Beach Blvd from Artesia Blvd to Hawthorne Blvd. Is a tossup but both Options are so much better than the status quo.


Option 1 pits cyclists against pedestrians, but provides 2-way access to Walgreens and Starbucks. It's not terrible as long as cyclists slow down when passing pedestrians and motorists exiting the parking lots look both ways. 


Option 2 provides a clear separation between motorists, cyclists and pedestrians. Cyclists are curb-protected on the eastbound RB side, and parking-protected on the westbound Lawndale side. However, coming westbound from Walgreens/Starbucks, people will likely bike on the sidewalk until they meet the 2-way cycle track. 


Although you lose a traffic lane, it's not the cyclists' fault. One can just as easily blame the space allocated to free car storage (on-street parking) and a turn lane. Motorists are losing a travel lane to other motorists, not cyclists. Don't forget that. 

Option 1, the 2-way cycle track, provides a better alternative not suggested by Metro for the next section. 

Q9: Redondo Beach Blvd from Hawthorne Blvd to Prairie Ave. I am Very Dissatisfied & propose a better solution. 


Although the status quo is very bad, we shouldn't rush into the proposed door zone bike lane next to high-speed traffic heading to the freeway onramps. It is extremely dangerous. This will greatly reduce the number of people brave enough to ride to Alondra Park and El Camino College. 

If there is enough room for on-street parking, then there is enough room for a parking-protected bike lane. That may require narrowing the car lanes a bit, but that would also inhibit speeding, making that stretch safer and quieter for all road users. 

The freeway onramp is on the north side of RB Blvd. A 2-way cycle track on the south side of RB Blvd would keep cyclists away from the crazy line of cars trying to merge onto the 405 on-ramp. Suggest that in Q11. 

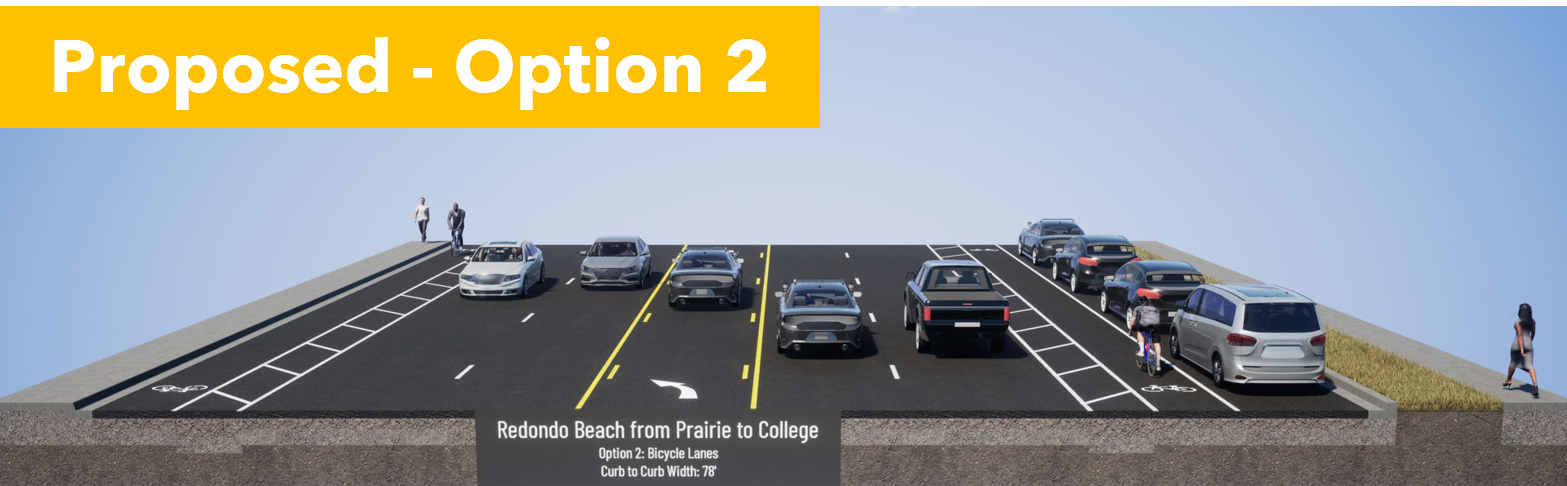
Q10: Redondo Beach Blvd from Prairie Ave to Dominguez Channel. Pick Option 1, the 2-way cycle track on the North side, next to the park and El Camino College. 


Option 1 puts cyclists next to the park and ECC. Although it is shown with plastic bendy straws, it can easily be fitted with bollards or a concrete curb for better protection when cycling to and from evening classes at ECC. 


Option 2 puts cyclists in the door zone, where they can be knocked into fast-moving traffic and killed. Drunk or malicious drivers can also harm cyclists easily with only "paint as protection". 


Q11: Additional Comments: This is where we ask for a protected 2-way cycle track on on the south side of RB Blvd between Hawthorne and Prairie. 

What do you need to be comfortable bicycling this corridor? Tell them!

Keep in mind that younger Beach Cities kids will probably only ride the western side of this corridor, west of Inglewood or Kingsdale. But older teens and young adults may need to ride to ECC or to retail jobs between Kingsdale and Crenshaw. 
There are a lot of children and seniors in Lawndale and Torrance who would benefit from these bike facilities, whether they are riding a bike, trike or mobility scooter. 

We should make this corridor welcoming for ages 8-80. 

Think about who needs to travel through this corridor and at what times. What kind of cycling facilities do they need to get there comfortably and safely?  What about seniors in mobility scooters or electric wheelchairs? Would you like to see food delivery robots in the bike lane or more food delivery by privately-owned cars?

With better bike facilities, I may choose to bike to stores further east than I currently feel safe. Every trip I make by eBike instead of car, I am "sparing the air", not taking up road space in front of you, and not competing with you for parking. 

Another thing that excites me about this project is that it connects us to the Dominguez Channel. In a separate project, LA County Public Works will be extending the bike path along the channel southwards. It currently goes north to 120th St, past Amazon, Space-X, Lowe's and to the Metro Green/C Line. A southbound channel bike path would connect to the Harbor Gateway Transit Center, with very fast connections to the Silver/J Line to USC/Expo Park (15 min) and Downtown LA (20 min). Harbor Gateway TS is already linked up to CSU Dominguez Hills. This is a large step forward for a transportation transformation for the South Bay. 

Bike lanes benefit you even if you don't ride a bike, but your neighbors do. 

Bike lanes will save you time currently spent chauffeuring your kids short distances. 

Bike lanes will benefit your kids because students who get exercise before school do better. 

Bike lanes will benefit you when you age out of driving. 

Bike lanes may allow your family to shed one car, saving you over a million dollars per lifetime

Finally, I want to close with this terrific video of a #BikeBus led by Coach Sam Balto in Portland. 

https://twitter.com/CoachBalto/status/1656353963489501190?s=20

This bike corridor will touch the lives of half the students in RBUSD and can be transformative for the way our community gets around. If half of our households can shed just one car, we would be richer, our street parking and traffic congestion problems will evaporate, our air and water will be cleaner, and we will have done our part to slow climate change. Oh, we'll be fitter and happier, too. 

* A very few students living in North RB attend Mira Costa HS in Manhattan Beach, but only if MBUSD will take them. 

Friday, March 03, 2023

True Cost to Own

This post was inspired by a Twitter exchange with a Culver City resident who was able to shed one of her family's two cars due to the Move Culver City Project to reallocate space from cars to transit (bus lanes), active transportation (walking/biking) and micro-mobility (scooters, wheelchairs). 


Culver City's city council balance changed from 3/2 in support of this street space reallocation to 3/2 opposed. The new city council wants to reverse the street space allocation and give 100% of the public space to cars again despite the city's own data that transit and bike use grew explosively while car use declined.  Read the Move Culver City Mid-Pilot Report.  


I think reversing Move Culver City is a big mistake for many reasons, but I will just get into the financial angle in this post. 

Car ownership is so normalized in US society that I think we stop paying attention to how much it's really costing us. When AAA published their annual report "How Much Does it Really Cost to Own a New Car 2022", it surprised many people. [2023 Update is even grimmer, $12,182/year]


There were the usual arguments that not everyone buys a new car. But, this assumes the average new car sells for $33,301 when Kelley Blue Book reports that the average car price set a new record in December 2022 at $48,681. Car and Driver reports that Los Angeles drivers pay $681/year more for car insurance than the national average.  

$10,728 is an underestimate for the cost to own a car in Los Angeles. That price also does not include the cost of a parking spot, which you are paying for whether it's a line item in your budget or not.  Everyone seems to complain about parking, even though Los Angeles has more homes for cars than for people

If households with multiple cars can shed one car, they can save $10,728/year. 

Median Culver City household income in $97,540 with a marginal tax rate (CA+Fed) of 33.3%. 

Owning a car costs $16,084/year pre-tax. 

If that money were put in a tax-deferred retirement savings account every year for 30 years, that household can accumulate just under $1 Million! 

I assumed that the money was saved in a Vanguard Growth and Income Mutual Fund (VGIAX) earning about 6.54% over the last 20 years or 10.78% over the last 10 years. 

The Bureau of Labor Statistics CPI inflation calculator says inflation ran 2.65% over the last 20 years. 

Using a conservative 4% above inflation estimate for VGIAX, the Bankrate Compound Interest Calculator shows that the household that was able to shed a car winds up with $916,300 after 30 years in their retirement savings account. Yes, you do pay taxes as you withdraw that money, but that's a huge chunk of money nevertheless. 


In Summary, if Move Culver City allows families to shed one car, then that is a $1M gift to the families in Culver City. 

Reversing/removing the street improvements--making buses too slow to use and bicycling too dangerous to attempt--forces families into cars again. If they have to own a second car again, then Culver City families lose $1 M. 

Elected officials should think long and hard about whether they want to force car dependency and costs onto their residents. It's not good for residents, it's not good for the planet, it's not good for the city. Finally, I don't think it's good for the elected officials' ability to get re-elected.