Showing posts with label Meteorology. Show all posts

Saturday, April 04, 2020

Stay away from the beach

Mea culpa. I was upset when I saw this photo that @seaninorbit Tweeted on March 28, 2020. But I was so very wrong. Read on to learn why I changed my mind and now fully support this ban.


As I cyclist, I immediately bristle when people in cars are given more rights than people outside of cars. Read the sign in this photo.

The beach bike path below is closed. The wide sidewalk for pedestrians at street level is closed. The on-street bike path is closed. Pedestrians and bicyclists are banned from the street. The city of Redondo Beach appears to be saying that only people cars can use the street.

By law, our streets are supposed to give access to all modes of travel.

Where are people outside of cars supposed to go?  I felt that this was another auto supremacy move by our city and police department.

Then I read Rosanna Xia's piece about why people should stay away from the beaches right now.
In her research, [UCSD/Scripps Professor Kim] Prather has found that the ocean churns up all kinds of particulate and microscopic pathogens, and every time the ocean sneezes with a big wave or two, it sprays these particles into the air. She believes that this new coronavirus is light enough to float through the air much farther than we think. The six-feet rule, she said, doesn’t apply at the beach, where coastal winds can get quite strong and send viral particles soaring.

“It’s not going to kill you if you miss a few surfing sessions, but it could if you go out there and get in the wrong air,” she said.

“You can’t see the virus, you can’t smell it ... It’s a real silent killer right now.”

...

“Once things are in the air, they can go pretty darn far. People are shocked whenever I talk about stuff becoming airborne,” she said. “I see pictures of the beach shut down, and the signs tell you don’t walk on the beach, don’t swim, don’t surf, but nobody tells you: Don’t breathe.”
Remember all the other scientists saying how far aerosol droplets can travel before hitting the ground under laboratory conditions? The beach environment is a lot windier and complex than most labs.

You know how you can taste the saltiness in the air at the beach? That clammy feeling on your skin and clothes? That's sea spray.

Salt is corrosive. People who live near the beach know how far sea spray travels because we have to combat the corrosiveness with constant home maintenance.

Salt and sea spray is also hygroscopic--it attracts water. Small droplets can attract moisture out of the air and become bigger droplets that fall more quickly. That stuff can fall on you and stick.

Conversely, sea spray can warm up and evaporate some of their water, becoming lighter and able to travel further. Add stiff sea breezes and you have a complex aerosol environment with who knows what blowing quite a distance inland depending on sun and wind conditions.

Dr Prather also cautioned that stuff that precipitates out of the air can be washed out in the ocean and become re-aerosolized.
Coronaviruses are encased by what she calls a “hydrophobic” lipid, or fatty, membrane. Fat tends to float to the surface of water, similar to oil in a vinaigrette dressing. When waves break in the surf zone and all the foam and bubbles pop, Prather said, “all that stuff — the viruses, the bacteria, pollutants, all the gooey, oily stuff — just launches into the air.”
That surfer that said he was going out when the surf was up, no matter what? He's not just endangering himself.  He could be an asymptomatic virus shedder exhaling into the sea spray.

Alison D. Nugent et al recently found "We've also found a stronger relationship of Sea spray aerosol (SSA) number concentration to wave activity than to wind speed in our coastal measurements."

Even if people are spaced 6 feet apart in the bike lane right along the coast, that's not enough.  Better to bike the inland route right now.

Many regular bike commuters wear N95 masks to protect themselves from car exhaust and PM2.5.  If you don't have that, wear a homemade cloth mask, stay away from cars and other riders as much as you can.

Wednesday, April 10, 2019

Windsday 2019

Happy Windsday!

It's been years since we've experienced a proper jet stream-induced Windsday.
Consider the jet stream, a fast-moving horizontal river of air at approximately the 300 millibar level (about 30,000 feet above sea level). Bernoulli's principle explains that, where the air is flowing fastest, the air pressure is lowest. It's a positive feedback loop because the jet stream sits over the regions of the lowest pressure and the pressure is lowest where the air is moving fastest. It's like a mountain pass that allows the air to blow through--only this pass can move and change course.

High pressure systems are associated with warm and sunny weather. Low pressure systems are associated with 'disturbed', cloudy and stormy weather.
Last night, I read several tweets from journalists remarking about the ripping Santa Anas. It didn't feel like a Santa Ana--too cold and not dry enough. I quickly took a look at the California Regional Weather Server Jet Stream Analysis webpage.

Universal time/UTC/Z is 7 hours ahead of PDT so this was 23PDT 9 APR 2019.  Note the peak of 136 knots right over LA in the jet stream analysis.
We've lived with the Ridiculously Resilient Ridge for so long, we forgot what it feels like when the jet stream dips south over us.

It seems like the satellite image overlay is no longer active at either CRWS or the Naval Research Lab links I provided earlier.  Research funding scarcity and the privatization of data from public satellites was just too much to overcome.

Thursday, December 14, 2017

Not looking like a white Christmas

Have you seen the Aleutian Low? It appears to be lost. But maybe we can work together to bring it back?


I have a new personal computer at work and setting it up for weather data wrangling has been a slow and sometimes painful process.

We have a new supercomputer at work and setting it up for weather data wrangling has been an excruciatingly painful process.

Anyway, I made a movie for you of the 10-day GFS forecast and it looks really, really dry.

Instead of a low pressure system near the Aleutians, bringing in storms into the Pacific Northwest and sometimes into California, we have a variant of the Ridiculously Resilient Ridge (R3).

I plotted the Geopotential heights of the 700 mb isobaric surface (about 70% of normal sea level pressure and about the height of winter moisture.). The red area sitting over the western US is about 200-300 meters higher than surrounding areas.

This is the equivalent of a 200-300 meter high mountain range sitting between you and winter rains.  The rain is going to find a lower energy path.

Around December 20, an offshore Omega Block pattern forms.  Alaska is going to get some dramatically atypical December weather!

I'll be with family in CA and we will probably be dry, cold, and windy.

Friday, February 10, 2017

Los Angeles Weather and Climate

I was so shocked when I read this, it took me a while to figure out how to respond. I choose #sciencenotsilence.

 While I am aware that I have political differences with this sewing blogger, I had been prepared to look at our commonalities instead of our differences. I even took her on a tour of the Olmstead District in Old Town Torrance and introduced her to Momen+ fabric.

I'm not going to link to her blog, because that would drive up the reputation ranking of these #fakefacts. I'm just going to share a screen capture so you can see what I am talking about.


Deep breath here.  I read her blog because she is an extremely prolific and skilled sewer, knitter and photographer.  She is highly competent in her areas of expertise.  I read her blog so I can learn and be inspired.

I don't want to hurt her feelings, but I cannot let lies go unchallenged.

My blog is not glossy and professional.  I do not sew prolifically.  I sew and blog late at night.  I take photos with my phone or a compact point and shoot--often with poor lighting.  Why should you believe me and not her?

I work as a data specialist at one of the world's premier weather and climate data archives.  Prior to this, I earned a BA in Mathematics and a BS in Chemistry.  Then I earned a PhD writing models to compare theory with precision physical measurements.   The expertise I developed led to a job in an Air Force research lab running weather models and performing weather satellite Cal/Val (calibration and validation.)  I have also run climate models, but only at an introductory classroom level.  I eventually landed in my current position.   I am working in my third national lab.

I could earn much more money using my math, statistics and computer skills to spy on your web behavior to influence you to buy stuff you don't need.  Instead, I'm busy trying to preserve the best quality data available for future generations.

I am proud to be part of the global weather and climate enterprise.  It takes a huge amount of international cooperation to study our planet for our common safety and good.  I would never take part in an international conspiracy to lie to everyone.   It's absolutely ludicrous.

The reason that scientists are so alarmed about global warming is because it is a threat to all life on earth.  We're all going to fry together unless we work together to change our behavior.

So let's unpack the statements:
I don't believe in global warming
Neil deGrasse Tyson said, "The good thing about science is that it's true whether or not you believe in it."  He's right in that the planet is frying whether or not you believe in it.  But it's not a good thing.
or climate change or whatever they are calling it these days.
Don't blame the scientists. Blame the political appointees in the Bush 43 administration that forbade federal scientists from using the term, "global warming." Our scientific findings and reports were even scrubbed by fresh out of college political science majors with no science expertise whatsoever but fantastic partisan bona fides. But that is another rant.

The Obama administration did not renew that rule and some scientists drifted back to using global warming, while others use climate change. The planet does not warm uniformly, so there are good reasons to use CC when referring to some effects.
To me, it’s all weather, in some ways it’s predictable, in others it’s not.
This sows confusion.  "Oh, well.  We don't know for sure so let's ignore it."  No, we cannot ignore it and it is not confusing at all.

Actually, weather and climate are different things to scientists. The simplest definition is "Weather is what you get; climate is what you expect."

Edward N Lorenz wrote a classic explanation.

Weather is on a short time-scale and we are really good at predicting it. In fact, a 10-day forecast today is as accurate as a 3-day forecast was 20 years ago. I've written about Verification Statistics for my work blog. Weather verification is ongoing and published openly on the web. We got nothing to hide.

Climate models are similar and also very different from weather models. They have all the same physical models of how air, water and trace gases behave. But, they also vary in their external forcings (e.g. sun) and boundary conditions. Both types require millions of lines of computer code.

Early weather and climate models were not so good but both experienced continual improvement. Weather models are easier to verify and improve because of their short time-scale. I'm not going to live to see the verification statistics of 2100 climate simulations.  I'm going to have to trust that, because climate models verify well with the past, they will preform similarly well in the future.
What has been happening these last few years in California is predictable and following a pattern.
I don't know what she means by this. Is she referring to the El Nino/La Nina cycle that reverses every year of two? Or is she referring to the Pacific Decadal Oscillation, a similar warm/cool ocean pattern that occurs on much longer timescales?

When the cool phase of the PDO lines up with La Nina, rainfall plummets in southern California.  We expected a few very dry years and we got them.  We got a longer dry spell than we were expecting and there is much research about why that occurred.  Overall, scientists were less surprised than the media.  I don't know if you can blame the scientists or the professional weather communicators who are hired more for ratings rather than scientific accuracy.

This next paragraph took me a long time to unpack.
Simply put, we get rain in the winter, then we get a few years of drought, we always have fires, but at some point, we have massive fires all over the state. The following winter we will have an abundance of rain and snow, then come the mudslides. Maybe back to regular rain for a while and then the cycle repeats.
Have you studied rhetorical devices? It's useful to understand how people try to persuade you, even when the facts aren't clear.

Consider the false dilemma. They set up an either or situation. If A is right, then B is wrong. But the fancy talk obscures that there is no real logical connection between A and B.

Yes, California's normally dry summers would qualify as a drought practically anywhere else. That's just our climate. Fire is a perpetual hazard in the American west. Burned areas are prone to mudslides the following winter. All that is true.

Just because weather and seasons are cyclical does not mean that the climate is not changing.


2016 was the hottest year globally in modern history.  Higher temperatures cause more water to evaporate both directly and indirectly through evapotranspiration of plants.  Even with the same amount of water, high temperatures will create drier and more combustible forests.  We are already seeing this.  The fire season is starting earlier and ending later.  We are experiencing wildfires in January!

Just because it rains in the winter, does not mean that our climate is not changing.  No one is saying that climate change = no seasons.  In fact, we expect more weather extremes in both precipitation and temperatures.  That is exactly what we are experiencing.

The Sierra snowpack is a complex and highly alarming subject that deserves its own post at a later date.

Next, I plan another post about kettle logic and how it is weaponized to confuse people about science.

I haven't sewn anything since early December so I might as well blog about science.  #resist

Burda 6919 for my daughter was a success.

Thursday, August 25, 2016

Feeling Patriotic

Another in the long list of reasons why I love this country...
Anyone can ftp into this NOAA server to download weather and climate data for free! Check out how easy it is to anonymously ftp into the data server.  Use "anonymous" as your username and an email address as your password*.
Grace> ftp nomads.ncdc.noaa.gov
Trying 2610:20:8040:2::166...
Connected to nomads.ncdc.noaa.gov.
220 2610:20:8040:2::166 FTP server ready
Name (nomads.ncdc.noaa.gov:Grace): anonymous
331 Anonymous login ok, send your complete email address as your password
Password:
230-************************************************************
** WARNING ** YOU HAVE ACCESSED A US GOVERNMENT COMPUTER.**
** WARNING ** UNAUTHORIZED USE IS PUNISHABLE BY FINES OR **
** WARNING ** IMPRISONMENT UNDER PUBLIC LAW 99-474. **
** WARNING ** INDIVIDUALS USING THIS COMPUTER SYSTEM ARE **
** WARNING ** SUBJECT TO HAVING THEIR ACTIVITIES ON THIS **
** WARNING ** SYSTEM MONITORED AND RECORDED BY SYSTEM **
** WARNING ** PERSONNEL IN ACCORDANCE WITH ESTABLISHED **
** WARNING ** SECURITY PRACTICES. **
************************************************************
230 Anonymous access granted, restrictions apply
Remote system type is UNIX.
Using binary mode to transfer files.
And look at the available data:
ftp> ls
229 Entering Extended Passive Mode (|||62934|)
150 Opening ASCII mode data connection for file list
drwxrwxr-x 20 3682 nomads-prod 4096 Feb 16 2016 12
drwxrwxr-x 14 3682 3682 4096 Aug 16 11:43 32
drwxrwxr-x 23 3682 nomads-prod 4096 Sep 12 2012 33
drwxr-xr-x 3 root root 4096 Mar 30 2015 CFSR
drwxr-xr-x 2 root root 4096 Mar 30 2015 CFSRR
lrwxrwxrwx 1 root root 7 Aug 26 2013 GDAS -> 12/GDAS
lrwxrwxrwx 1 root root 7 Jun 6 2013 GENS -> 32/gens
drwxr-xr-x 2 root root 4096 Jun 6 2013 GFS
drwxrwxr-x 11 3682 3682 32768 May 8 2015 model
drwxr-xr-x 2 root root 4096 Jun 6 2013 NAM
lrwxrwxrwx 1 root root 7 Jun 6 2013 NARR -> 12/narr
lrwxrwxrwx 1 root root 10 Jun 6 2013 NARR_monthly -> 12/narrmon
lrwxrwxrwx 1 root root 7 Dec 18 2012 NDFD -> 33/ndfd
lrwxrwxrwx 1 root root 8 Aug 23 2013 NDGD -> 33/ndgd/
lrwxrwxrwx 1 root root 3 Sep 23 2013 RAP -> RUC
lrwxrwxrwx 1 root root 15 May 6 2015 reanalysis-2 -> 12/reanalysis-2
-rw-r--r-- 1 root root 26 Oct 13 2010 robots.txt
drwxr-xr-x 2 root root 4096 Dec 16 2015 RUC
drwxr-xr-x 2 root root 4096 Jun 6 2013 SST
-rw-r--r-- 1 root root 610 Mar 23 2011 welcome.msg
226 Transfer complete
Now what do you want to see?
ftp>
This is where all the weather apps and websites get their data. They just package it up and add advertising or charge you. You can do this yourself with a computer by getting the data from NOAA and the easy-to-use Panoply software from NASA for free.

* You don't have to use your email address, but it is standard courtesy in anonymous ftp to use your email address as a password so that they can log where users are coming from. For instance, if you are a teacher or student, use your school email address so they can log you as an education user. This is how we discover needs and allocate funding.

Thursday, April 21, 2016

Snow Dyeing Experiment

First, you need to harvest some snow.  The NWS predicted rain Friday night turning overnight to snow.

When I woke up Saturday morning, the snow was still melting immediately when it reached the warm ground. When the snow began to stick, I set my IKEA Torkis baskets outside to harvest some snow.  I put them on a bench, so they would equilibrate to the air temperature instead of the ground temperature.

Then I went back inside to mix a cup of soda ash with 5 gallons of hot water. I soaked the four items I wanted to dye in the soda ash solution.

Meanwhile, outside, the air temperature remained stubbornly right above freezing.  My snow yield was disappointingly low compared to the dead leaf yield.  I moved the Torkis to a more open area on the grass.

Back inside, I put the scrunched up the damp clothing in plastic bins, mixed some Procion fiber-reactive dyes with water, and splashed the dye in.

For the snow dye experiment, I decided to supplement with ice from the ice-maker in the kitchen.  (Isn't it ironic that we run ice-makers in the winter?)
Note that I did not put the shirt on a rack to suspend it above the dye as it drips through.  I wanted a more solid look.

My total snow harvest was pretty pathetic. I consolidated all four baskets of slush and barely had enough to cover the shirt.


I sprinkled one teaspoon each of midnight blue and strong navy Procion dye powder on the slush/ice/shirt tostada.

Waiting inside, catching up with my mending pile.

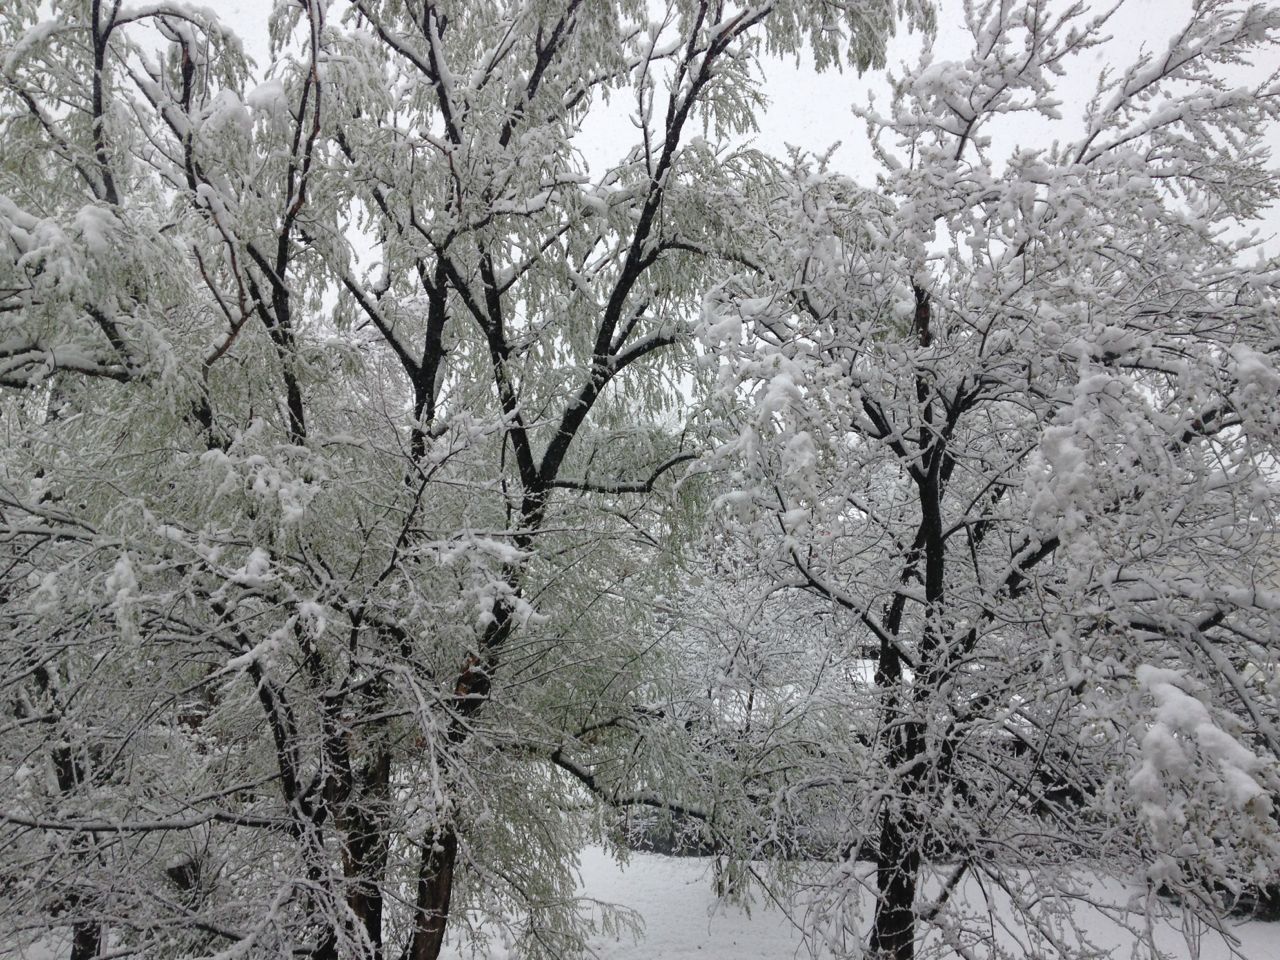
Waiting on the other side of the condo, enjoying the quiet beauty of a snowstorm.

Silence in the heart of the city.

Sunday morning, I rinsed out the clothes until the water ran clear.  In LA, I use the spin cycle of my washer to extract the moisture (with the excess dye).  That cuts the time and water required for rinsing by a huge amount.

In Boulder, I use a Nina Soft Spin Dryer, which is a centrifuge for fabric/clothing.

Wow.

I am a total snow dye convert now.

The NWS nailed the forecast.  We got an astonishing amount of snow for April.  But, most of it fell Saturday night/Sunday morning--too late for my snow dye experiment.

I think I will have to learn how to make artificial snow with ice in my blender...and see what happens when I suspend the fabric on a cookie rack.

Links to stuff I used*

* I have no financial relationship with Dharma Trading except that I've been buying from them for nearly 30 years and have *never* had an unsatisfactory experience with them.

Tuesday, March 29, 2016

Views & Social Media

I've been super-busy preparing for the talk and workshop next week. I'll just post some pictures of my past two weeks, with very short comments.

I'm tweeting more often, especially about science and women in STEM. If that interests you, follow @gspeng. Twitter, and email are the quickest ways to message me if you have a question or comment.  Comments left on this blog also get forwarded to my email.

I've also joined Instagram as bmgmlax. Instagram allows people to open accounts without verifying their email address. A young man used my personal email address to sign up for Instagram and was quite active on that site.

I couldn't get Instagram to delink that account to my email address. Finally, I took control of that account using the "forgot my password" option and then deleted his account. I felt bad about that for about a millisecond. The squatter using my email address and Instagram deserved it.

Twitter is is an extension of my professional life.  Instagram is for my off-duty life.

Waiting for a meeting to start.  That's the outdoor patio of the cafeteria.
Leaving work the day after the storm that just missed being classified as a blizzard because the high winds and zero visibility did not last 3 continuous hours.
Another shot as I left work.
View from my office window.
View from my neighbor's window.  You can see both my current office building up on the mesa top and my former campus tower office.
Mariposa for my reading nook.

I can see Long's Peak from my kitchen and bedroom windows. I'm told that I can see Pike's Peak from my office window, but I haven't learned how to recognize the shape yet. We had ~35 inches of snow in one week (3 storms). Each snowfall was preceded by half an inch of rain. The town is a soggy and muddy mess. The views are beautiful, but I've been putting in my miles on the treadmill indoors lately.

Monday, March 14, 2016

Smell-O-Vision

I wish one could smell the lemon flowers through the screen.

The camellias (in our LA yard) enjoyed their baths this winter. I wish there were more coming, but the Madden-Julian Oscillation makes that unlikely.

On the upside, I traveled eastward with the MJO back to Boulder.

That's one dramatic front, n'est pas?

Wednesday, December 30, 2015

Wandering pole

I plotted up the temperature analysis to show how Boston--and pretty much the entire northeastern US--enjoyed a warmer Christmas in 2015 than Los Angeles.  Bad Dad pointed out that this is a junk graphic because everyone already knows this.
But, plot it up in polar stereographic, and it gets more interesting.

In fact, when I plotted up today's near surface temperature analysis in polar stereographic, you can see that the north pole almost got above freezing!  Moreover, it exhibits a wavenumber of 2.
AER's Arctic Oscillation Analysis and Forecasts page gives a technical explanation of this event.

Wednesday, December 02, 2015

That was some windsday!

A couple of weeks ago, we had some wild winds up at the Mesa Lab.   The instruments up on the roof of the building recorded a peak gust of 94 mph!

Notice how the sustained winds (in red) were pretty similar for the last 3 events while the peak winds (in blue) varied much more widely?

The frequent high winds rattle and stress the windows.  The larger ones are prone to cracking and breaking.  My neighbor noticed the crack in his office window before the wind incident of November 18, 2015.

(The window in the mirror image office across the hall from this one cracked last spring.)

It isn't every day that you can see a paneless opening in your office building.

It took three guys on the inside and one guy on the outside to replace the window.

Some view!

Monday, September 14, 2015

The importance of narrative

I love a good mystery. I think that is what first attracted me to quantum mechanics. The way my professors taught it (and the textbooks were structured), quantum theory unfolds like a great detective story.  Pieces of evidence rolled in, players moved about, the truth gradually emerges.

The narrative is so strong, you can put together a timeline of the discovery of quantum theory.

Has anyone done the same for the weather?  If you know of one, can you leave it in the comments?

I had hoped that Weather Experiment would be that book, but it isn't.  It's not even "The pioneers who sought to see the future" as the subtitle claims.  I agree with this review in the NYT; the book is about british men and (mostly) ignores the work in other places.

American James Espy and Frenchman Urbain Le Verrier get brief mentions, but this is mostly a bunch of stories/biographies about british men strung together.

If you are looking for a coherent narrative of scientific discovery, look very, very carefully.  There are nuggets tucked in here and there.  When narrating who argued that air masses move up and who argued that they moved in circles and who said that they move horizontally, some context would have been useful.  It is possible that they were all right, given their life (weather) experience.

The book is fine if you are expecting a bunch of human stories about people who are affiliated with the study of weather as it was practiced in England.  There is a useful index.  Also, "Stars in FitzRoy's Meteorological Galaxy" just before the index, gives a synopsis of the players, including the ones given short shrift or omitted in this book.

It hadn't occurred to me before reading this book that predicting the future is a form of divining the future, and had caused religious crises of faith.  I also learned that accusations of data-hoarding are not new.  ;-)


Sunday, August 23, 2015

Smoke Effects

During my after-work bike ride on Thursday, August 20, I noticed flashes of red coming from Boulder creek. Further investigation showed that they were the reflections of sunlight coming off the sun. We have been getting spectacular red sunsets due to the smoke from all the wildfires around the western part of North America.

Fortunately, I didn't need my inhaler during or after my bike ride.  I did cough a bit more than usual after my ride.

I did give up my hiking and biking plans for the weekend, though.  It's just too smoky outside.  My eyes hurt if I spend extended time outdoors.  When will the winds shift?  Check the California Regional Weather Server's Jet Stream visualizations of NCEP forecasts.

Wednesday, June 10, 2015

Saturday, May 02, 2015

Interpreting the Water Footprint of Food

I've read some discussions of the LA Times Water Footprint of Food interactive feature, mainly expressing surprise about the comparatively large water footprint of pulses, dried legumes.

When you look at these plots, a beef burger looks only slightly indulgent compared to a falafel (chickpeas).  What's the harm in a burger?  Or the Atkins diet in general?
Water footprints of protein sources calculated by the waterfootprint.org.
I scratched my head when I saw that graphic as I understood that beef is a highly inefficient source of protein compared to plant sources (but several magnitudes more efficient than tuna!).  How was this calculated?  Is the methodology valid?

This weather and climate data consultant dug deeper.

The folks at The Water Footprint Network explain their methodology here.  The LA Times article said, "Below you can see the U.S. water footprints of selected foods as measured by gallon of water per gram of protein produced or per calorie."

So is this country-specific data?  How can you compute the water-intensity of the US chickpea crop when there is nearly no commercial chickpea production in the US?

Later, in the LA Times coverage, they quote Mekonnen and Hoekstra:
"The average water footprint per calorie for beef is 20 times larger than for cereals and starchy roots," they note, referring to global averages, not U.S.-specific figures. "The water footprint per gram of protein for milk, eggs and chicken meat is 1.5 times larger than for pulses," a group of legumes that includes peas, beans and lentils.
Perhaps the LA Times reported GLOBAL (not US) water intensity in US units of gallons? The article wasn't clear.

I searched and found that the EU compiled and mapped some statistics they downloaded from McGill University.

Global acreage used for chickpea production.

Global production of chickpeas in tons per square km.
If the LA Times reported US statistics, then the chickpea data is highly suspect.  It's the classic "statistics of small numbers" problem.  The smaller the sample size, the more variable and unreliable the statistic.

Suppose the LA Times did report the GLOBAL water footprint, then it is important to look at the hydrologic cycle of the areas where chickpeas are farmed.

Luckily, I work at a weather and climate data archive and have access to stuff like this classic paper about the terrestrial seasonal water cycle by Willmott and Rowe.  See and download the Willmott and Rowe data.  I give you permission to play with your food data.

First page of Willmott and Rowe.

Recall that chickpeas are mainly grown in India, the middle east and sub-Saharan Africa.  Hmm, look at the evaporation in those regions in the early summer.  If most of the chickpeas are grown in India, and ground-level evaporation is exceptionally high there (and moderately high in other regions where chickpeas are also grown), then the global water footprint for chickpeas will be high.

Evaporation climatology 1950-1979.  Notice the extremely high evaporation in chickpea-producing areas of India and central America during monsoon season. 
Did the LA Times report rely on a small and unreliable dataset (US chickpea production) or report global statistics and label them as US statistics? I don't know. Either way, their reporting is extremely suspect.

People need protein.  Plant-based proteins such as chickpeas are largely grown and consumed in regions where the resources (land, water, labor) cannot support animal sources of protein.

The water and carbon intensity of crops vary greatly by location.  That's why I don't eat an entirely locavore diet.  Our family enjoys CSA boxes grown with reclaimed water from the Irvine waste treatment plant.  But, we occasionally eat lamb chops imported from New Zealand, where the sheep are raised on rainfall-watered pasture.

Yes, sheep meat has a large water footprint.  But New Zealand has abundant rainfall and doesn't need to artificially irrigate their pastures.  If the lamb is frozen and then shipped via ultra-efficient container ships to a harbor < 15 miles from our home, then the carbon footprint of that lamb chop is much, much lower than a beef burger from the Central Valley of CA.

Early summer evaporation in the American west.  Note the hot spot in the Fresno area.
I took a closer look at the evaporation in California.  Download the data and the Panoply data viewer and play with the data yourself.  Scroll through the months.

The Willmott and Rowe data is based solely on 1950-1979 ground-based station data.  Later datasets rely on satellite data, but WR gives monthly averages, which is important because row crops are not grown year-round.

It's important to note that the evaporation measured by the ground stations are influenced by temperature, winds and water availability.  Water availability depends on both natural sources, e.g. precipitation and surface stream flow, and irrigation.

See that bright yellow hot spot near Fresno, California?  100 kg per square meter is 100 mm or ~4" of water.  Look at Fresno's climatology.  That's nearly all irrigation with water from elsewhere or  groundwater.

This is old data.  The numbers today, with millions of acres planted with permanent tree crops that can't be fallowed during droughts, would be even more scary.

This is why California's central valley is sinking.  This is a slow-motion environmental catastrophe.  It has to stop now.


Tuesday, April 07, 2015

1938 atmospheric river that caused the Los Angeles flood of 1938

At least one person asked why I used a reanalysis that does not assimilate satellite water vapor data to study an atmospheric river (AR) event.

That's a good question because the NOAA/CIRES Twentieth Century Global Reanalysis Version 2c (20thCR V2c) only ingests three things: surface pressure, sea ice coverage and sea surface temperature. The rest of the analysis is generated by the physical models of NOAA's Global Forecast System (GFS).

The short answer is that 20thCR V2c extends all the way back to 1851, which means you can compare storm intensity between storms, including events that occurred before the modern satellite era.

E.g. how does the AR event of 2004-2005 compare with one responsible for the Los Angeles flood of 1938, that felled thousands of buildings?  Let's take a look.
Global animation of PWV from 20thCR V2c for 1938-02-27-00 UTC through 1938-03-03-18 UTC.
Click here to read the rest.

I am happy to announce the NCAR Research Data Archive Blog.  My fellow data whisperers and I will blog about weather and climate data analysis. This is part of my omnimedia strategy, which will include YouTube tutorial videos for performing your own data mashups. Stop by and visit!

Wednesday, March 25, 2015

Reliving storms past

I can't bring rain to drought-plagued California, but I can bring virtual showers by making movies showing historic Atmospheric Rivers (ARs) that hit California.

ARs can be defined in terms of satellite measurements of "20 mm of water vapor and is > 2000 km long and < 1000 km wide."  They average about 400 km wide.

First, I made a global animation of Dec 26, 2004 to January 11, 2005 so you can see atmospheric rivers peeling off from the moisture belt of the tropics and subtropics.  I used the NOAA/CIRES Twentieth Century Global Reanalysis Version 2c (20thC R2c) because I want to highlight a newly available dataset by showing cool things you can do with it.

Global animation of NOAA/CIRES Twentieth Century Global Reanalysis Version 2c for December 26, 2004 to January 11, 2005.
Precipitable water is a measure of the total, column-integrated, water vapor in the atmosphere at that point.  If all the water vapor condenses, the equivalent depth of the water can be measured as a length (often mm), or as mass per unit area (kg per square meter).  1 kg m-2 of water is equivalent to 1 mm of water.  In the global animation, ARs are light cyan to red in color.

Precipitable water can be estimated (pretty well!) using microwave remote sensing from satellites.  Modern Global scale models usually assimilate all available data, including satellite and ground-based measurements, to generate estimates of physical parameters, including precipitable water. But, because 20thC R2c goes back to 1851, this analysis was performed using just the three types of data available in 1851: surface pressure (from land-based ground stations), sea surface temperatures (from ship observations) and sea ice extent.

Then I zoomed in to the regional-scale and changed the color range of the precipitable water scale from [0.1, 70] to [0.1, 40] to better show the structure in mid-latitudes like California.  In this animation, ARs are yellow to red.
Regional-scale animation of NOAA/CIRES Twentieth Century Global Reanalysis Version 2c for December 26, 2004 to January 11, 2005.

Notice a first pulse of moisture that came in through the Gulf of California, responsible for the record-setting heavy rains in Death Valley and the inland deserts of California that filled up Lake Manly.  Yes, that is a kayaker in Death Valley.

Then an atmospheric river hit the coast of California with multiple pulses of heavy moisture. According to NOAA's California Nevada River Forecast Center's Heavy Precipitation Report for this event, these two storms dropped an impressive amount of rain in southern California, including a whopping 51.77 inches at Opids Camp.

 Can you feel the rain?

I made the visualizations with the help of NASA's free Panoply data viewer and GIFMaker.  You can easily make your own, too.

Links:

Wednesday, March 18, 2015

The California water crisis

As the representative Californian in my department at NCAR, I get asked a lot of questions about the drought in California. The back story is long. The science is complex. I have had a massive headache since my return to altitude. My energy is reserved for work- and remodeling-related stuff.

I'm going to send you to my favorite independent and accurate resources on the web for California water topics:
Pay special attention to the stories about groundwater pumping.  The farmers in the central valley and the golf course developments in southern California have been robbing the rest of the state (including non-human inhabitants) of water at a breathtaking pace.  In fact, in the past ~20 years, they will have stolen all of the underground water that California 'banked' in the past 100,000 to 1,000,000 years.

For this, they paid nada.  Not only that, the 200+ golf courses of the Coachella valley and other areas lobbied against even having to report to local authorities how much water they are pumping out of local and shared aquifers.  They cited privacy concerns.

I think that the 200+ golf course operators of the Coachella valley have to explain why the are more important than the survival of the endangered Desert Pupfish, who live in spring-fed pools in the same valley.

If groundwater was treated like surface water,  the Pupfishes would have senior water rights and the golf courses would never have been built in the first place.  Right now, it's the wild, wild west.  Whoever drills deepest gets everything so the short-term opportunists are grabbing all of the groundwater before someone else does.  The graphic in this Maven article explains how groundwater feeds natural desert springs.

Desert Pupfish are so cute, but future generations won't know them.
In 2006, I took Iris to see one of the last remaining habitats of the Desert Pupfish.  I wrote then:
We lured Iris to walk the entire boardwalk loop with the admonishment, "Hurry up and see the pupfish before they go extinct!"
My photo doesn't do Pupfishes justice. To see them is to love them. I really wish I was wrong about extinction.

The central valley farmers also lobbied against controls on how much groundwater they can pump.  Sensing a lost battle, they changed tactics and successfully lobbied for time to 'implement' controls.  Local governments have 5 years to form agencies to administer controls and then another 2 years to come up with a plan.  In 7 years, the underground aquifers in California might not have any water left.

A farmer said, “Nobody’s fault but God’s.” I beg to differ. It is the farmers' fault for planting hundreds of thousands of acres of water-thirsty nut groves (even in the midst of this drought!) and irrigating wastefully.

In this video, I launched a weather balloon in a lot adjacent to a nut grove near Fresno.  I did this in a couple of different places--once at night, once during the day.  In a desert, in the middle of the summer, the farmers were saturating the air with their sprinklers fed by underground aquifers.  The radiosondes registered saturated or near saturated air well above the groves.

They were using groundwater irresponsibly and unsustainably well before the drought.  Do you believe this is "nobody's fault'?

BTW, the estimate that California has just one year of water left is based upon surface water supplies only.  If the farmers and golf courses had been behaving responsibly, the underground aquifers could have held us over (with some conservation efforts).  Instead, we are in a crisis situation.

If only a few people benefited from using up California's natural 'water bank', why should everyone else pay for their folly?  The central valley is sinking at the rate of about a foot per year due to excessive groundwater pumping.  Are they paying to fix the roads and other infrastructure destroyed by that sinking?

Enough hyperventilating.  I give you some pictures of cool water in the Sierra high country in happier times.

Iris with potable water and Sierra snowmelt.
Saying, 'hi' from the creek at Lair.
Perhaps I should write about the slow-motion train wreck that is the intersection of global warming and the Sierra snowpack, our above ground 'water bank'.  But let's think cool thoughts and ignore the Pacific inter-Decadal Oscillation until I calm down.

I'm going to meditate with some soft yarn in a pretty color now.