Wednesday, October 13, 2021

Rooftop Solar Inequity or Net Metering Goes Grrr

Brian Bartholomew tweeted this out around 3 pm on a sunny autumn afternoon (October 13, 2021) along with the message, "CAISO right now"

I ran over to CAISO's real-time prices page and saw this:


If you were buying or selling electricity then, you would have paid $0.41 per megaWatt hour, or $0.041 per kWh.  

Under Net Metering, owners of rooftop solar panels who are producing more than can use can put it on the grid and be credited against their electricity use from the grid for anytime between 7AM and 5 PM.  The problem is that electricity prices fluctuate quite a bit. Here's another graph from @BPBartholomew


Say your panels are on the west-facing side of your roof and don't generate any electricity in the early morning hours you are getting ready for work/school.  You use your credited kWh banked during midday and don't have to pay for the energy.  Say you (or your kids) come home after school and turn on the air conditioning; you can crank away between 4:00 and 5:00 PM against your credits. 

A Southern California Edison (SCE) customer under the Time of Use (TOU) Prime plan, users without credits would pay 48 cents (Jun-Sep) or 45 cents (Oct-May) for that electricity.


Sometimes, net electricity costs can be negative.  You can be paid to take electricity and move it out of a congested grid. Do you have a big bank of batteries near Los Banos?  If so, you can be paid to charge your batteries tomorrow and then sell them during the evening duck curve.  It's called Energy Arbitrage. 


Meanwhile, in Los Angeles, the owners of rooftop solar panels selling electricity to SCE (which is forced by the CPUC (California Public Utilities Commission) to take it (even if they don't want/need it), can feed electricity into the grid worth 41 cents/megaWatt-hour or 0.041 cents/kWh, get credit for it, and use that 1 for 1 to offset electricity use in the evening, when it's worth 1000x that.


There is no point in me belaboring this; just read Severin Borenstein's Rooftop Solar Inequity.

I wrote a Net Metering Fact Sheet after reading lots of books, reports and government documents about how electricity is generated, moved around, regulated, purchased and used. I'm sure it will get angry comments from the people who are benefiting the most from California's current Net Metering policies. It's important to know that academics, government scientists and CPUC agree that overall, people with rooftop solar are benefitting at the expense of those without.

This "Energy Waterfall" plot showing the different 2019 costs for the three largest electricity providers in California from Ensuring Equity in California’s Energy Transition was very convincing. Look at the right-most column of Public Purpose Programs.  The thin green slice is aid for low-income customers under the CARE program. The fat brown slice is payment to PV owners (solar rooftop) under the current net metering scheme. 
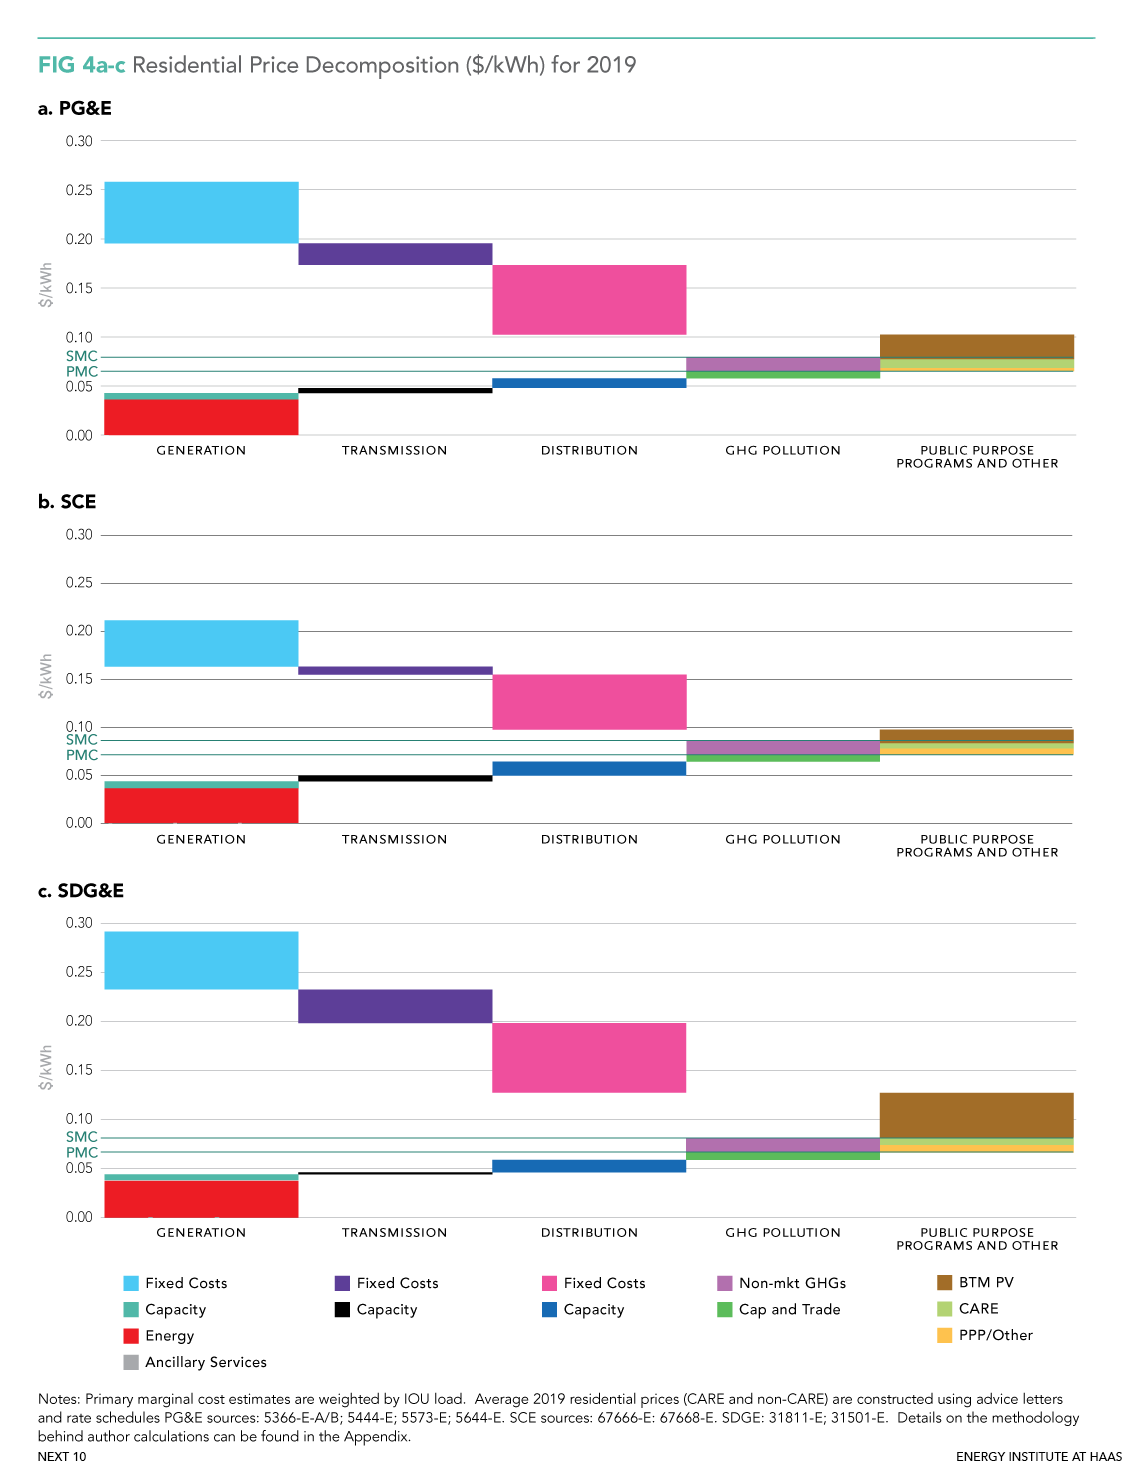
 

Here's the detail of CARE and PV subsidies. We spend more subsidizing rooftop solar owners than low-income electricity users.  A lot more.


Who benefits from rooftop solar?  People who own their own homes and don't need to obtain HOA approval. That's basically people who live in Single Family Homes and have enough cash or home equity to purchase solar systems. They tend to be much wealthier than those who subsidize them.  (I know that lower income people have been growing among the rooftop solar owners, but that is largely because they were pushed out to live in new homes built in the deserts.)

That cost-shift from rooftop solar owners to those without is about $2 billion in 2019 and growing.

This post grew too long, so I split it up into another one explaining the Duck Curve and California's renewable energy portfolio. Stay tuned. 

Speed Kills (& doesn't get you there any faster)

Getting data out of some public agencies is so hard.  But, Redondo Beach Policy Department Tweeted this out today. It shows the traffic count at all hours of the day for a 15 day period between September 23 and October 7, 2021 at 1700 Artesia Blvd (just west of the intersection with Aviation Blvd).


On the top left plot of traffic counts:

  • Green is Compliant
  • Yellow is Inside Threshold
  • Red is Violators
There doesn't seem to be any violators so that looks great, right? 

Notice that the Threshold is set for 5-10 miles per hour above the 35-40 mph speed limit (which was ratcheted up from 35 to 40 mph by speeders due to the 85 percentile rule.) So you can speed up to 50 mph near an intersection of two busy arterials and not get a speeding ticket.

This should concern all of us because speed is the overwhelming determinant of whether a pedestrian or cyclist will die when hit by a motorist. CalBike showed this in yesterday's webinar, summed up by Warren Wells in a Tweet thread


Killing 40,000 people per year in the name of economic efficiency is worth it, right? (Sarcasm light flashing)

The dirty little secret is that it doesn't even get us there any faster. 

I found this nugget from A Century of Fighting Traffic Congestion in Los Angeles. The faster vehicles go, the more following distance they consume. (The same goes for taller vehicles like trucks/SUVs, which are much more to blame for traffic congestion than bike and bus lanes.) Road occupancy (space covered by a car) goes down with speed. 


The sweet spot for moving the most vehicles in a limited area and time is around 20-25 mph. Above that, you don't move any more people, but you make the roads more deadly. 


To quote the UCLA report:
  1. When cars are traveling at free flow speed and more cars are added the flow increases. 
  2. Flow continues to increase until the critical density. 
  3. Every additional car now lowers speed on the roadway. 
  4. Since cars are traveling slowly when traffic is dense, fewer cars overall are passing a given point on the roadway. 
  5. The relationship between density of traffic and speed is non-linear. 
  6. Figure 2 shows the relationship between speed and flow. As described above, flow increases until the roadway reaches capacity then begins to decline.
So why are we allowing people to speed up to 50 mph near a high school, two daycare centers/nursery schools, an elementary school and two senior housing complexes?


It's time to lower the speed limits on both residential streets and arterials.  

It's time to build out the South Bay Bicycle Master Plan (passed in 2011), and put *Protected* bike lanes on arterials.  Paint is not protection as the evidence and the bodies mount up. 

Both Artesia and Aviation Boulevards are supposed to get bike lanes whenever the roads were getting work done.  In the last decade, very little of the promised *Connected* network has been built.  What was built, is sadly disconnected and often in door zones next to fast-moving traffic.


Redondo Beach is using eminent domain to obtain land to build a right turn lane on Northbound Aviation, also without building a bike lane. 

Take a look at the graphic up at the top again.  The median and average speeds at most hours of the day and evening is 20 mph.  It's only higher around 2am, bar closing time.  What if we just made that the speed limit?  

Traffic flow would remain the same, but lower speeds would reduce road noise, making walking on the street more pleasant and welcoming. See also, Road noise and what we can do about it.

I've written letters.  I've gotten nowhere.  I need others to help apply political heat so that we see meaningful change on our streets.  Please.  Let's build streets where high school students can safely ride their bikes to school and our seniors can walk to senior fitness classes at the HS pool. 

Tuesday, September 28, 2021

Vacancy Truths

Every heard about Vacancy Truthers?  They are people who deny that we need to build more housing. I hadn't heard of them either until I started attending housing forums to advocate for building more housing. Darrell Owens has written an excellent article about the Vacancy Debate.  Please read it.


What is the right level of vacancy?  It was shocking (but welcome!) to arrive in Redondo Beach in the middle of a recession and have lots of apartments to choose from.  Housing seemed abundant, even though the vacancy rate wasn't over 10%.  It just felt relatively abundant because Bad Dad and I had become acclimated to housing scarcity.

It feels wild to read a paper about Homeless in America, Homeless in California by John M. Quigley, Steven Raphael, and Eugene Smolensky.  The 1990s seemed so long ago, and we can only dream about vacancy rates and rent to income ratios like this.


This paper was published in 2001 in Harvard/MIT's The Review of Economics and Statistics.  They analyzed the numbers from around the country to study homelessness and tested two hypotheses.  They debunked the hypothesis that homelessness was primarily caused by Reagan-era policies to close Mental Hospitals.  If this was true, then there should be a positive association between homelessness and patients released from mental hospitals in different cities and over time.  They didn't. 

Instead, they saw the opposite.

They then looked at vacancy rates, rise in rents, and rent to income ratios.  Bingo, that's why California is a homeless magnet.  California is special because we have the most extreme housing scarcity.  For each increase in vacancy rate from an average of 6.7%, there would be a 25% drop in homelessness.  The opposite can happen.  If vacancy drops, conditions allow landlords to raise rents, and more people fall into homelessness.

Economists broadly agree that a 5-7% vacancy rate stops rents from rising.  Los Angeles' vacancy rate was 4.2% in 2017


The rent is too damn high, which means that people on low fixed incomes (SSI, non-wealthy retirees, Section 8 voucher holders) cannot find housing that fits their budget.  This is why Redondo Beach has unused Section 8 vouchers.  My preferred policy choice is to make housing more abundant, so that the vacancy rate rises and rents come down. 

California has made a different choice.  We seek only to staunch the bleeding, but not to heal the patient by bringing rents down.  In the 6th Round of the Regional Housing Needs Assessment (RHNA), cities only have to plan for enough housing to raise the rental vacancy rate to 5% and the owner vacancy rate at 1.5%.  


There is no natural reason why for-sale homes have to be so scarce.  That's a policy choice to prop up sky-high home prices that are already unaffordable for most Californian workers. 1.5% still perpetuates rising prices.  The data since 2017 is even more grim.  California's owner vacancy rate in 2020 was 0.7%, which fomented bidding wars and home sale prices climbing at double digit rates in the midst of a pandemic.