Getting data out of some public agencies is so hard. But, Redondo Beach Policy Department Tweeted this out today. It shows the traffic count at all hours of the day for a 15 day period between September 23 and October 7, 2021 at 1700 Artesia Blvd (just west of the intersection with Aviation Blvd).
On the top left plot of traffic counts:
- Green is Compliant
- Yellow is Inside Threshold
- Red is Violators
There doesn't seem to be any violators so that looks great, right?
Notice that the Threshold is set for 5-10 miles per hour above the 35-40 mph speed limit (which was ratcheted up from 35 to 40 mph by speeders due to the 85 percentile rule.) So you can speed up to 50 mph near an intersection of two busy arterials and not get a speeding ticket.
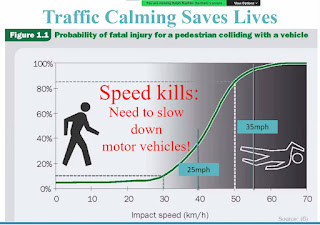
This should concern all of us because speed is the overwhelming determinant of whether a pedestrian or cyclist will die when hit by a motorist. CalBike showed this in yesterday's webinar, summed up by Warren Wells in a Tweet thread.
Killing 40,000 people per year in the name of economic efficiency is worth it, right? (Sarcasm light flashing)
The dirty little secret is that it doesn't even get us there any faster.
I found this nugget from
A Century of Fighting Traffic Congestion in Los Angeles. The faster vehicles go, the more following distance they consume. (The same goes for taller vehicles like trucks/SUVs, which are much more to blame for traffic congestion than bike and bus lanes.) Road occupancy (space covered by a car) goes down with speed.
The sweet spot for moving the most vehicles in a limited area and time is around 20-25 mph. Above that, you don't move any more people, but you make the roads more deadly.
To quote the UCLA report:
-
When cars are traveling at free flow speed and more cars are added the flow increases.
- Flow continues to increase until the critical density.
- Every additional car now lowers speed on the roadway.
- Since cars are traveling slowly when traffic is dense, fewer cars overall are
passing a given point on the roadway.
- The relationship between density of traffic and speed is non-linear.
- Figure 2 shows the relationship between speed and flow. As described above, flow increases until the roadway reaches capacity then begins to decline.
So why are we allowing people to speed up to 50 mph near a high school, two daycare centers/nursery schools, an elementary school and two senior housing complexes?
It's time to lower the speed limits on both residential streets and arterials.
It's time to build out the South Bay Bicycle Master Plan (passed in 2011), and put *Protected* bike lanes on arterials. Paint is not protection as the evidence and the bodies mount up.
Both Artesia and Aviation Boulevards are supposed to get bike lanes whenever the roads were getting work done. In the last decade, very little of the promised *Connected* network has been built. What was built, is sadly disconnected and often in door zones next to fast-moving traffic.
Redondo Beach is using eminent domain to obtain land to build a right turn lane on Northbound Aviation, also without building a bike lane.
Take a look at the graphic up at the top again. The median and average speeds at most hours of the day and evening is 20 mph. It's only higher around 2am, bar closing time. What if we just made that the speed limit?
I've written letters. I've gotten nowhere. I need others to help apply political heat so that we see meaningful change on our streets. Please. Let's build streets where high school students can safely ride their bikes to school and our seniors can walk to senior fitness classes at the HS pool.


