Sunday, September 18, 2022

Engineering Disinvestment

You can engineer disinvestment in communities with weaponized zoning. Let me show you how it was done in my community. 

Behold, the Redondo Beach Zoning Map


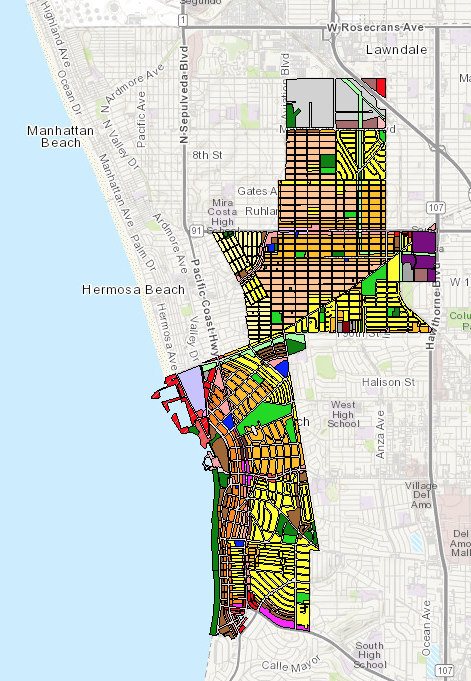
Let me zoom in on two sections, South Pacific Coast Highway 1, and Artesia Boulevard. According to the City's own Traffic Volumes Study, they get roughly the same traffic volumes, 29,000-39,000 vehicles/day (dark green). I verified it on the Caltrans Traffic Census Program website. PCH at Palos Verdes Blvd gets 30,000-33,000 vehicles/day while PCH/Torrance Blvd gets ~40,000 vehicles/day (blue). 


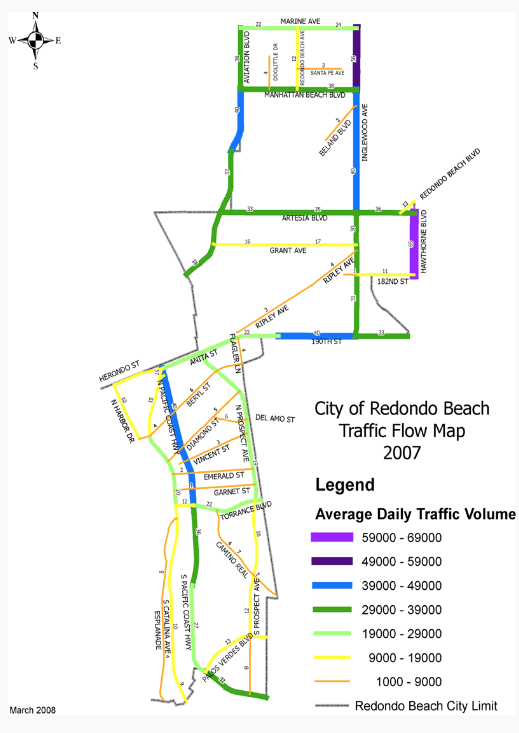
Artesia Blvd used to be CA 91 but the cities assumed control, so their traffic volumes are no longer measured and reported by Caltrans. I looked up a bunch of traffic studies on the Torrance, Lawndale and Redondo Beach websites and it looks like the RB section of Artesia gets about 35,000-40,000 vehicles/day. 

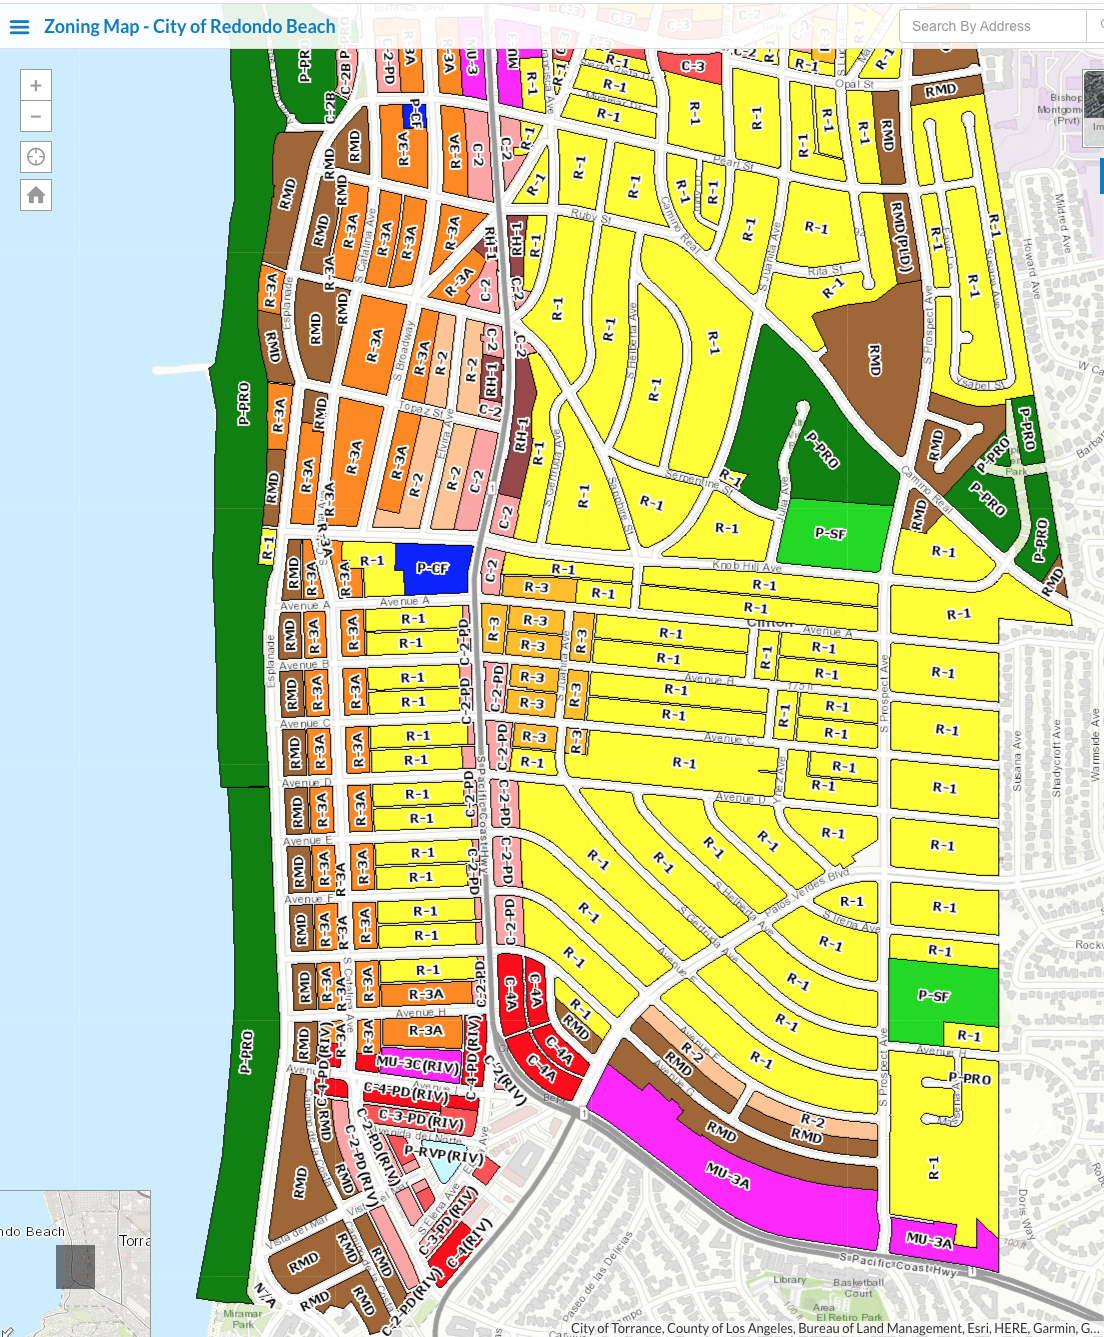
Let's take a closer look at the zoning map in these two areas. 

South PCH has large areas of Single Family Home R-1 zoning. It's low density by design. Yet, the commercial and mixed use areas along PCH from Avenue A to Prospect are all C-2-PD, C-4A, MU-3A. PD stands for Pedestrian-Oriented. 


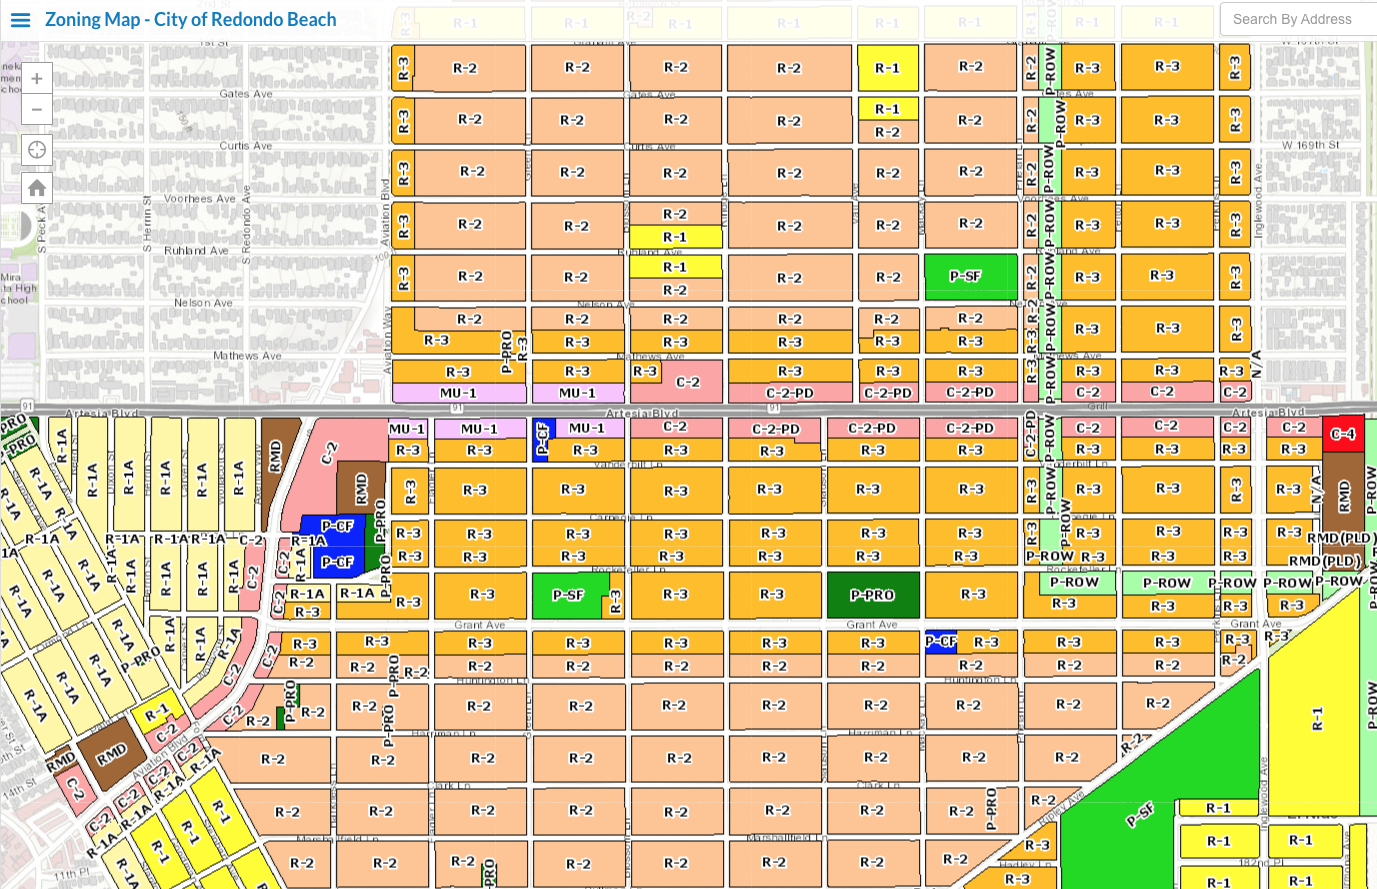
Along the Artesia Corridor, the residential zoning is R3 or R2, 2-3x as dense as along PCH. Yet, the commercial and mixed use areas along Artesia Blvd are zoned mainly for lower-intensity MU-1 and C-2, with 3 blocks zoned at C-2-PD. 


Redondo Beach Ordinance 10-2.1706: Commercial, industrial, and other nonresidential parking standards.


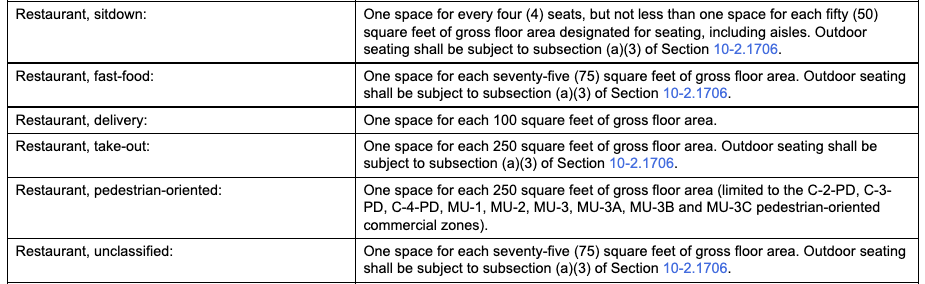
This zoning has a major impact on how the land is developed and how much the land is worth. Take a look at the parking minimums. A restaurant in C-2 needs one parking stall per 50 sf of dining space, including aisles or one space per 4 seats. A restaurant in C-2-PD only needs 20% as much parking, or one space per 250 sf of dining space. 

This guarantees vast moats of parking lots, and no new sit-down restaurants can be permitted. Look at the west end of the RB Artesia Corridor. The only restaurants are take-out or drive-through (blue boxes). Even the coffee shops, Starbucks and Coffee Bean & Tea Leaf must be drive-through. 

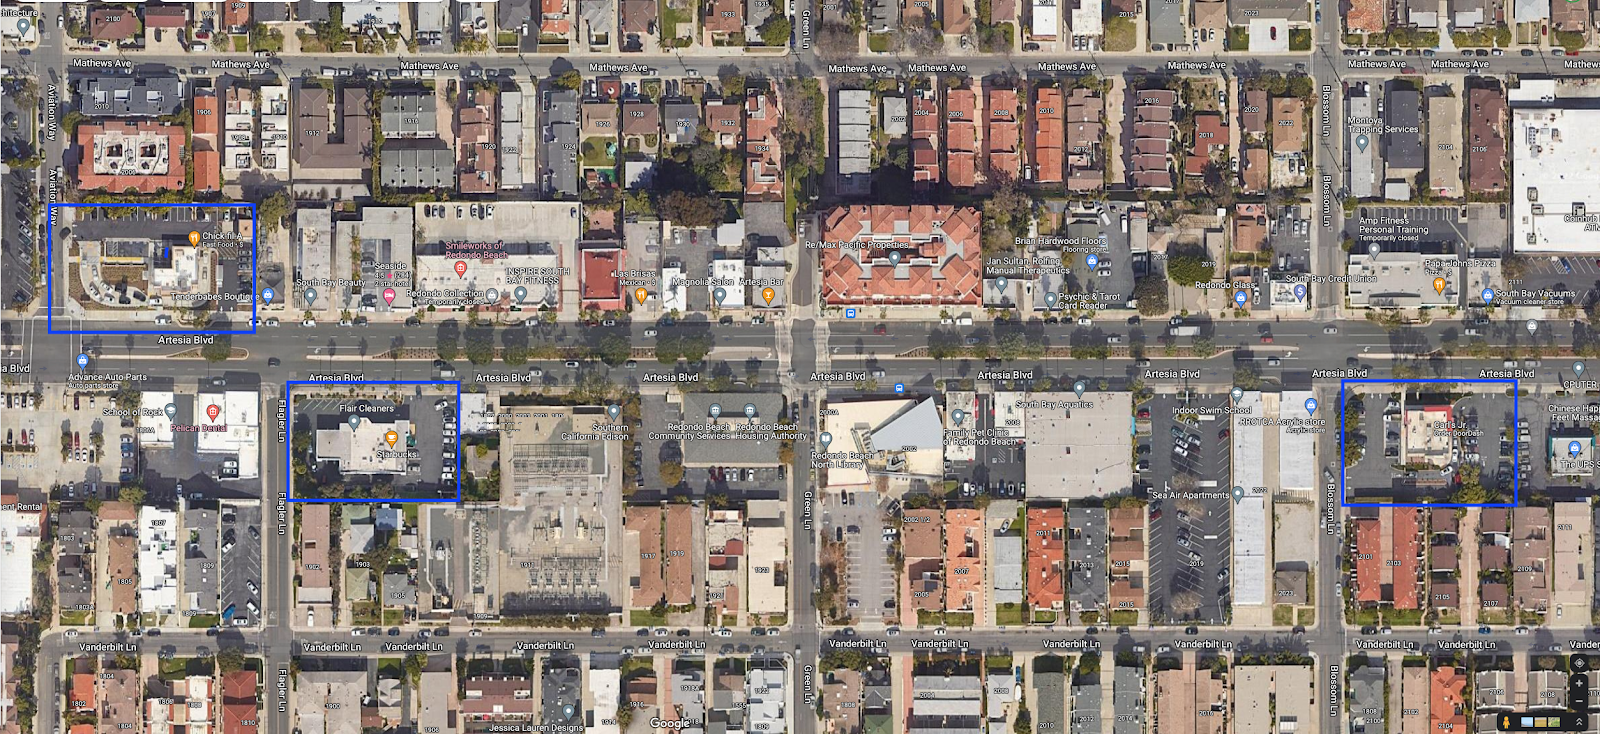
Needless to say, walking through this area is dreary and hot, with all that asphalt. There is one sit-down restaurant, Las Brisas, that predates the parking ordinance and is allowed to operate. However, should they want to sell the place, and the new owner wants to remodel, they will be subject to the current rules. 

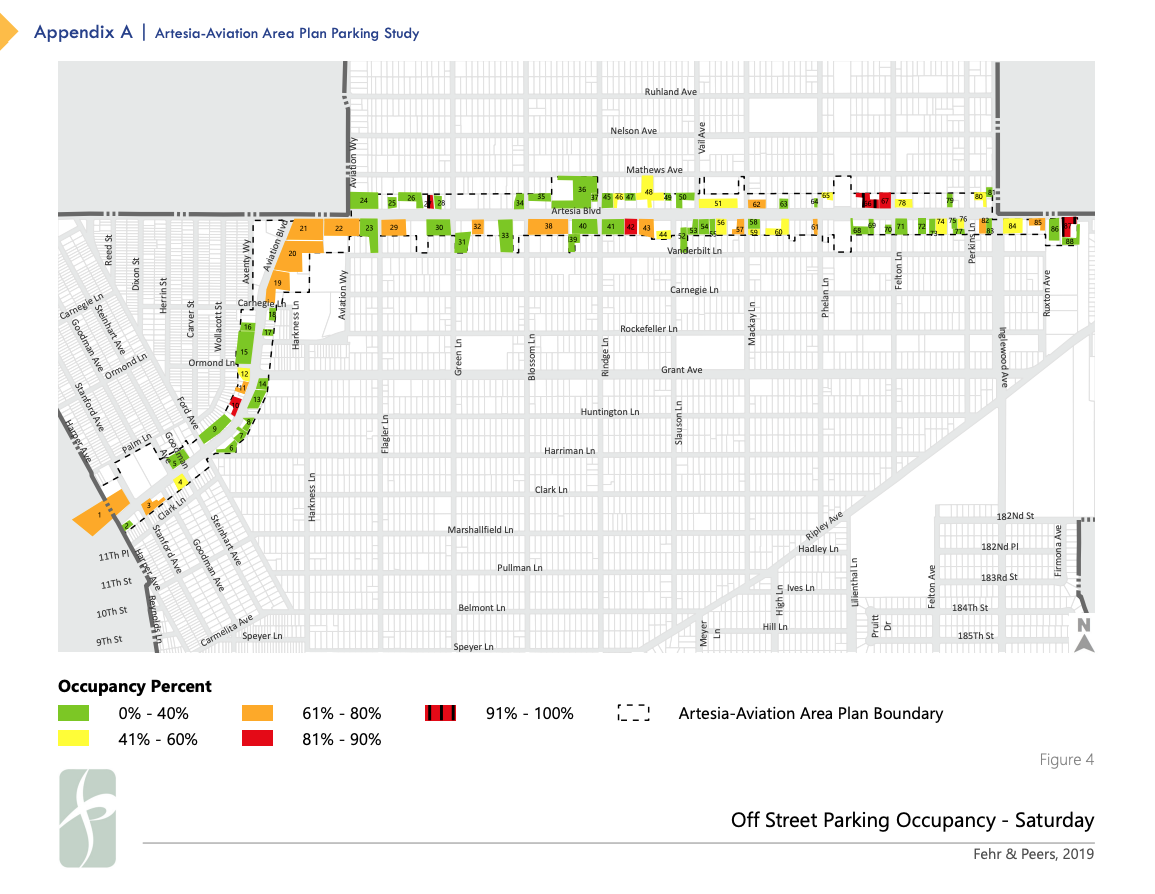
According to the city's own 2019 study (Appendix A), existing uses along Artesia only have half as much off-street parking as is currently required. Yet, only 0-95% of that is used at peak times (except at 2 small parcels, where people park on the street or in adjacent lots). Here's the parking census at peak times. See all that green? That's 0-40% utilizations at peak. The rest of that time, the asphalt is mostly empty. 

Donald Shoup explained in The High Price of Free Parking that 85% parking utilization is optimal for attracting customers in cars. Above that, people don't bother to drive there. Below that, they can confidently go with the expectation that they will find parking nearby. 

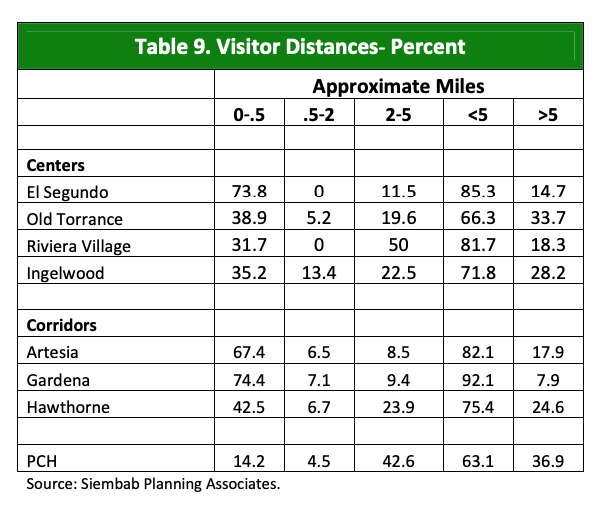
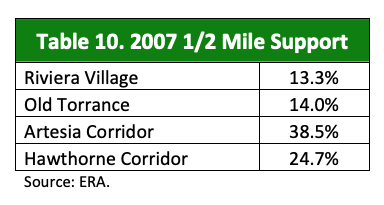
It gets worse. A 2009 South Bay Sustainability Report showed that Artesia gets 67.4% of their visitors from within half a mile (walking distance) of the corridor while Riviera Village (South PCH area) gets only 31.7%. Artesia gets another 6.5% between 0.5 and 2.0 miles (bicycling distance) while South PCH gets none, 0%. 

Here's a map of the 1/4 and 1/2 mile study area. 

The Artesia Corridor leads the South Bay in percentage of dollar sales that come from people who live within walking distance, 38.5%. Riviera Village in South RB only gets 13.3%. 


That was 2009. What's changed since then? Well, infill of R1 to R2 or R3 townhomes is nearly complete. The Artesia Corridor residential density is now 17,000 people/square mile, 2-3x denser than the R1 zoned areas of South RB. While SRB has the main library and post office, the smaller NRB branch libraries and post office are highly utilized. So are the grocery stores and pharmacies. In fact the Walk Score of this NRB mixed use development is 86/100, Bike Score 64/100. 


Meanwhile, this "Pedestrian Oriented" stretch of South PCH in SRB has a lower Walk Score of 76/100, Bike Score 49/100. 


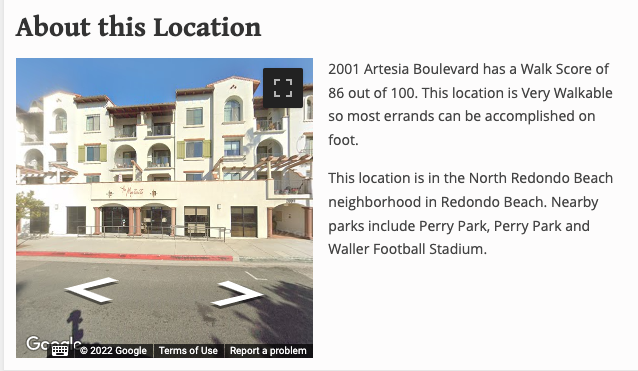
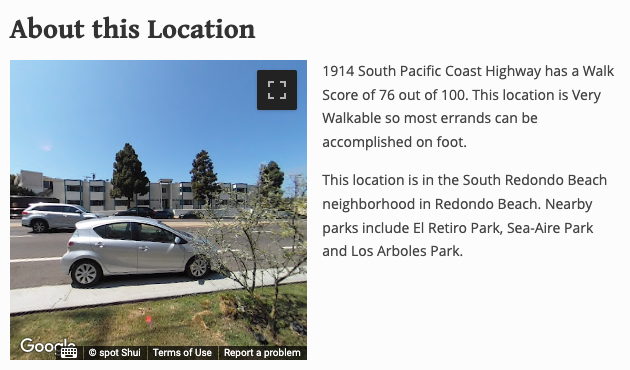
Why is the less dense neighborhood with a lower Walk Score zoned for Pedestrian-Oriented use while the denser neighborhood is zoned for parking lots? Why does one neighborhood get sit-down restaurants and the other gets parking lots and drive-through businesses with idling cars? 

It all comes down to who is "deserving" of nice things, like sit-down restaurants; and who deserves to serve as a car sewer for people driving between the freeway and the beach.

The HOLC "Redlining" map provides a clue. The Riviera area gets a Green rating due to Covenants that "Restrict ownership to the Caucasian race in perpetuity. All providers are strictly enforced."

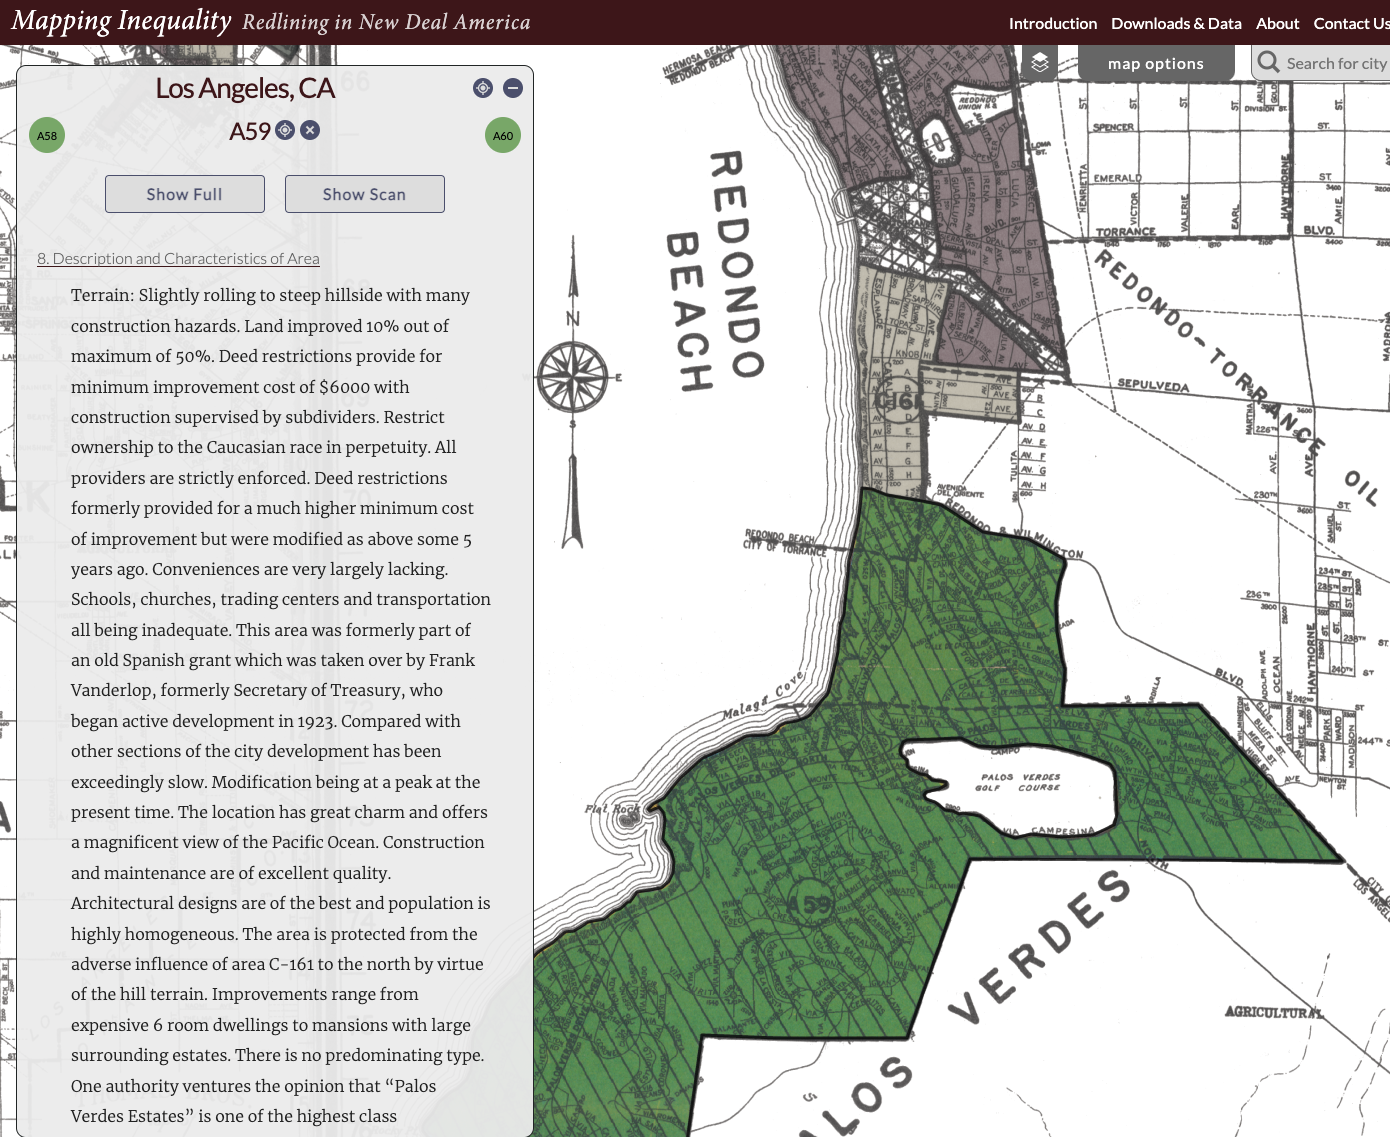
The Artesia Corridor (formerly Redondo Beach Blvd) gets a Low Red rating due to "Mexicans, Japanese & Italians".  

This is ancient history, right? These covenants have not been legally enforceable for 50 years. 

In the 2020 Census, LA County was 26.7% non-Hispanic white/47.9% Hispanic/14.2% Asian/8.3% Black/2.2% Mixed. 

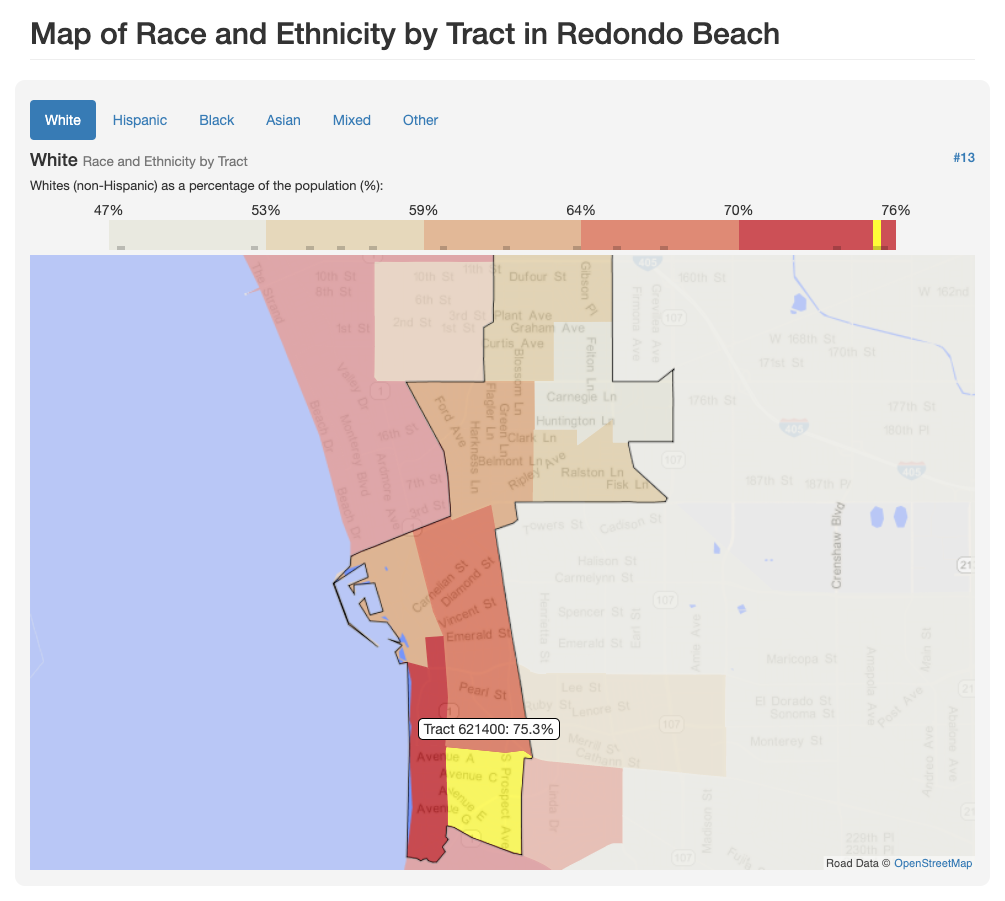
Yet, this SRB census tract is 75.3% white/10.4% Hispanic/9.5% Asian/1.5% Black/3.3% Mixed. It is an outlier many standard deviations away from the mean. 

It didn't happen by accident. 

Zoning has become the proxy for race. "Preserving Neighborhood Character" and Single Family zoning restricts the number of new people who can move in. It also ensures that the new people who move in (if they didn't inherit their home) have to be very high bidders. Because whites have more net worth than any other group, the new people who do manage to buy there are much whiter than the general population. 


In contrast, the census tract containing the 2008 mixed use building on Artesia is 55.9% non-Hispanic white/14.6% Hispanic/16.5% Asian/4.4% Black/8% Mixed. This is more integrated than usual for a coastal Los Angeles County suburb. This census tract started out more diverse. Through infill, it was able to preserve diversity even as it gentrified. 

The ratio between Blacks and Asians reversed in the last 25 years, but nearby Madison Elementary School has both a Title I designation (22% low-income children) and an annual multi-cultural potluck that is lit. The children live in homes where dozens of different languages are spoken. The school population is 34% non-Hispanic white/29% Hispanic/13% Asian/5% Black/15% Mixed. 

[Note: I wrote about this building in New Construction Subsidizes Old; it has been called "a failure" by Mayor Bill Brand, who subsequently (with aid from some council members) downzoned Artesia so that nothing taller the commercial height limit is 1-story now.]

A 20-year old North Redondo Beach Business Association survey showed that the business owners along the one-mile stretch of Artesia, between Inglewood and Aviation, represented 20 different countries with many first-gen immigrants. 

Which brings me back to Engineering Disinvestment. By requiring parking minimums that existing buildings don't meet, and forcing new construction to meet the new impossibly high standards, and then piling on FAR (floor area ratio) and height limits, the city can ensure that nothing "pencils out".  Nothing can be replaced. It will just slowly rot. 

When business owners retire, the lot is their retirement fund. When they try to sell their lot, no one can pay very much. If the new owners modernize it, it would trigger the new zoning and parking rules. This is literally robbing these small business owners of hundreds of thousands of dollars on small lots, perhaps over a million on the larger lots. 

Anyway, I may lament the lack of sit-down restaurants in my neighborhood, but at least I enjoy a 15-minute neighborhood where I can visit the library, post office, grocery, pharmacy, UPS/Kinko's, hardware store, and even a sewing machine store that sells high-end Swiss Mettler thread. 

The shop owners that I depend on, though, are being robbed of their life's savings.

In the words of Frank Wilhoit (the composer):

Conservatism consists of exactly one proposition, to wit: There must be in-groups whom the law protects but does not bind, alongside out-groups whom the law binds but does not protect.

Tuesday, August 23, 2022

eBikes vs Direct Air Capture

Following up on my previous post about the relative carbon intensity of eBiking vs driving. and another post about utility cycling around town...

I read that the Denver eBike Voucher program has already put 2,100 eBikes on the streets. I did a little back of the envelope math. 

Suppose each of those bikes replace 3,000 mi/year of automobile travel in gasoline vehicles that get 20 mpg in the city. Then they collectively avoid almost 3 Million kg of CO2/yr or 3,000 mT (metric tons).

3,000 mi/yr * .444 kgCO2/mi * 2,100 eBikes = 2,797,200 kgCO2/year 

Further suppose that the eBike riders are using 10 Wh/mi or .01 kWh/mi (calculation from Utility Cycling). Collectively, they are using 63 MWh/yr.

3,000 mi/yr * .01 kWh/mi * 2,100 eBikes = 63,000 kWh/yr = 63 MWh/yr

The electricity comes from the grid, and Colorado's grid has a CO2 intensity of 537 kgCO2/MWh. We need to subtract that from the CO2 savings. 


537 kgCO2/MWh * 63 MWh/yr = 33,831 kgCO2/yr

Unleashing 2,100 eBikes being ridden instead of cars for ~8 mi/day (short, local trips), makes 2,763.4 mTCO2 disappear every year. 

2,797,200 - 33,831 = 2,763,369 kgCO2/yr = 2,763.4 mTCO2/yr of avoided CO2 emissions per year. 

As the Colorado grid becomes cleaner, the CO2 savings grow.

There are many ways to make CO2 disappear from the atmosphere and they all have issues. People love nature-based solutions, but we're emitting too fast for them to be effective. If it's sequestered in a tree, then a fire can release all the carbon back into the atmosphere. If it's sequestered in soil, and someone comes and plows it up, some of it is released again. Trapping CO2 in the ocean, e.g. with kelp, is very inefficient and will only take a nibble out of current emissions. 

There are a couple of high-tech solutions, Carbon Capture and Sequestration (CCS) and Direct Air Capture (DAC). CCS can only be done at the source, like in the outflow of a power plant. CO2 is concentrated right at the source, but removing it costs 30-40% of the energy you just produced in burning stuff at the power plant. 

But, CCS is viable (as long as you have a place to sequester the CO2 forever), and the people who produce the CO2 pay for removal of the CO2. That makes accounting easier. Those who pollute, pay. 

But all of us are out there, driving cars, flying in airplanes and getting stuff delivered in trucks.  We're not going to carry around a CCS plant in our vehicles.  So we emit CO2 into the atmosphere where it gets well-mixed.  

Remember thermodynamics class in college? The more disordered a system, the more energy it takes to bring order to it?  DAC is enormously expensive and energy-intensive compared to CCS, which is already expensive and energy-intensive. 

No wonder people question whether DAC is a good use of money vs not emitting so much CO2 in the first place. I think those people are right, it's a waste of money. 

However, we've emitted so much CO2, that we painted ourselves into a corner. We don't want to pay for DAC, but we have to do it anyway. Did I mention that it's enormously expensive and only the government has that amount of money to spend? 

DOE announced it will spend $3.5 Billion to build 4 DAC plants. That won't even cover the full cost of building them or include the cost of running them. 

Meanwhile, a single bike lane installed in Thailand in 2015 has removed $1 Billion worth of DAC CO2 removal in avoided vehicle trips. And they use smaller vehicles like motorcycles in Thailand. Click through the read the very detailed journal article! It takes a while to load, but the full article is available for free. 

It sucks that individuals emit CO2, and the richest emit the most, but we don't price carbon so we socialize the cost of building DAC plants to clean up after the rich. Yes, we will all end up paying for Kylie's 2 minute private jet jaunts around Los Angeles. Removing the CO2 she dumped may end up costing the public more than it cost her to take the flight.

The Energy Information Agency (a part of the US Dept of Energy, DOE) estimates that Direct Air Capture (DAC) to pull that much existing CO2 out of the atmosphere costs about $250/mTCO2, not counting the cost of putting it someplace. Let's just use $300/mTCO2 for our calculations*. 

The value of not driving 2,100 vehicles 3,000 mi around the city is worth ~$830,000/yr in DAC CO2 removal.

2,763.4 mTCO2/yr * $300/mTCO2 = $829,011 

Suppose they gave a rebate of $400 for each bike, then Denver spent $840,000 in vouchers. 

But, the vouchers can only be spent in local shops, which generate sales tax. By the time you add that in, the two numbers are roughly equal.  

But the eBikes keep rolling, year after year (my eBike is 5 years old), avoiding CO2 emissions while you have to keep using huge amounts of energy pulling CO2 out of the atmosphere and throwing lots of $ at DAC year after year.   Avoiding CO2 emissions by swapping eBikes for cars looks like a pretty good deal. 

Anyway, Denver gave out vouchers of $400 ($1,200 for low income) and an additional $500 for more expensive cargo bikes capable of carrying passengers or lots of cargo. They also targeted delivery workers, who put in a lot of miles. 

It may take more than a year for the avoided cost of CO2 to pay for the vouchers. But, it has other benefits of reducing traffic congestion, air pollution and improving public health. It's a very cost-effective program and we should scale it up and replicate it. 

Which brings us to the California Air Resources Board (CARB) meeting on Wednesday, August 24, at 3:30 PDT. Click on the link to register for the Zoom meeting.
The California Air Resources Board (CARB or Board) invites you to participate in a work group meeting to discuss the Electric Bicycle Incentives Project. We invite all stakeholders to attend and provide their input and feedback on program design. The meeting agenda and any handouts will be posted to the Low Carbon Transportation Investments and Air Quality Improvement Program website ahead of the meeting.
California set aside $10 Million for eBike rebates/vouchers, but has yet to select a vendor or even an implementation program (despite promising a roll-out in July 1, 2022). So attend the meeting tomorrow and tell them to quit studying equity and just do something. They can refine the system later as they study the outcomes. 

If you want, cite the economic efficiency of avoided CO2 emissions versus future DAC. 

I'll get you started with the math. 


If each bike displaces 3,000 vehicle miles/yr at .444 kg/mi = 1,332 kgCO2/yr. 

But they will use 30 kWh = .03 MWh/yr of electricity

.03 MWh/yr * 225 kgCO2/MWh = 6.75 kgCO2/yr

That's 1,332 kgCO2/yr - 6.75 kgCO2/yr = 1,325.25 kgCO2/yr

A metric ton is 1,000 kg so each eBike results in 1.325 mTCO2/yr in avoided emissions, worth $398/yr.

* Estimates of the cost of DAC are about as real as the Hyperloop because we have so little real data.  The International Energy Agency report on DAC:
There are currently 19 direct air capture (DAC) plants operating worldwide, capturing more than 0.01 Mt CO2/year, and a 1Mt CO2/year capture plant is in advanced development in the United States.
So all the DAC plants currently in existence can pull 0.01 Million metric tons (1,000 kg) CO2 out of the atmosphere. That's 10,000 mT. The modest Denver program avoids almost 3,000 mT/year of emissions. I would say that the Denver eBike subsidy is the most successful existing CO2 removal program in the US. 

No wonder countries around the world are increasing their eBike subsidies. 

Carbon Intensity of eBiking vs Driving

 
Remember when I ran some numbers about my utility cycling around the South Bay (SW region of Los Angeles County)? I use a Kill A Watt meter to plug in my eBike charger so I know how much electricity I use.  I also keep track of my miles so I know that I use 5-10 watt-hours/mile while running errands that I normally would do by car.  


Let's use the higher 10 watt-hours/mile number for when I want to get somewhere quickly but don't want to get sweaty. 

My Class 2 eBike tops out at 20 mph, but my area has a lot of stop signs and stop lights. 

My Prius hybrid calculates my trip average speed and I know that I average 16-17 mph on those 3-12 mile round trip errands. 

Basically, I go the same speed by car and eBike. 

This is why people complain about traffic in my area. Driving speeds are slow. Alternatively, we can reframe that to "eBikes will get you there just as fast as driving, while building moderate exercise into your daily routine."

[My census tract has 17,000 people/square mi and the California DMV found that the South Bay has anomalously many cars/registered driver (over 1!). Anyway, we are a car-dependent suburb even though we have the density to support better ways of getting around. People also complain about parking. It's a problem when we own so many cars and we don't put them in our garages because our garages are stuffed with things that are not cars.   Anyway, I digress.]

This post is about the carbon intensity of eBiking vs Driving. 

California passes lots of regulatory laws, including one that requires us to track the carbon intensity of our electricity supply. CAISO is the public agency in charge of operating our electricity grid and they publish data from real-time statistics to year end reports to help us track whether or not we are meeting our myriad goals. 

As the League of Women Voters California Energy Subcommittee team leader, I stalk the CAISO data website a lot more than the average Californian. 

Visit the CAISO Emissions page and see the instantaneous CO2 intensity of the California grid. 


Last Sunday, I hung out the laundry and plugged in my eBike at midday, when the grid CO2 intensity was at it's daily nadir, 0.14 mTCO2/MW. (Midday on weekends, on sunny but not overly hot days, have the lowest CO2 intensity.)


If you missed it in real-time, you can still reconstruct the CO2 intensity by downloading the 5-minute grid CO2 emissions and total system demand data for a given day, and then dividing it for the ratio.  I pulled the data for Sunday, August 21 and put it in Google Sheets. LOL, I really took a screen shot at the absolute minimum for the day. 


A mT or metric ton is 1,000 kg. A MW = megawatt = 1,000 kilowatts. Metric conversions are so easy. 

.14 kg CO2/kWh 

.14 g CO2/Wh 

At 10 Wh/mi, I emitted 1.4 g CO2/mile running my errands last Friday and charging at midday on Sunday. 

The EPA publishes stats on GHG emissions from passenger vehicles assuming 22 mpg. 


I was tweeting from my phone and mis-remembered it as 440 g/mi using 20 mpg. That's only 1% off from the actual 444 g/mi.  Anyway, using the 440 number, I got a cute number of very close to 100*pi 

440/1.4 = 314

Of course, I drive a hybrid and get ~40 mpg so the ratio for me driving vs eBiking is 159. 

I looked at Tesla drivers' forums and it seems they use about 300 Wh/mi or 30x as much electricity as me on my eBike. If they charge only at midday, then they would be emitting 42 g/mi, which is not bad. But, if they are charging in the middle of the night, as utilities encourage them to do, then the CO2 emissions intensity doubles to 84 gCO2/mi. 

Then there's the embodied emissions of producing electric cars. Their batteries are hundreds of times larger than my eBike's and about 10x the size of a plug-in hybrid.

Tesla Y: 75 kWh battery

eBike: 0.5 kWh battery

Prius Prime: 8.8 kWh battery (plug-in hybrid)

There are serious environmental issues with battery production for EVs. We're up against physical limits. We can't produce them fast enough for the fossil-fuel transition unless we drive a lot less than we currently do. 

Anyway, the bottom line is to minimize your car driving, do it in an EV if you have one. Hybrids, particularly plug-in hybrids, are a decent trade-off as long as you don't drive it a lot in gasoline mode.

If you don't have solar panels, charge when your grid is cleanest. (This varies by region.) If you have solar panels, charge when your panels are producing more than the rest of your home needs.