Monday, July 18, 2022

So your city has declared a climate emergency

 We are experiencing record heat in both North America and Europe, during a La Nina year (when the planet surface tends to be cooler than average).  The only way to stop this long-term runaway heating is to quit emitting so much CO2 and other planet-warming gases. Yet, our elected leaders, even in deep blue states, are not doing the necessary work.

I am so tired of fighting for substantive changes that I wrote about in Data Driven Climate Action. We know that 44% of LA County's GHG emissions comes from the transportation sector. If you add fossil fuel refining, it's over 50%. Over 2/3 of transportation emissions comes from private light-duty vehicles (cars, trucks, SUVs, minivans).  Much of those miles are "junk miles" in the sense that they are short trips that could be done without a car if the built environment were not so auto-centric. 

I have been a bicycling advocate since graduate school in the 1990s, when I was studying gas-phase chemical physics. We knew it was cars back then, and it's still true today. 

Global Atmospheric CO2 was 360 ppm (parts per million) when I volunteered for my first Boulder BikeWeek. 

CO2 was 367 ppm when I volunteered for my first El Segundo Bike to Work Day Challenge in 1998. 

CO2 was 369 ppm when I went to my first Beach Cities Bicycle Network Community Outreach meeting in 1999.  Community outreach took forever. My 21 year old daughter wasn't even conceived yet, which was why I had time to attend the meeting. 

CO2 was 392 ppm in 2011 when the South Bay Bicycle Master Plan was adopted. Cities pledged that they would add the bike lanes when they repaved or did work on any of the streets in the network. Over time, the network would be completed. A few cities did the bare minimum, striping in door zone bike lanes or stenciling sharrows when they repaved streets. Others, just ignored the plan. 


CO2 is 428 ppm in mid-2022.  Here are the existing bike lanes in the Beach Cities. Transportation planners are still expecting people to drive to the beach and ride along the Strand as recreation, not as every day transportation.


Here's the innovation in 2022. Those promised bike lanes will become a Local Travel Network, LTN, suitable for use by all sorts of low-carbon vehicles such as electric golf carts, eBikes, eScooters, motorized wheelchairs, skateboards, etc. They plan to start delivering this network in 2024. Notice how much less ambitious it is than the 2011 plan. It will not include anything other than sharrows and a few beg buttons at existing traffic signals. Unlike the 2011 plan, there will be no new traffic signals to allow cyclists to cross busy arterial streets. 
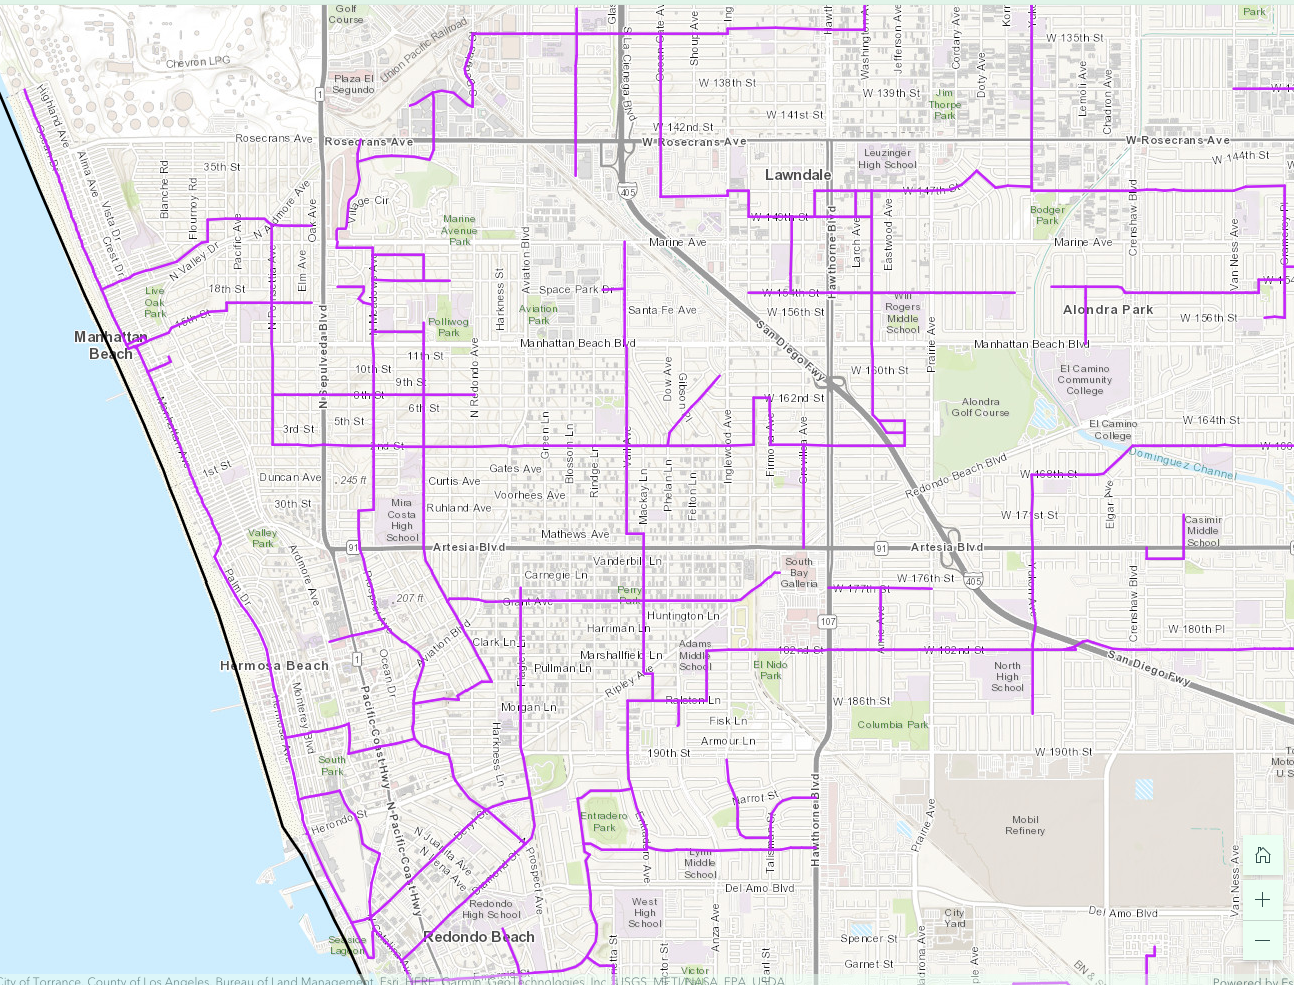
These purple lines are streets/roads where speed limits are 35 mph or less and are not truck routes. But notice how few of them cross the 405 Freeway or any of the high-traffic arterial roads/state highways. 

Not only are the legal crossings few and far between, necessitating long detours, but some of those purple streets are one-way. Going in the reverse direction will require an even longer detour. I can't make anything this ludicrous up. 

Consider the case of a student in North Redondo Beach who attends Mira Costa High School on an inter-district transfer. (The bus from North RB to RUHS in South RB is jammed and leaves kids stranded at the bus stop. To avoid this, some families beg for an inter-district transfer to the closer MCHS.)

If they had delivered on a bike lane along Artesia Blvd when they repaved it, students could take a direct route with a maximum grade of 5%. Not super pleasant, but doable if you had a protected bike lane.  Of course there is no bike lane of any kind because that would have removed free on-street parking.  Which is more important than our kids' lives and planetary health. 
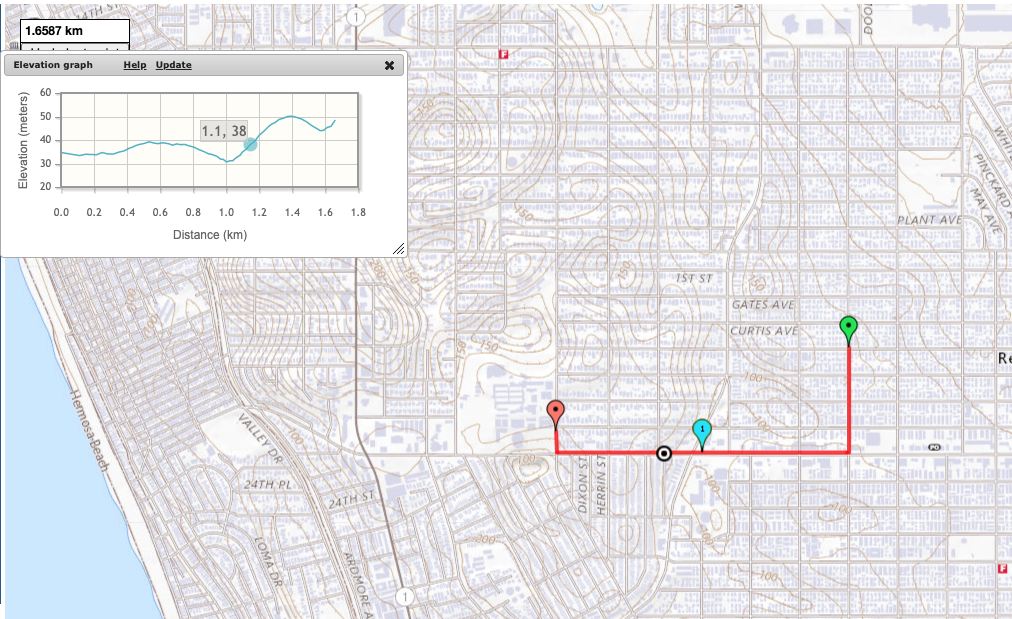
Direct route: 1.6587 km, max 5% grade

Instead, students must take a roundabout way to an existing traffic light at Robinson/2nd St. 
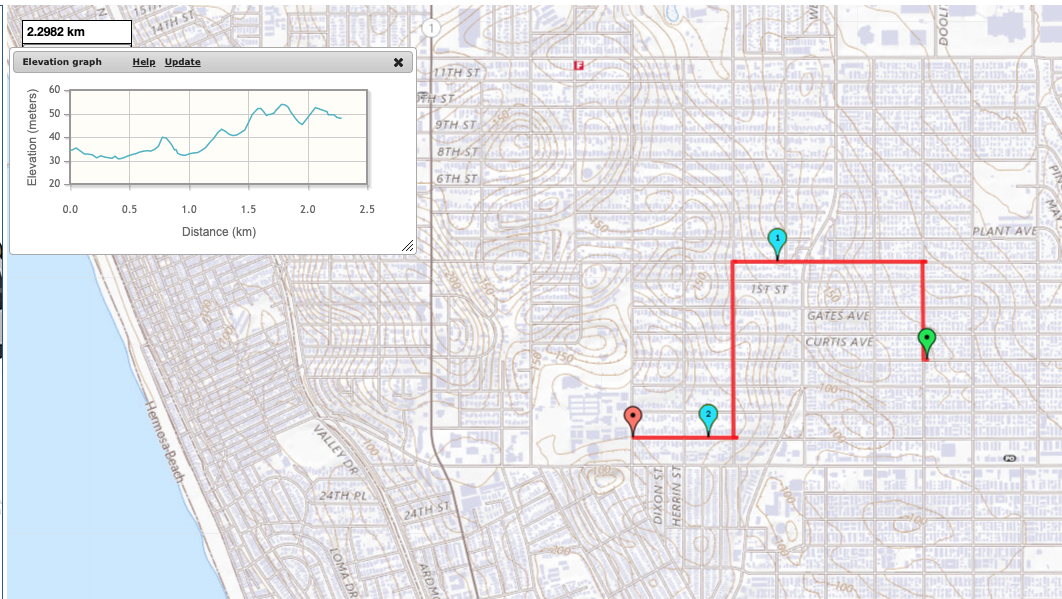
Westbound detour: 2.2982 km, killer 15% grade short hill

But Robinson is a 1-way street going westbound, and so is Plant, the only other street connected to the east side of that traffic signal. To get home, our student has to take a different detour that crosses Artesia Blvd (CA 91) twice and Aviation at an angled intersection. 
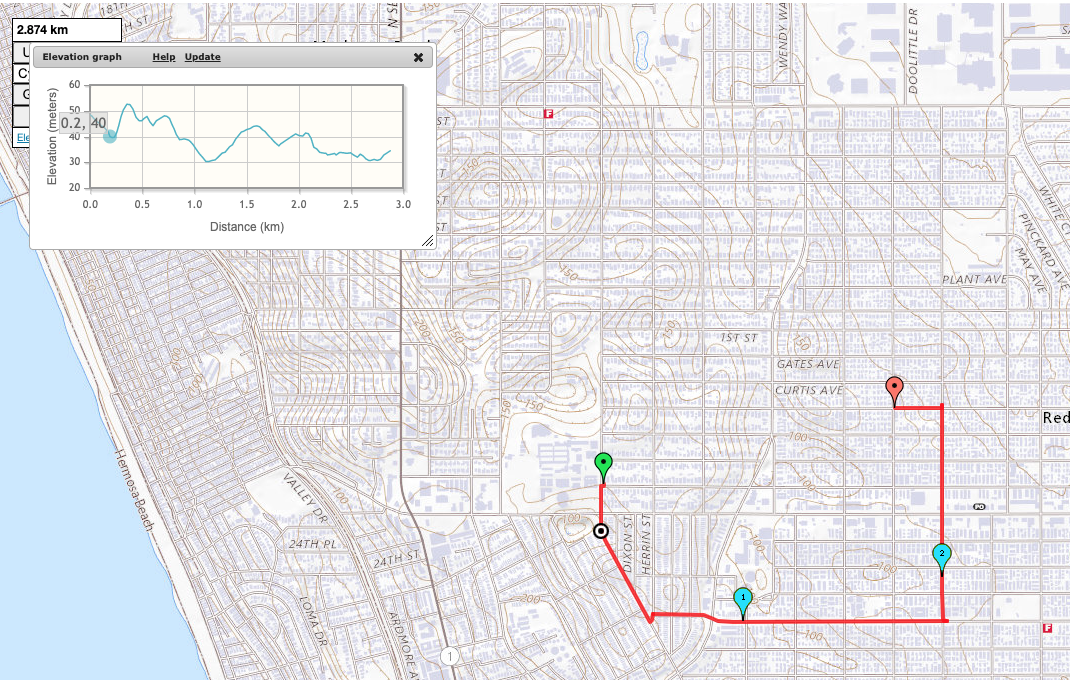
2.874 km, wheelie territory 15+% grade sustained climb

If they had built the 2011 Bicycle Master Plan, with a new traffic signal at Voorhees, our student would have had a reversible direct route. There's a 13% grade climb for half a block. But it's doable with an eBike or a very low gear or if they dismount and walk that section. 
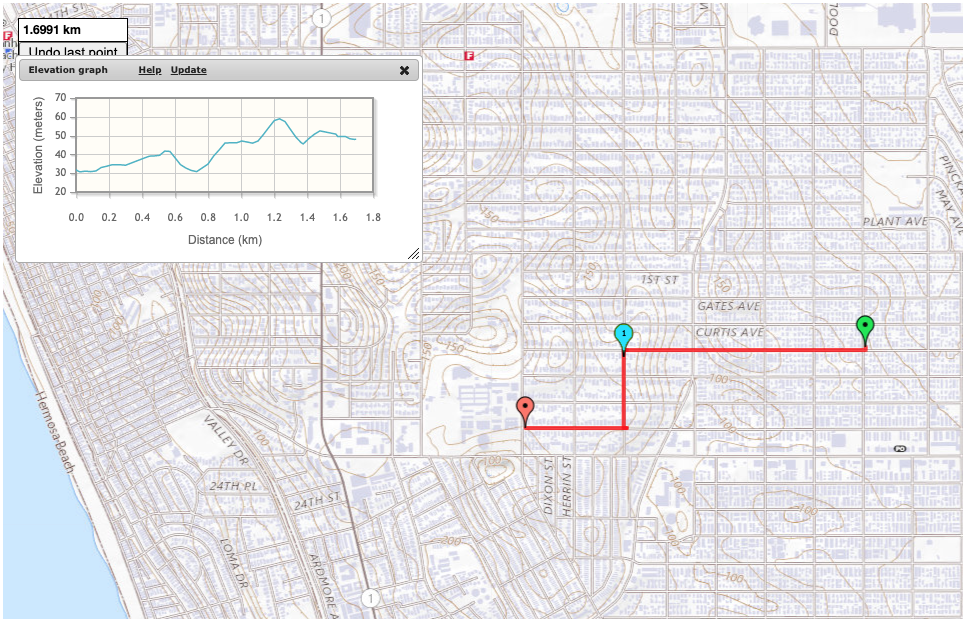
1.6991 km, max 13% grade

(I used mappedometer.com in metric to make calculating grades easier. )

In what world do we expect people in an automobile to take a detour that adds 75% more length to their trip and steepens climbs from 5% to 15% grade? That's just abusive. 

It's late, so I won't dissect why kids are riding eBikes in all sorts of unsafe ways. Spoiler, it's because the streets are hostile and don't allow them to take more direct and safer routes. 

This LTN will not make any difference when completed. 

2024 will look a lot like 2022. Only CO2 will be higher still.  And we'll have more dead kids*. 

* "the crash may have been a result of misaligned crosswalks due to the single diagonal cut handicap ramp, rather than two separate ramps aligned with the crosswalk." 
I have written before about the danger of single diagonal curb cuts.

Monday, July 04, 2022

Utility Cycling

 I do a lot of utility cycling around my suburban LA area since I bought an eBike. It's so easy to stop and take photos when out on bikes, I document some of the delightful or ridiculous things I see along the way. If you follow me on Twitter, you see the photos. 

There are some bike snobs who insist that riding eBikes is cheating and we are not exercising. So I wrote a Twitter thread about a recent 9.2 mi loop covering 3 errands. 

I found some numbers in a 2013 LA Times Opinion 

Sure enough, bicycling 10 miles in an hour burns 484 calories, according to the chart. Walking three miles in an hour burns 353 calories. And driving 30 miles in an hour burns — wait for it — 170 calories!

That presumes a lighter person on a lighter bike. My 53# eBike, 9# U-lock, 2" wide tires, middle-aged weight, and groceries mean I'm burning over 500 calories/hour if not using e-assist. I turn on e-assist only when going up steep or long hills, to get started at traffic lights/stop signs, to hit green lights (which are timed for car speeds), or to keep up with traffic on fast/busy roads.

I'm also a bit obsessed with data so I bought a Kill-a-Watt device to track how many watts I use recharging my eBike battery. I typically use 9-10 watt-hours (Wh) per mile in utility riding. 

1 food calorie = 1 kilocalorie of energy = 0.0011622 kWh

I used 90 watt-hours = 77.44 kcal/food calories of electricity. 

If I had ridden a non-assist bike at 10 mph, I would have used at least 500 calories. Assuming 77.44 of those calories came from e-assist, the breakdown would be 15% motor, 85% myself. 

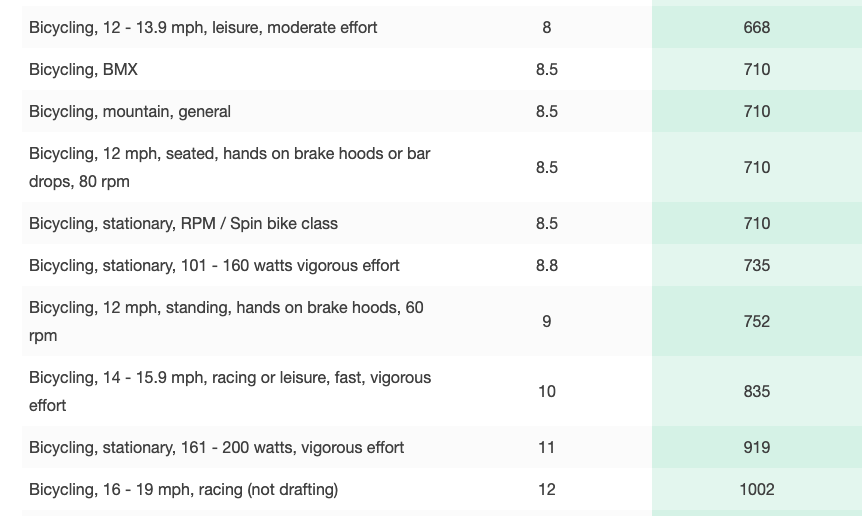
I did a little more searching for cycling speeds and calories burned. This website lets you plug in a weight and it calculates calories for a variety of cycling speeds. I put in 175# for myself, my gear, my heavier-than-usual eBike. Stationary cycling doesn't have wind resistance, which is why outdoor riding uses more calories at higher speeds. 


40 minutes of 15 mph riding on an eBike would be about 500 calories, same as the earlier estimate.  This is reassuring confirmation. I'm using my eBike to ride faster and further. Hills will not stop me! Numerous studies show that I am not alone.
The people who bought e-bikes increased their bicycle use from 2.1 kilometers (1.3 miles) to 9.2 kilometers (5.7 miles) on average per day; a 340% increase. The e-bike's share of all their transportation increased dramatically too; from 17% to 49%, where they e-biked instead of walking, taking public transit, and driving.

I take my eBike instead of my car for more of my errands. That's a win for me (exercise in a busy schedule), for my community (no wear tear and parking to provide) and for my region (no air pollution). 

I hope you try an eBike soon. If you have, drop a comment with your experiences. 


Monday, June 20, 2022

Rhetorical Tricks: Water Edition

 Sometimes, I read something that makes me so mad, I dash off a quick email to a friend who gets it. This time, I sent it off to the entire LWVC googlegroup and got some 'attagirl' affirmations back. So, let's share this take down. 

First, read These five people could make or break the Colorado River. Do you see what is wrong with this quote by one of the five people, Imperial Irrigation District (IID) commissioner J. B. Hamby? 

Hamby also pointed to the huge amounts of water that are still wasted, in his view, in cities such as Los Angeles. "It’s very easy to point at the alfalfa field, but what about drying out the lawns and useless grass?"

 The Colorado River (CR) is subject to all sorts of unrealistic math, well-documented elsewhere. We have these benchmark Colorado River allocations based upon 16.5 Million Acre Feet (MAC). Mexico gets 1.5 MAF, and the Upper and Lower Basin states get 7.5 MAF each. 

California gets the lion's share. In the benchmark scenario, farmers, mostly the IID, get 3.85 MAF out of California's 4.4 MAF. The remaining 0.55 MAF goes to the Metropolitan Water District (MWD), who sells it wholesale to 19 Million urban users based on a system of rights allocated decades ago.  It's roughly a 70/30 split between farmers and urban users before water rights transfers. (Cities buy about 0.5 MAF of CR water allocations from farmers.)

In practice, the CR does not have that much water and IID gets around 2.5-2.6 MAF and the cities get about half that, and then purchase more from farmers. 

IID commissioner Hamby pointed to LA lawns in a rhetorical trick called misdirection. It's often employed by magicians so you don't look at what they are really doing. 

Let's do the math! 

If we take him literally, let's run the numbers for the City of Los Angeles' Department of Water and Power, LA DWP. 

IID receives 2.5-2.6 MAF from the CO River. LADWP uses 0.5 MAF/year from all sources and serves 4 M people. An acre-foot serves 8 Angelenos for an entire year. (An acre foot serves 20 apartment dwellers in new, efficient homes!) 

About half is imported river water purchased from Metropolitan. 0.25 MAF The exact mix of SWP and COR water each year varies based on availability, but figure half on avg. 0.125 MAF 

City of LA residents are pretty water thrifty. About 1/3 might be outdoor use (perhaps 1/4). Not all of the outdoor irrigation in LA is lawns. Trees and shrubs are necessary to improve urban livability. 

Even if it were all lawns, we're down to (at maximum) 0.125 MAF/3 or 0.04 MAF compared to 2.5-2.6 MAF for the farmers of the IID. 

Anyway, finger pointing is a standard rhetorical trick to hijack the discussion. As always, verify. Does not pass the sniff test. 

Hamby said some other whoppers, which I won't go into here until I finish some other work with real deadlines.