I drove my 4200 pound minivan around today while running errands. I feel really badly about that, especially because today is Earth Day. My mind wandered back to
Daniel Nocera's talk at MIT on the Road, LA Edition, last month. I am posting some of his slides today, with his permission. Click on the pictures to view them in full detail. I put my own notes
below each slide.

Slide 1: Our current global energy inventory is shown to the left. Nathan Lewis and Daniel Nocera performed some back of the envelope calculations to predict future energy needs using middling estimates for population growth, economic growth, and energy efficiency gains. (28 to 35 Terra Watts (TW) are a couple of reasonable rough estimates but the figure could be much, much more, unless we change our behavior drastically.) That leaves us with a big fat question mark for future energy sources.
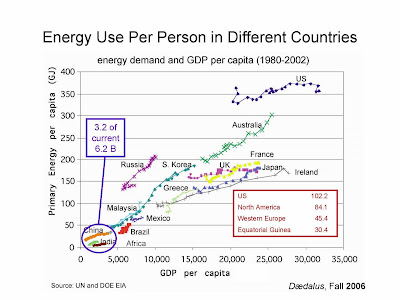
Slide 2: I find this slide showing per capita energy demand in giga Joules (GJ) versus per capita GDP for a variety of nations especially embarrassing. It shows how much we produce per unit of energy. The lower left hand corner represents 3.2 billion of the world's 6.2 billion people. The box at lower right shows relative energy consumption per capita in units that I forgot to note down. If energy consumption per capita were distributed equally, the figure would be close to the current usage in Equatorial Guinea.
We lead the world in per capita energy consumption--by a lot. Equally rich industrial nations are much more frugal with their energy. See how the US's per capita energy consumption has been flat for two decades? It's only party due to gains in energy efficiency. It is largely because we stopped manufacturing things and now import so much of our industrial goods. I will blog about that later; in the mean time, you can read
Goodie Bags and the Wealth of Nations.

Slide 3: Self Explanatory

Slide 4: Balanced Redox (reduction and oxidation) equations for the combustion of coal and methane, the main component of natural gas. Note that methane produces about twice as much energy per molecule of CO
2 produced than coal. (A negative value means that energy is released.) Oil is largely composed of alkanes, chains of carbon with some hydrogens hanging off them, produces a middling amount of CO
2 per unit of energy compared to coal and methane.

Slide 5: CO
2 emission versus primary energy consumption per capita. This graph illustrates the types of fuel used by the nations. For instance, the US (indigo blue) uses mainly oil and gas with some coal. Japan (light cyan blue) uses a mixture of oil and coal. France (yellow) falls dramatically below other industrial nations because of their reliance on nuclear power.
Look at China and India in the lower left hand corner. They represent over one third of the world's population. If you want to be really scared, read
this projection of world population from the International Institute for Applied Systems Analysis.

Slide 6: This is a popular graph of CO
2 concentration versus time measured at the top of Mauna Loa, a volcano in Hawaii. The small zig zags demonstrate that the earth is a living, breathing entity. Plants absorb CO
2 in the growing season. Because there is more land surface in the northern (boreal) hemisphere than in the southern one, there are slight depressions in CO
2 concentrations each boreal summer. However, the overall trend is up. That means we are putting much more CO
2 into the atmosphere than the planet can absorb.
Antarctic ice cores show us that the level of CO
2 in the last 50 years is unprecedented in the past 650,000 years. Mixing times (the amount of time it takes to thoroughly mix a system) are shown below. It takes about 35 years to mix the atmosphere and the top layer of the ocean. It takes about 400-1000 years to mix the top layer of the ocean with the bottom layer.

Slide 13: I fast forwarded through all the pictures of retreating glaciers and coral bleaching. They are too depressing to show.
This slide shows that there is probably no way to get from here to there without letting go of my opposition to nuclear power. It also demonstrates that windmills will not be sufficient. However, solar power holds a great deal of promise. I have some professional experience with advanced photovoltaic technology and I agree with Professor Nocera. I also have some personal experience with low-tech solar hot water panels and I think almost everyone should have them.
What will the future look like? It largely depends upon our own collective behavior. Nocera says take a good look at Equatorial Guinea. I say, add some energy saving technology. Change some of our personal behavior. It
could be a nice place to live.
But we have to act now. The longer we delay, the more bitter the medicine.
Note: The slides are from
Daniel Nocera, but the notes are mine. I am responsible for all errors.


