I spent some time with the Earth System Research Laboratory’s data visualizer web portal to find out.
The global sea level pressure is about 1013 millibar (mb); some places run higher, others lower. Short-term fluctuations are called weather. As I explained previously in The rain gate has opened,
High pressure systems are associated with warm and sunny weather. Low pressure systems are associated with 'disturbed', cloudy and stormy weather.Our “normal” January 1 northern hemisphere sea level pressure looks like this. (This climatology is an average of the thirty January firsts between 1981-2010 inclusive.) We enjoy a relatively dry and warm climate in southern California due to a moderate offshore high-pressure region aka the "Pacific High”. The magenta area to its northwest is the "Aleutian Low” that normally steers storms into the Pacific northwest.
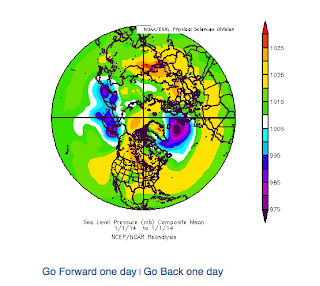
This is what it looked like on January 1, 2014. Do you see that yellow offshore blob? You could call it a banana, but meteorologists call it an (atmospheric) ridge. That high-pressure region is deflecting storms away from the entire west coast of North America.
Subtract the daily weather from climatology and you get the anomaly or deviance from normal. A 10 mb anomaly is a strong feature capable of bringing rain or sunshine depending on the sign of the deviance.
A 10-15 millibar anomaly is just the day to day fluctuation we call weather. But, over a longer time period, it spells trouble.
What's the persistence?
I made a plot for the climatology of December sea level pressure. In a typical December, a series of storms form in the Aleutian low and move towards the Pacific northwest, then push southward toward SoCal. We experience light and cool rains (or snowfall at higher elevations) from this type of system.
In 2013, there was a persistent ridge of over 12 mb above normal for the entire month of December! No wonder we have received only trace rainfall in December 2013.
Compare this with the anomaly in December 2010, when we received over 10" of rainfall. That's an anomaly of -10 mb instead of +12 mb. What a difference 22 mb makes.
Aside:
That low pressure trough in the north Atlantic in December 2013 isn't a picnic for people in the UK.Parts of southern England have seen double their usual December rainfall.
Links:
- LA Civic Center Monthly Total Precipitation (inches) 1906-2013.
- Make your own plots with the ESRL Daily Mean Composite web portal.
- If you need help getting started, read the tutorial.
- BMGM's LA Rainfall series
- This is cross-posted at LA Observed


I’m not seeing anomalies in southern Caliornia? Both 2013 and 2010 look nice and white to me.
ReplyDeleteSouthern Québec however looks like December 2013 tended toward higher pressure — and we had 112 mm precipitation (vs 30-year average of 81).
The anomalies are upwind from us, steering the storms away or toward us.
Delete