 This looks very easy, right? But it was a PITA to get from the data I downloaded from the Guardian website to the plots shown here.
I write notes to myself about data workups, both the statistical/science decisions and the software tricks. I thought I would show you how unnecessarily hard this is.
[I used to be embarrassed about how much time I spent on opening data files and getting different data files to play nice with each other--a process called data fusion. But, then I heard a bigwig at USGS state at a conference that her staff devote 85% of their time troubleshooting data reading issues and only 15% on the science stuff. I am so grateful for her openness. How else would I know that I hit par?]
So here are my data reading notes.
First, if you use your browser to go their link, All the US weather stations (CSV)
and then save it as plain text using Firefox (my browser of choice but YMMV), you get one file with all of the data written on one line!
I like to work up data on my Macbook Pro using X11 and the Mac flavor of Unix.
prompt> wc us.csv
1 21678 967827 us.csv
Yup, that's one line, 21678 words and 96827 characters.
To break it up into multiple lines that I (and my machine) can read,
I used vi and ex
prompt> vi us.csv
then type this easy to parse line (ctr-V means press ctr and v at the same time)
:g/ctr-V ctr-M/s//ctr-M/g
That turned the ^M characters that read as tabs on my computer
to Unix carriage returns.
Then I tried to use grep to find files tagged with
CA
and
CALIFORNIA
but discovered that the structure of the data for each station was slightly different.
Some were marked in the second field, after station name,
CALIFORNIA
CALIFORNI
CALIFORN
CA
and LOS ANGELES just omitted the state field altogether.
In all, I found 6 climate stations in California
(if you find more, please leave a comment!).
From North to South:
Eureka
Sacramento
San Francisco
Fresno
Los Angeles
San Diego
[If I were smart, I would have wrote a script to grep for every CA station in the Worldwide WMO station list by WMO identifier against the us.csv climate file. Consider this your homework assignment and send me the stations that I missed.]
I used unix again.
prompt> grep FRESNO us.csv > fre.csv
and so forth for each of the 6 stations to put them in a separate file.
Then I had to get rid of the extra column of CA variants in 5 of the 6 fields. I used MS Excel to open up each station's csv file, delete the column, and save again in csv.
There should be a way to do it using sed or awk, but I forgot how to do it. When I looked it up, the simple
prompt> awk < fre.csv '{print $1, $2, $3}'
showed that I had real problems.
prompt> awk < fre.csv '{print $1}'
gives FRESNO, as you would expect, but
prompt> awk < fre.csv '{print $2}'
gives
CALIFORNIA,723890,36.8,119.7,2009,8.8,11,13.4,16.8,24.1,24.3,29.4,27.7,26.5,17.6,,
because awk is expecting spaces as delimiters and there are no spaces after
CALIFORNIA FRESNO, CALIFORNIA,723890,36.8,119.7,1887,,,,,,,,,23.7,19.9,13.2,7.7
What to do?
prompt> awk < fre.csv '{FS = ","; print $1,$3,$4,$5,$6,$7,$8,$9,$10,$11,$12,$13,$14,$15,$16,$17}'
does the trick, but, by the time I remembered the awk syntax, I had already used MS Excel to do it for me.
I tried to make plots with Excel, but found it too limiting. So I resorted to my favorite programming language for parsing data, Interactive Data Language, IDL. If you want to be a meteorologist, you need to learn it. If you are at a university, chances are very good that your school has a site license for it.
If you have IDL version 7.1 and later, there is a handy-dandy built-in procedure that reads csv files called "read_csv.pro" !
IDL> eur = read_csv("eur.csv")
IDL> sac = read_csv("sac.csv")
IDL> sfo = read_csv("sfo.csv")
IDL> fre = read_csv("fre.csv")
IDL> lax = read_csv("lax.csv")
IDL> san = read_csv("san.csv")
Type help to find out what is in your data structure.
IDL> help, fre, /structure
** Structure <18d5208>, 18 tags, length=18704, data length=18696, refs=1:
FIELD01 STRING Array[123]
.
.
.
FIELD18 DOUBLE Array[123]
If you cleaned up your fields, then
field01 = station
field02 = wmo_id
field03 = latitude
field04 = longitude
field05 = year
field06 = Jan mean temperature in Celcius
field12 = Jul
field18 = Dec
I reversed the default plot and background colors
IDL> !p.background=255
IDL> !p.color=0
and used color table 39, rainbow + white
IDL> loadct,39
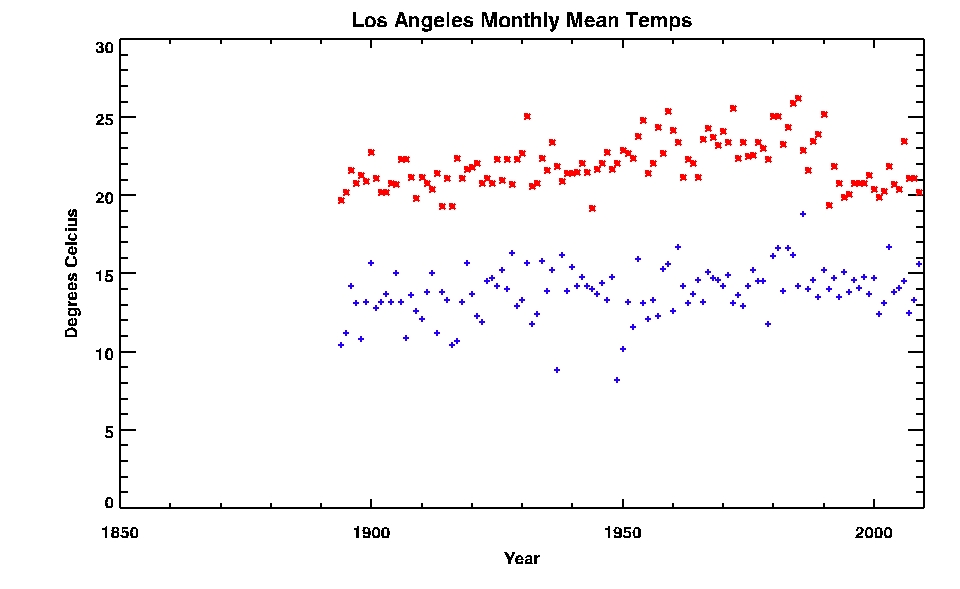
IDL> plot, lax.field05, lax.field06, xrange=[1850,2010], yrange=[0,30], min_value = 1., psym = 1, $
IDL> title = 'Los Angeles Monthly Mean Temps', xtitle = 'Year', ytitle = 'Degrees Celcius'
IDL> oplot, lax.field05, lax.field06, min_value = 1., psym = 1, color = 50
IDL> oplot, lax.field05, lax.field12, min_value = 1., psym = 2, color = 250
IDL> saveimage,'LAX_JanJul_Climate.jpg',/jpeg,quality=100
If you haven't already downloaded and installed Liam Gumley's saveimage.pro, what are you waiting for? You can find it here. Save it to somewhere early in your IDL path.
If you want to get fancy, you can plot all six CA stations on one page.
 I want to discuss the features that I see in these graphs, but at a later date. Iris has a TKD party right now.
I wish I could say data handling was easier in my field... but actually, the fact that it is hard to handle is sort of why I have a job. So maybe I should just be grateful for the complexity.
ReplyDelete(But I agree- a lot of it is unnecessary. In my field, some is due to the actual nature of the science. But a lot is due to the fact that there isn't a lot of money or glory in working on standards.)
I work with Data too. A lot of data. My tool of choice to modify and re-format raw files is UltraEdit. As a text editor it is unparalleled. Many of the formatting sequences you mentioned in your post can be automated with macros in UltraEdit. It can work on both 'line' and 'column' editing.
ReplyDeleteWorking in the data collection end of things has been pretty interesting the last few years. Advances in both sensing equipment and Data Logging abilities has enabled us to collect data in ways that 'raise the bar' in both quality and quantity of Data. It's pretty interesting to see the different methods that our counterparts in USGS and NOAA come up with in applying the new technologies.
dg
What a hassle... I used to be an analytical chemist, and whilst I loved the research, the lab work and the analytical process, I loathed the programming...
ReplyDeletethank you for your comment on my dip dyeing experiment!